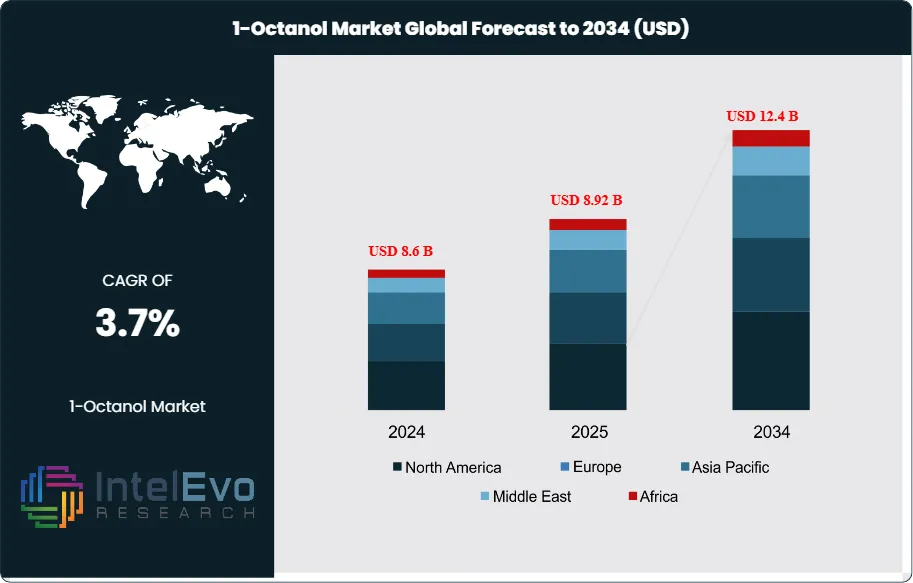
The 1-Octanol market is valued at approximately USD 8.6 billion in 2024 and is projected to reach nearly USD 12.4 billion by 2034, registering a steady CAGR of about 3.7% during 2025–2034. Growing demand for plasticizers, surfactants, and specialty chemicals across pharmaceuticals and personal care is driving long-term consumption. With rapid expansion in biodegradable formulations and green-chemistry–based alcohol production, 1-Octanol is emerging as a critical building block for next-generation industrial and cosmetic applications.
Demand has expanded steadily over the past decade, with a brief pandemic-era dip in 2020 followed by normalization across plastics, fragrances, and industrial processing. From 2018–2022, volumes grew at roughly 2%–3% annually, and the medium-term outlook remains resilient as downstream end uses diversify beyond traditional plasticizers into higher-value cosmetic and specialty chemical applications. By application, plasticizers remain the single largest outlet, accounting for an estimated 38%–40% of 2023 consumption, supported by flexible PVC in construction, cables, and consumer goods. Fragrances and flavor esters represent about 22%–25%, solvents and defoamers around 18%–20%, and cosmetics/personal care roughly 12%–14%, with the balance in textiles, paper, and niche intermediates.
Growth is underpinned by multiple demand-side and supply-side drivers. Rising spend on beauty and personal care, particularly in Asia, is lifting consumption of emollient fatty alcohols and octyl esters. On the supply side, incremental capacity additions and improved catalyst selectivity in oxo and Ziegler routes are trimming unit costs and reducing off-spec formation. Key challenges persist: volatility in olefin feedstocks and hydrogen costs, tightening environmental rules (e.g., restrictions on certain phthalates in plasticizers), and decarbonization pressures that raise the bar for solvent emissions and process energy intensity. Procurement risks tied to logistics and energy markets continue to influence contract pricing and inventory strategies.
Technology is reshaping the landscape. Producers are piloting bio-based octanol via fermentation and catalytic upgrading of bio-intermediates, while digital twins, advanced process control, and AI-assisted predictive maintenance are lifting plant utilization and shrinkage yields by low-single-digit percentage points. Downstream, formulators are adopting higher-purity grades for fine fragrances and skincare, with automation improving batch consistency in esterification units.
Regionally, Asia Pacific leads with an estimated 47%–50% revenue share in 2023, anchored by China, India, and Southeast Asia; Europe follows at roughly 22%–24% on the strength of specialty fragrances and stringent quality standards; North America accounts for about 18%–20% with stable industrial and consumer demand. Investment hotspots to watch include integrated petrochemical hubs in China’s coastal provinces, Indian specialty chemical clusters, and EU sites advancing low-carbon, bio-content octanol—areas positioned to capture premium growth as sustainability and performance requirements rise.
Key Takeaways
Market Growth: The 1-Octanol market totals USD 8.6 billion in 2024 and is projected to reach USD 12.4 billion by 2034 (3.7% CAGR), adding ~USD 3.8 billion in incremental value as demand advances in flavors & fragrances, plasticizers, industrial solvents, and personal care.
Application: Flavors & Fragrances leads with 36.5% share in 2023 (≈USD 2.26 billion), underpinned by robust consumption of octyl esters in fine fragrances and flavorings and steady premiumization in consumer products.
Purity: >98% purity grades command 61.2% share (≈USD 3.79 billion) due to stringent quality needs in pharmaceuticals, cosmetics, and high-end fragrance bases; this segment is poised to outpace overall market growth as compliance thresholds tighten.
Driver: Industrial grade 1-Octanol accounts for 54.6% of 2023 revenue (≈USD 3.39 billion), supported by plasticizer and lubricant formulations and capacity reliability in integrated petrochemical hubs—particularly across Asia’s construction and manufacturing value chains.
Restraint: Regulatory scrutiny on phthalate plasticizers and VOC emissions, coupled with petrochemical feedstock volatility, caps upside—reflected in a modest 2.5% CAGR, which trails many specialty chemical adjacencies by roughly ~100 bps.
Opportunity: Mix-upgrade toward >98% purity in high-growth end uses (pharma, premium cosmetics) is a margin and revenue lever; a 5-pp increase in high-purity share (from 61.2% to ~66.2%) implies ~USD 0.31 billion additional high-purity sales on the 2023 base.
Trend: Producers are prioritizing specialty and high-purity cuts and debottlenecking for tighter specifications, while formulators expand octyl ester portfolios; leading suppliers (e.g., BASF, OQ Chemicals, Sasol, KH Neochem) are emphasizing premium grades and reliability in supply to win share.
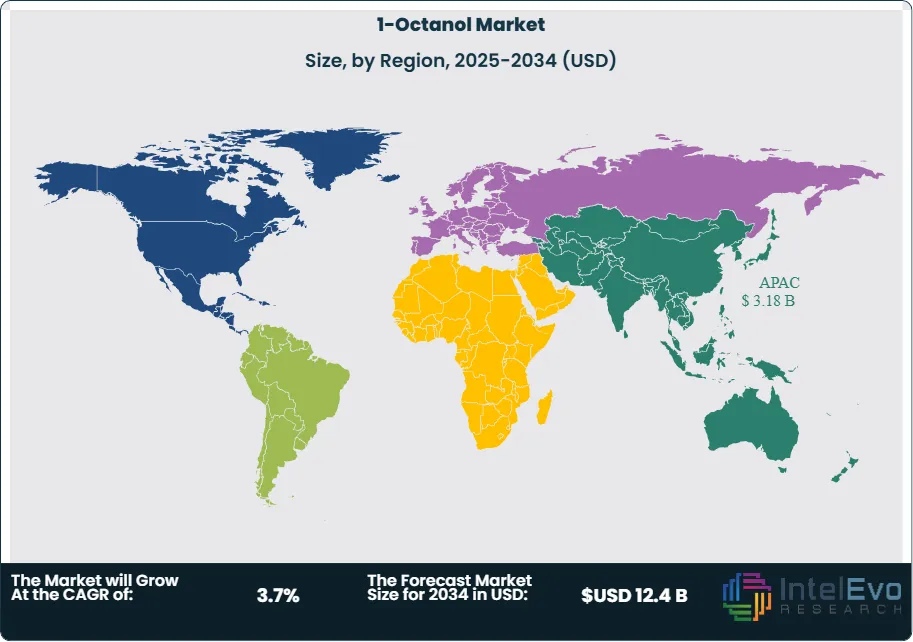
Regional Analysis: APAC dominates with 36.4% share (≈USD 3.25 billion) on the strength of its industrial base and policy support; the rest of world contributes 63.5% (≈USD 3.94 billion), with Europe and North America together comprising roughly half of this remainder and emerging hotspots in India and ASEAN expected to gain mix in high-purity demand.
Type Analysis
In 2025, the 1-Octanol market remains skewed toward high specifications: Above 98% purity accounts for roughly ~62% of global demand (≈ USD 4.0–4.1 billion out of an estimated USD 6.5 billion market), sustained by its critical role in premium fragrances, flavor esters, and high-end personal care where trace impurities affect odor, taste, and regulatory conformance. This tranche is set to expand faster than the overall market (≈ ~3.0% CAGR through 2033 vs. market 2.5%), aided by tighter quality standards and mix-upgrade in export-oriented specialty chemicals.
The Up to 98% purity segment continues to serve cost-sensitive industrial uses—plasticizer intermediates, solvent systems, and defoamers in pulp & paper and textiles—maintaining a sizable ~38% share. While volume growth is steady, pricing power is modest given competition from alternate solvents and cyclical downstreams. By Grade, Industrial Grade still holds a slim majority (just over ~53% in 2025) due to entrenched consumption in plasticizers and lubricants, but Food Grade is the faster riser (≈ 3.2–3.5% CAGR) as flavor houses and beverage formulators prioritize traceability, allergen control, and clean-label inputs. Leading suppliers (e.g., BASF, OQ Chemicals, Sasol, KH Neochem) are tilting capacity toward high-purity and food-grade cuts to capture premium margins and reduce off-spec losses via advanced process control and catalyst improvements.
Application Analysis
Flavors & Fragrances remains the largest application at ~36–37% of 2025 demand (≈ USD 2.3–2.4 billion), supported by premiumization in beauty and fine fragrance and steady launches of octyl-ester portfolios. Plasticizers follow at roughly ~31% (≈ USD 2.0 billion), anchored by flexible PVC in construction wiring, flooring, and consumer goods; performance and regulatory scrutiny are pushing formulators toward tighter-spec octanol-derived esters. Pharmaceuticals contribute ~11% (≈ USD 0.7 billion) as octanol serves both as solvent and intermediate for select APIs, while Chemicals (surfactants, coatings intermediates) comprise ~13% (≈ USD 0.85 billion) on the back of diversified industrial demand.
Paints & Coatings accounts for ~7% (≈ USD 0.46 billion), where octanol improves film formation and adhesion, particularly in water-borne systems. The Others bucket (~1–2%) includes agricultural adjuvants and niche extraction processes. Across applications, mix is shifting to higher-purity inputs; a +3–4 pp swing toward >98% grades by 2030 would unlock incremental premium revenue even under a moderate volume trajectory.
End-Use Analysis
Demand is diversified across Personal Care & Cosmetics, Plastics & Polymers, Food & Beverage, Pharmaceuticals, and Industrial Processing (pulp & paper, textiles). In 2025, Personal Care & Cosmetics represents roughly ~20–22% of consumption, benefiting from sustained growth in skincare and fine fragrance, especially in Asia’s masstige and premium tiers. Plastics & Polymers (plasticizer value chains) capture ~28–32%, closely tracking construction, white goods, and cable demand, with upgrades to consistent-spec inputs reducing rework and scrap.
Food & Beverage absorbs ~10–12% via flavoring systems, with food-grade compliance (FCC, EU additives) driving supplier differentiation. Pharmaceuticals sits near ~10–12%, supported by solvent and intermediate roles under stricter GMP expectations. Industrial Processing and Textiles/Paper collectively contribute ~20–22%, leveraging octanol’s defoaming and solvency benefits; adoption is stable, though efficiency programs and alternative process aids cap upside.
Regional Analysis
Asia Pacific remains the demand and supply anchor, controlling approximately 36.4% of 2025 revenue (≈ USD 3.25 billion) on the strength of integrated petrochemical hubs in China and Southeast Asia, India’s specialty chemicals build-out, and vibrant end-markets in beauty, food, and PVC. Europe holds ~22–24%, concentrated in high-spec fragrances (France, Switzerland) and stringent quality regimes that favor >98% grades; decarbonization policies are also accelerating process optimization and potential bio-routes. North America represents ~18–20%, underpinned by stable industrial uses and a resilient consumer base in personal care and home care.
Latin America (≈ 7–9%) is a rising outlet led by Mexico and Brazil, where flexible packaging and consumer goods support plasticizer and fragrance demand. Middle East & Africa (≈ 9–11%) benefits from petrochemical adjacency and infrastructure projects, gradually improving self-sufficiency. Looking to 2030–2033, Asia Pacific is poised to outgrow the global average by ~50–100 bps, while Europe and North America focus on value over volume through higher-purity, food-grade, and low-carbon offerings; selective investments in bio-based or low-emission octanol could lift regional premiums and secure long-term contracts.
By Purity (Upto 98%, Above 98%), By Grade (Food Grade, Industrial Grade), By Application (Plasticizer, Flavores & Fragrances, Pharmaceuticals, Chemicals, Paints & Coatings, Others)
Research Methodology
Primary Research- 100 Interviews of Stakeholders
Secondary Research
Desk Research
Regional scope
North America (United States, Canada, Mexico)
Latin America (Brazil, Argentina, Columbia)
East Asia And Pacific (China, Japan, South Korea, Australia, Cambodia, Fiji, Indonesia)
Sea And South Asia (India, Singapore, Thailand, Taiwan, Malaysia)
Eastern Europe (Poland, Russia, Czech Republic, Romania)
Western Europe (Germany, U.K., France, Spain, Itlay)
Middle East & Africa (GCC Countries, Egypt, Nigeria, South Africa, Israel)
Competitive Landscape
Axxence Aromatic GmbH, Hebei Guanlang Biotechnology Co., Ltd., BASF SE, Kao Chemical Corporation, Sasol Limited, Liaoning Huaxing Group Chemical, Bharat Petroleum Corporation Limited, Shandong Zhishang Chemical Co., Ltd., Sisco Research Laboratories Pvt. Ltd., SABC, Others
Customization Scope
Customization for segments, region/country-level will be provided. Moreover, additional customization can be done based on the requirements.
Pricing and Purchase Options
Avail customized purchase options to meet your exact research needs. We have three licenses to opt for: Single User License, Multi-User License (Up to 5 Users), Corporate Use License (Unlimited User and Printable PDF).
TABLE OF CONTENTS
1. EXECUTIVE SUMMARY
1.1. MARKET SNAPSHOT
1.2. KEY FINDINGS & INSIGHTS
1.3. ANALYST RECOMMENDATIONS
1.4. FUTURE OUTLOOK
2. RESEARCH METHODOLOGY
2.1. MARKET DEFINITION & SCOPE
2.2. RESEARCH OBJECTIVES: PRIMARY & SECONDARY DATA SOURCES
2.3. DATA COLLECTION SOURCES
2.3.1. COVERAGE OF 100+ PRIMARY RESEARCH/CONSULTATION CALLS WITH INDUSTRY STAKEHOLDERS
FIGURE 17 NORTH AMERICA 1-OCTANOL CURRENT AND FUTURE TYPE ANALYSIS, 2025–2034, (USD MILLION)
FIGURE 18 NORTH AMERICA 1-OCTANOL CURRENT AND FUTURE END USER ANALYSIS, 2025–2034, (USD MILLION)
FIGURE 19 MARKET SHARE BY COUNTRY
FIGURE 20 LATIN AMERICA 1-OCTANOL CURRENT AND FUTURE TYPE ANALYSIS, 2025–2034, (USD MILLION)
FIGURE 21 LATIN AMERICA 1-OCTANOL CURRENT AND FUTURE END USER ANALYSIS, 2025–2034, (USD MILLION)
FIGURE 22 MARKET SHARE BY COUNTRY
FIGURE 23 EASTERN EUROPE 1-OCTANOL CURRENT AND FUTURE TYPE ANALYSIS, 2025–2034, (USD MILLION)
FIGURE 24 EASTERN EUROPE 1-OCTANOL CURRENT AND FUTURE END USER ANALYSIS, 2025–2034, (USD MILLION)
FIGURE 25 MARKET SHARE BY COUNTRY
FIGURE 26 WESTERN EUROPE 1-OCTANOL CURRENT AND FUTURE TYPE ANALYSIS, 2025–2034, (USD MILLION)
FIGURE 27 WESTERN EUROPE 1-OCTANOL CURRENT AND FUTURE END USER ANALYSIS, 2025–2034, (USD MILLION)
FIGURE 28 MARKET SHARE BY COUNTRY
FIGURE 29 EAST ASIA AND PACIFIC 1-OCTANOL CURRENT AND FUTURE TYPE ANALYSIS, 2025–2034, (USD MILLION)
FIGURE 30 EAST ASIA AND PACIFIC 1-OCTANOL CURRENT AND FUTURE END USER ANALYSIS, 2025–2034, (USD MILLION)
FIGURE 31 MARKET SHARE BY COUNTRY
FIGURE 32 SEA AND SOUTH ASIA 1-OCTANOL CURRENT AND FUTURE TYPE ANALYSIS, 2025–2034, (USD MILLION)
FIGURE 33 SEA AND SOUTH ASIA 1-OCTANOL CURRENT AND FUTURE END USER ANALYSIS, 2025–2034, (USD MILLION)
FIGURE 34 MARKET SHARE BY COUNTRY
FIGURE 35 MIDDLE EAST AND AFRICA 1-OCTANOL CURRENT AND FUTURE TYPE ANALYSIS, 2025–2034, (USD MILLION)
FIGURE 36 MIDDLE EAST AND AFRICA 1-OCTANOL CURRENT AND FUTURE END USER ANALYSIS, 2025–2034, (USD MILLION)
FIGURE 37 NORTH AMERICA 1-OCTANOL CURRENT AND FUTURE MARKET VOLUME SHARE REGIONAL ANALYSIS, 2025–2034, (USD MILLION)
FIGURE 38 U.S. 1-OCTANOL CURRENT AND FUTURE TYPE ANALYSIS, 2025–2034, (USD MILLION)
FIGURE 39 U.S. 1-OCTANOL CURRENT AND FUTURE END USER ANALYSIS, 2025–2034, (USD MILLION)
FIGURE 40 CANADA 1-OCTANOL CURRENT AND FUTURE TYPE ANALYSIS, 2025–2034, (USD MILLION)
FIGURE 41 CANADA 1-OCTANOL CURRENT AND FUTURE END USER ANALYSIS, 2025–2034, (USD MILLION)
FIGURE 42 LATIN AMERICA 1-OCTANOL CURRENT AND FUTURE MARKET VOLUME SHARE REGIONAL ANALYSIS, 2025–2034, (USD MILLION)
FIGURE 43 MEXICO 1-OCTANOL CURRENT AND FUTURE TYPE ANALYSIS, 2025–2034, (USD MILLION)
FIGURE 44 MEXICO 1-OCTANOL CURRENT AND FUTURE END USER ANALYSIS, 2025–2034, (USD MILLION)
FIGURE 45 BRAZIL 1-OCTANOL CURRENT AND FUTURE TYPE ANALYSIS, 2025–2034, (USD MILLION)
FIGURE 46 BRAZIL 1-OCTANOL CURRENT AND FUTURE END USER ANALYSIS, 2025–2034, (USD MILLION)
FIGURE 47 ARGENTINA 1-OCTANOL CURRENT AND FUTURE TYPE ANALYSIS, 2025–2034, (USD MILLION)
FIGURE 48 ARGENTINA 1-OCTANOL CURRENT AND FUTURE END USER ANALYSIS, 2025–2034, (USD MILLION)
FIGURE 49 COLUMBIA 1-OCTANOL CURRENT AND FUTURE TYPE ANALYSIS, 2025–2034, (USD MILLION)
FIGURE 50 COLUMBIA 1-OCTANOL CURRENT AND FUTURE END USER ANALYSIS, 2025–2034, (USD MILLION)
FIGURE 51 REST OF LATIN AMERICA 1-OCTANOL CURRENT AND FUTURE TYPE ANALYSIS, 2025–2034, (USD MILLION)
FIGURE 52 REST OF LATIN AMERICA 1-OCTANOL CURRENT AND FUTURE END USER ANALYSIS, 2025–2034, (USD MILLION)
FIGURE 53 EASTERN EUROPE 1-OCTANOL CURRENT AND FUTURE MARKET VOLUME SHARE REGIONAL ANALYSIS, 2025–2034, (USD MILLION)
FIGURE 54 POLAND 1-OCTANOL CURRENT AND FUTURE TYPE ANALYSIS, 2025–2034, (USD MILLION)
FIGURE 55 POLAND 1-OCTANOL CURRENT AND FUTURE END USER ANALYSIS, 2025–2034, (USD MILLION)
FIGURE 56 RUSSIA 1-OCTANOL CURRENT AND FUTURE TYPE ANALYSIS, 2025–2034, (USD MILLION)
FIGURE 57 RUSSIA 1-OCTANOL CURRENT AND FUTURE END USER ANALYSIS, 2025–2034, (USD MILLION)
FIGURE 58 CZECH REPUBLIC 1-OCTANOL CURRENT AND FUTURE TYPE ANALYSIS, 2025–2034, (USD MILLION)
FIGURE 59 CZECH REPUBLIC 1-OCTANOL CURRENT AND FUTURE END USER ANALYSIS, 2025–2034, (USD MILLION)
FIGURE 60 ROMANIA 1-OCTANOL CURRENT AND FUTURE TYPE ANALYSIS, 2025–2034, (USD MILLION)
FIGURE 61 ROMANIA 1-OCTANOL CURRENT AND FUTURE END USER ANALYSIS, 2025–2034, (USD MILLION)
FIGURE 62 REST OF EASTERN EUROPE 1-OCTANOL CURRENT AND FUTURE TYPE ANALYSIS, 2025–2034, (USD MILLION)
FIGURE 63 REST OF EASTERN EUROPE 1-OCTANOL CURRENT AND FUTURE END USER ANALYSIS, 2025–2034, (USD MILLION)
FIGURE 64 WESTERN EUROPE 1-OCTANOL CURRENT AND FUTURE MARKET VOLUME SHARE REGIONAL ANALYSIS, 2025–2034, (USD MILLION)
FIGURE 65 GERMANY 1-OCTANOL CURRENT AND FUTURE TYPE ANALYSIS, 2025–2034, (USD MILLION)
FIGURE 66 GERMANY 1-OCTANOL CURRENT AND FUTURE END USER ANALYSIS, 2025–2034, (USD MILLION)
FIGURE 67 FRANCE 1-OCTANOL CURRENT AND FUTURE TYPE ANALYSIS, 2025–2034, (USD MILLION)
FIGURE 68 FRANCE 1-OCTANOL CURRENT AND FUTURE END USER ANALYSIS, 2025–2034, (USD MILLION)
FIGURE 69 UK 1-OCTANOL CURRENT AND FUTURE TYPE ANALYSIS, 2025–2034, (USD MILLION)
FIGURE 70 UK 1-OCTANOL CURRENT AND FUTURE END USER ANALYSIS, 2025–2034, (USD MILLION)
FIGURE 71 SPAIN 1-OCTANOL CURRENT AND FUTURE TYPE ANALYSIS, 2025–2034, (USD MILLION)
FIGURE 72 SPAIN 1-OCTANOL CURRENT AND FUTURE END USER ANALYSIS, 2025–2034, (USD MILLION)
FIGURE 73 ITALY 1-OCTANOL CURRENT AND FUTURE TYPE ANALYSIS, 2025–2034, (USD MILLION)
FIGURE 74 ITALY 1-OCTANOL CURRENT AND FUTURE END USER ANALYSIS, 2025–2034, (USD MILLION)
FIGURE 75 REST OF WESTERN EUROPE 1-OCTANOL CURRENT AND FUTURE TYPE ANALYSIS, 2025–2034, (USD MILLION)
FIGURE 76 REST OF WESTERN EUROPE 1-OCTANOL CURRENT AND FUTURE END USER ANALYSIS, 2025–2034, (USD MILLION)
FIGURE 77 EAST ASIA AND PACIFIC 1-OCTANOL CURRENT AND FUTURE MARKET VOLUME SHARE REGIONAL ANALYSIS, 2025–2034, (USD MILLION)
FIGURE 78 CHINA 1-OCTANOL CURRENT AND FUTURE TYPE ANALYSIS, 2025–2034, (USD MILLION)
FIGURE 79 CHINA 1-OCTANOL CURRENT AND FUTURE END USER ANALYSIS, 2025–2034, (USD MILLION)
FIGURE 80 JAPAN 1-OCTANOL CURRENT AND FUTURE TYPE ANALYSIS, 2025–2034, (USD MILLION)
FIGURE 81 JAPAN 1-OCTANOL CURRENT AND FUTURE END USER ANALYSIS, 2025–2034, (USD MILLION)
FIGURE 82 AUSTRALIA 1-OCTANOL CURRENT AND FUTURE TYPE ANALYSIS, 2025–2034, (USD MILLION)
FIGURE 83 AUSTRALIA 1-OCTANOL CURRENT AND FUTURE END USER ANALYSIS, 2025–2034, (USD MILLION)
FIGURE 84 CAMBODIA 1-OCTANOL CURRENT AND FUTURE TYPE ANALYSIS, 2025–2034, (USD MILLION)
FIGURE 85 CAMBODIA 1-OCTANOL CURRENT AND FUTURE END USER ANALYSIS, 2025–2034, (USD MILLION)
FIGURE 86 FIJI 1-OCTANOL CURRENT AND FUTURE TYPE ANALYSIS, 2025–2034, (USD MILLION)
FIGURE 87 FIJI 1-OCTANOL CURRENT AND FUTURE END USER ANALYSIS, 2025–2034, (USD MILLION)
FIGURE 88 INDONESIA 1-OCTANOL CURRENT AND FUTURE TYPE ANALYSIS, 2025–2034, (USD MILLION)
FIGURE 89 INDONESIA 1-OCTANOL CURRENT AND FUTURE END USER ANALYSIS, 2025–2034, (USD MILLION)
FIGURE 90 SOUTH KOREA 1-OCTANOL CURRENT AND FUTURE TYPE ANALYSIS, 2025–2034, (USD MILLION)
FIGURE 91 SOUTH KOREA 1-OCTANOL CURRENT AND FUTURE END USER ANALYSIS, 2025–2034, (USD MILLION)
FIGURE 92 REST OF EAST ASIA AND PACIFIC 1-OCTANOL CURRENT AND FUTURE TYPE ANALYSIS, 2025–2034, (USD MILLION)
FIGURE 93 REST OF EAST ASIA AND PACIFIC 1-OCTANOL CURRENT AND FUTURE END USER ANALYSIS, 2025–2034, (USD MILLION)
FIGURE 94 SEA AND SOUTH ASIA 1-OCTANOL CURRENT AND FUTURE MARKET VOLUME SHARE REGIONAL ANALYSIS, 2025–2034, (USD MILLION)
FIGURE 95 BANGLADESH 1-OCTANOL CURRENT AND FUTURE TYPE ANALYSIS, 2025–2034, (USD MILLION)
FIGURE 96 BANGLADESH 1-OCTANOL CURRENT AND FUTURE END USER ANALYSIS, 2025–2034, (USD MILLION)
FIGURE 97 NEW ZEALAND 1-OCTANOL CURRENT AND FUTURE TYPE ANALYSIS, 2025–2034, (USD MILLION)
FIGURE 98 NEW ZEALAND 1-OCTANOL CURRENT AND FUTURE END USER ANALYSIS, 2025–2034, (USD MILLION)
FIGURE 99 INDIA 1-OCTANOL CURRENT AND FUTURE TYPE ANALYSIS, 2025–2034, (USD MILLION)
FIGURE 100 INDIA 1-OCTANOL CURRENT AND FUTURE END USER ANALYSIS, 2025–2034, (USD MILLION)
FIGURE 101 SINGAPORE 1-OCTANOL CURRENT AND FUTURE TYPE ANALYSIS, 2025–2034, (USD MILLION)
FIGURE 102 SINGAPORE 1-OCTANOL CURRENT AND FUTURE END USER ANALYSIS, 2025–2034, (USD MILLION)
FIGURE 103 THAILAND 1-OCTANOL CURRENT AND FUTURE TYPE ANALYSIS, 2025–2034, (USD MILLION)
FIGURE 104 THAILAND 1-OCTANOL CURRENT AND FUTURE END USER ANALYSIS, 2025–2034, (USD MILLION)
FIGURE 105 TAIWAN 1-OCTANOL CURRENT AND FUTURE TYPE ANALYSIS, 2025–2034, (USD MILLION)
FIGURE 106 TAIWAN 1-OCTANOL CURRENT AND FUTURE END USER ANALYSIS, 2025–2034, (USD MILLION)
FIGURE 107 MALAYSIA 1-OCTANOL CURRENT AND FUTURE TYPE ANALYSIS, 2025–2034, (USD MILLION)
FIGURE 108 MALAYSIA 1-OCTANOL CURRENT AND FUTURE END USER ANALYSIS, 2025–2034, (USD MILLION)
FIGURE 109 REST OF SEA AND SOUTH ASIA 1-OCTANOL CURRENT AND FUTURE TYPE ANALYSIS, 2025–2034, (USD MILLION)
FIGURE 110 REST OF SEA AND SOUTH ASIA 1-OCTANOL CURRENT AND FUTURE END USER ANALYSIS, 2025–2034, (USD MILLION)
FIGURE 111 MIDDLE EAST AND AFRICA 1-OCTANOL CURRENT AND FUTURE MARKET VOLUME SHARE REGIONAL ANALYSIS, 2025–2034, (USD MILLION)
FIGURE 112 GCC COUNTRIES 1-OCTANOL CURRENT AND FUTURE TYPE ANALYSIS, 2025–2034, (USD MILLION)
FIGURE 113 GCC COUNTRIES 1-OCTANOL CURRENT AND FUTURE END USER ANALYSIS, 2025–2034, (USD MILLION)
FIGURE 114 SAUDI ARABIA 1-OCTANOL CURRENT AND FUTURE TYPE ANALYSIS, 2025–2034, (USD MILLION)
FIGURE 115 SAUDI ARABIA 1-OCTANOL CURRENT AND FUTURE END USER ANALYSIS, 2025–2034, (USD MILLION)
FIGURE 116 UAE 1-OCTANOL CURRENT AND FUTURE TYPE ANALYSIS, 2025–2034, (USD MILLION)
FIGURE 117 UAE 1-OCTANOL CURRENT AND FUTURE END USER ANALYSIS, 2025–2034, (USD MILLION)
FIGURE 118 BAHRAIN 1-OCTANOL CURRENT AND FUTURE TYPE ANALYSIS, 2025–2034, (USD MILLION)
FIGURE 119 BAHRAIN 1-OCTANOL CURRENT AND FUTURE END USER ANALYSIS, 2025–2034, (USD MILLION)
FIGURE 120 KUWAIT 1-OCTANOL CURRENT AND FUTURE TYPE ANALYSIS, 2025–2034, (USD MILLION)
FIGURE 121 KUWAIT 1-OCTANOL CURRENT AND FUTURE END USER ANALYSIS, 2025–2034, (USD MILLION)
FIGURE 122 OMAN 1-OCTANOL CURRENT AND FUTURE TYPE ANALYSIS, 2025–2034, (USD MILLION)
FIGURE 123 OMAN 1-OCTANOL CURRENT AND FUTURE END USER ANALYSIS, 2025–2034, (USD MILLION)
FIGURE 124 QATAR 1-OCTANOL CURRENT AND FUTURE TYPE ANALYSIS, 2025–2034, (USD MILLION)
FIGURE 125 QATAR 1-OCTANOL CURRENT AND FUTURE END USER ANALYSIS, 2025–2034, (USD MILLION)
FIGURE 126 EGYPT 1-OCTANOL CURRENT AND FUTURE TYPE ANALYSIS, 2025–2034, (USD MILLION)
FIGURE 127 EGYPT 1-OCTANOL CURRENT AND FUTURE END USER ANALYSIS, 2025–2034, (USD MILLION)
FIGURE 128 NIGERIA 1-OCTANOL CURRENT AND FUTURE TYPE ANALYSIS, 2025–2034, (USD MILLION)
FIGURE 129 NIGERIA 1-OCTANOL CURRENT AND FUTURE END USER ANALYSIS, 2025–2034, (USD MILLION)
FIGURE 130 SOUTH AFRICA 1-OCTANOL CURRENT AND FUTURE TYPE ANALYSIS, 2025–2034, (USD MILLION)
FIGURE 131 SOUTH AFRICA 1-OCTANOL CURRENT AND FUTURE END USER ANALYSIS, 2025–2034, (USD MILLION)
FIGURE 132 ISRAEL 1-OCTANOL CURRENT AND FUTURE TYPE ANALYSIS, 2025–2034, (USD MILLION)
FIGURE 133 ISRAEL 1-OCTANOL CURRENT AND FUTURE END USER ANALYSIS, 2025–2034, (USD MILLION)
FIGURE 134 REST OF MEA 1-OCTANOL CURRENT AND FUTURE TYPE ANALYSIS, 2025–2034, (USD MILLION)
FIGURE 135 REST OF MEA 1-OCTANOL CURRENT AND FUTURE END USER ANALYSIS, 2025–2034, (USD MILLION)
FIGURE 136 U. S. MARKET SHARE ANALYSIS BY TYPE (2024)
FIGURE 137 U. S. MARKET SHARE ANALYSIS BY END USER (2024)
FIGURE 138 CANADA MARKET SHARE ANALYSIS BY TYPE (2024)
FIGURE 139 CANADA MARKET SHARE ANALYSIS BY END USER (2024)
FIGURE 140 MEXICO MARKET SHARE ANALYSIS BY TYPE (2024)
FIGURE 141 MEXICO MARKET SHARE ANALYSIS BY END USER (2024)
FIGURE 142 CHINA MARKET SHARE ANALYSIS BY TYPE (2024)
FIGURE 143 CHINA MARKET SHARE ANALYSIS BY END USER (2024)
FIGURE 144 JAPAN MARKET SHARE ANALYSIS BY TYPE (2024)
FIGURE 145 JAPAN MARKET SHARE ANALYSIS BY END USER (2024)
FIGURE 146 INDIA MARKET SHARE ANALYSIS BY TYPE (2024)
FIGURE 147 INDIA MARKET SHARE ANALYSIS BY END USER (2024)
FIGURE 148 SOUTH KOREA MARKET SHARE ANALYSIS BY TYPE (2024)
FIGURE 149 SOUTH KOREA MARKET SHARE ANALYSIS BY END USER (2024)
FIGURE 150 SAUDI ARABIA MARKET SHARE ANALYSIS BY TYPE (2024)
FIGURE 151 SAUDI ARABIA MARKET SHARE ANALYSIS BY END USER (2024)
FIGURE 152 UAE MARKET SHARE ANALYSIS BY TYPE (2024)
FIGURE 153 UAE MARKET SHARE ANALYSIS BY END USER (2024)
FIGURE 154 EGYPT MARKET SHARE ANALYSIS BY TYPE (2024)
FIGURE 155 EGYPT MARKET SHARE ANALYSIS BY END USER (2024)
FIGURE 156 NIGERIA MARKET SHARE ANALYSIS BY TYPE (2024)
FIGURE 157 NIGERIA MARKET SHARE ANALYSIS BY END USER (2024)
FIGURE 158 SOUTH AFRICA MARKET SHARE ANALYSIS BY TYPE (2024)
FIGURE 159 SOUTH AFRICA MARKET SHARE ANALYSIS BY END USER (2024)
FIGURE 160 GERMANY MARKET SHARE ANALYSIS BY TYPE (2024)
FIGURE 161 GERMANY MARKET SHARE ANALYSIS BY END USER (2024)
FIGURE 162 FRANCE MARKET SHARE ANALYSIS BY TYPE (2024)
FIGURE 163 FRANCE MARKET SHARE ANALYSIS BY END USER (2024)
FIGURE 164 UK MARKET SHARE ANALYSIS BY TYPE (2024)
FIGURE 165 UK MARKET SHARE ANALYSIS BY END USER (2024)
FIGURE 166 SPAIN MARKET SHARE ANALYSIS BY TYPE (2024)
FIGURE 167 SPAIN MARKET SHARE ANALYSIS BY END USER (2024)
FIGURE 168 ITALY MARKET SHARE ANALYSIS BY TYPE (2024)
FIGURE 169 ITALY MARKET SHARE ANALYSIS BY END USER (2024)
FIGURE 170 BRAZIL MARKET SHARE ANALYSIS BY TYPE (2024)
FIGURE 171 BRAZIL MARKET SHARE ANALYSIS BY END USER (2024)
FIGURE 172 ARGENTINA MARKET SHARE ANALYSIS BY TYPE (2024)
FIGURE 173 ARGENTINA MARKET SHARE ANALYSIS BY END USER (2024)
FIGURE 174 COLUMBIA MARKET SHARE ANALYSIS BY TYPE (2024)
FIGURE 175 COLUMBIA MARKET SHARE ANALYSIS BY END USER (2024)
FIGURE 176 GLOBAL 1-OCTANOL CURRENT AND FUTURE MARKET KEY COUNTRY LEVEL ANALYSIS, 2024–2034, (USD MILLION)
FIGURE 177 FINANCIAL OVERVIEW:
Key Player Analysis
Sasol Limited:Positioning: leader/innovator. Sasol is a reference producer of linear primary alcohols via the Ziegler route, marketing 1-octanol under the ALFOL® brand for high-purity applications in fragrances, personal care, and specialty intermediates. Its Lake Charles platform and global logistics underpin reliability and tight cut control across C6–C22 ranges, with published technical data confirming dedicated 1-octanol grades. Strategically, Sasol is leaning into premium cuts, process intensification, and digital uptime programs (APC/predictive maintenance) to lift on-spec yields and reduce energy per ton—an increasingly valuable differentiator as buyers favor >98% purity and traceable supply. Sustainability claims are reinforced by targeted portfolios for agricultural and biobased systems, supporting downstream low-VOC and bio-aligned formulations.
BASF SE:Positioning: leader/innovator. BASF combines scale in oxo/value-chain alcohols and monomers with a visible sustainability roadmap, commercializing bio-based C8 derivatives such as 2-octyl acrylate made from castor-oil-based 2-octanol—an indicator of capability to qualify, certify, and supply low-carbon C8 chemistries at scale. In the 2025 outlook, BASF’s edge is the integration from feedstocks to downstream adhesives/coatings systems, enabling pull-through for octanol-derived esters and tailored co-monomers. Strategic moves emphasize portfolio decarbonization, customer co-development, and digitalization of supply planning; these support pricing power in high-purity and bio-content specifications as consumer and industrial customers tighten Scope 3 requirements.
SABC:Positioning: challenger (interpreted as SABIC – Saudi Basic Industries Corporation). SABIC is expanding influence in adjacent oxo-alcohol chains and feedstocks through its Chemicals and “Oxo Alcohols & Performance Monomers” portfolios, complemented by joint ventures such as the Saudi Butanol Company (SABUCO) that secure butanol supplies—critical upstreams for plasticizers and solvents. With world-scale assets across the Middle East and global marketing reach, SABIC’s differentiators are advantaged feedstock access, integration with olefins/oxygenates, and capital discipline that lowers unit costs and reduces emissions intensity versus fragmented producers. In 2025, SABIC’s strategy centers on capacity optimization, customer qualification for higher-spec grades, and selective debottlenecking aligned to growth in flexible PVC and coatings, positioning it to capture share as regional demand in Asia and MEA accelerates.
Bharat Petroleum Corporation Limited:Positioning: regional challenger. BPCL has built a C8 oxo-alcohol franchise anchored by 2-ethylhexanol (2-EH) from its Kochi refinery PDPP complex, addressing plasticizers, coatings, and industrial solvent demand in India. While 1-octanol is a distinct isomer, BPCL’s capability in C8 alcohols, domestic distribution, and dynamic price management gives it adjacency to octyl value chains and optionality to qualify grades for downstream esters and specialty formulations as India’s chemicals demand outpaces GDP. Strategic levers for 2025 include expanding customer technical service, exploring higher-purity cuts, and leveraging procurement/logistics advantages to reduce import dependency—moves that could shift BPCL from price-taker to solution partner in South Asia’s fast-formalizing specialty and consumer markets.
Market Key Players
Axxence Aromatic GmbH
Hebei Guanlang Biotechnology Co., Ltd.
BASF SE
Kao Chemical Corporation
Sasol Limited
Liaoning Huaxing Group Chemical
Bharat Petroleum Corporation Limited
Shandong Zhishang Chemical Co., Ltd.
Sisco Research Laboratories Pvt. Ltd.
SABC
Others
Driver:
High-Purity Demand in Fragrances Strengthening Octanol Market Mix
As of 2025, the 1-Octanol market is tracking an estimated value of ~USD 6.5 billion, with a steady 2025–2033 CAGR near 2.5%. Growth is anchored by premiumization in flavors and fragrances, where octyl esters and high-purity (>98%) cuts enable cleaner scent profiles and tighter batch-to-batch consistency. This channel accounts for roughly 36–37% of demand in 2025, supported by resilient spend on prestige beauty and fine fragrance and by the scaling of formulation work in Asia. Strategic impact: suppliers that prioritize high-purity capacity, validated sensory performance, and reliable supply to global fragrance houses can defend pricing and capture mix—often realizing mid-to-high single-digit premiums over standard grades.
Restraint:
Regulatory Pressures Increasing Compliance Costs and Substitution Risk
Tightening environmental and product-safety regimes—spanning VOC limits, REACH/CLP obligations, and restrictions on certain phthalate plasticizers—are raising compliance costs and nudging downstream reformulations. For octanol-linked plasticizer value chains, this translates into a 2–4% demand headwind in the most regulated markets and 50–150 bps margin pressure from emissions controls, monitoring, and product stewardship. Strategic impact: producers reliant on commodity, solvent-heavy outlets face substitution risk from lower-VOC or bio-based alternatives; without portfolio shift toward high-purity, food-/pharma-grade, or low-carbon offerings, price realization and asset utilization could lag the market.
High-purity and food/pharma-grade pathways, along with bio-based 1-octanol, offer outsize growth versus the headline CAGR. >98% purity already commands ~62–63% share in 2025 and is gaining 30–50 bps of mix annually as quality standards tighten; each 1-pp mix shift toward high-purity can lift segment revenue by ~USD 60–70 million on the current base. Bio-based routes—targeting plasticizers, surfactants, and clean-label flavors—are expanding from a low single-digit share and could grow at 8–12% CAGR through 2030, unlocking USD 0.4–0.7 billion in incremental opportunity and supporting double-digit price premiums where verified low-carbon intensity is documented. Strategic impact: investments in feedstock flexibility, certification (e.g., ISO, GMP, food-grade), and offtake agreements with flavor/fragrance and pharma accounts can secure durable margins and reduce policy risk.
Decarbonization and precision manufacturing are reshaping competitive advantage. Producers are piloting fermentation- and catalytic-upgrading routes for bio-octanol while deploying advanced process control, digital twins, and predictive maintenance across oxo/Ziegler assets—typically improving on-spec yields and energy intensity by low single digits and shortening campaign changeovers. Concurrently, downstream formulators are tightening specs for octyl esters in fine fragrance, skincare, and water-borne coatings, accelerating adoption of higher-purity and traceable lots. Strategic impact: assets that combine verifiable Scope 1/2 reductions with specification leadership and supply reliability (e.g., integrated APAC hubs and EU specialty sites) are best positioned to win share, lock in multi-year contracts, and command premium pricing despite a moderate overall market CAGR.
Recent Developments
Dec 2024 – OQ Chemicals / Perstorp: Perstorp acquired OQ Chemicals Nederland B.V., including the Amsterdam esters plant, for an undisclosed sum, gaining full control of assets, technology, and staff to accelerate specialty esters growth starting early 2025. Strategic impact: strengthens Perstorp’s European footprint and secures upstream capabilities for high-spec esters used in fragrances, lubricants, and plasticizers.
Dec 2024 – BASF SE: BASF signed a binding agreement to divest its Food & Health Performance Ingredients business (Illertissen, Germany site and related labs) to Louis Dreyfus Company; financial terms were not disclosed. Strategic impact: portfolio realignment allows BASF to focus capital on core monomers and oxo-related chemistries while LDC scales in specialty ingredients adjacencies.
Feb 2025 – Sasol Limited: Sasol reported half-year (H1 FY25) results showing a ~31% decline in profit on weaker energy/chemicals pricing, while progressing operational fixes; prior actions included a Dec-2024 FID on a coal destoning solution to improve feed quality at Secunda, with benefits expected by H1 FY26. Strategic impact: near-term margin pressure accelerates the “International Chemicals Reset,” prioritizing reliability and cash discipline across alcohols and intermediates chains.
Mar 2025 – OQ Chemicals: Announced start-up of dedicated heptanoic acid production in Oberhausen by June 2025 to expand its carboxylic acid slate and improve European supply security. Strategic impact: deepens the firm’s oxo-derivatives portfolio and offers cross-selling synergies to esters and specialty fluids customers tied to C7–C9 chains.
Jul 2025 – Perstorp: Shipped the first on-spec specialty esters from the new Amsterdam site (28 tonnes in the inaugural truckload), marking a rapid post-acquisition ramp. Strategic impact: validates integration speed and adds near-term capacity for premium ester demand in coatings, lubricants, and F&F applications.
Sep 2025 – OQ Chemicals (formerly Oxea): Implemented a global price adjustment for select carboxylic acids effective Oct 1, 2025 (e.g., +USD 100/mt for valeric acid; +USD 95/mt for pelargonic and heptanoic acids), citing market conditions and input costs. Strategic impact: supports margin recovery across oxo portfolios and may reset contract pricing for downstream esters in Q4 2025.