Global 3D Audio Market Size & Forecast 2025–2034 | 11.5% CAGR
Global 3D Audio Market Size, Share & Analysis – By Component (Hardware, Software, Services), By Technology (Binaural Audio, Object-Based Audio, Wave Field Synthesis), By Application (Gaming, AR/VR, Cinematic Production, Music Streaming, Live Events), By End-Use (Residential, Commercial), By Region, Industry Trends, Competitive Landscape, Innovation Strategies, Long-Term Revenue Outlook & Forecast 2025–2034
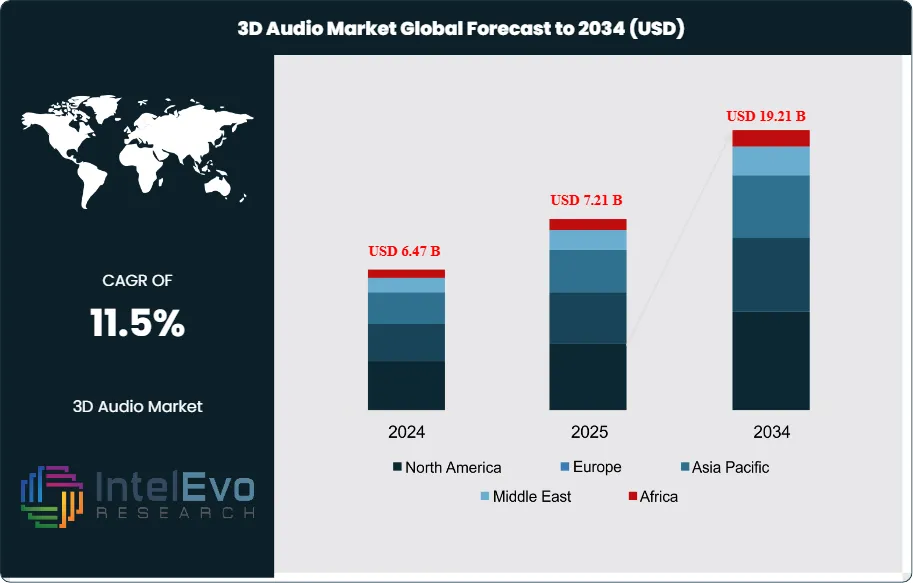
The Global 3D Audio Market was valued at approximately USD 6.47 billion in 2024 and is projected to reach nearly USD 19.21 billion by 2034, driven by growing adoption across gaming, AR/VR, cinematic production, and immersive media applications. Based on the established growth trajectory, the market size for 2025 is estimated at approximately USD 7.21 billion. From 2026 onward, the market is expected to expand at a compound annual growth rate (CAGR) of approximately 11.5% during 2026–2034, ultimately reaching around USD 19.21 billion by 2034.
3D audio, also called spatial audio, recreates how people perceive sound in space by simulating depth, distance, and direction. Vendors apply advanced signal processing, psychoacoustic models, and AI-based personalization to deliver immersive sound across consumer and professional environments.
Demand expansion in entertainment is the primary growth engine. Streaming video, gaming, and music services together account for over 45% of global 3D audio revenues in 2024, as platforms compete on immersion and content differentiation. Rapid adoption of AR and VR headsets, growing at more than 15% annually, accelerates use of 3D audio in interactive games, virtual events, and cinematic experiences. On the supply side, semiconductor advances, dedicated spatial audio chips, and automated mixing tools lower production costs and enable broader device integration.
Automotive, home, and workplace applications add new growth layers. In-car spatial audio supports both premium entertainment and driver-assistance cues, with automotive expected to approach 12–15% of market revenues by 2034. Smart speakers, TVs, soundbars, and wearables embed 3D audio capabilities as standard features, supported by edge AI that adapts sound fields to room acoustics and listener profiles. Enterprises deploy 3D audio in collaboration, training, and simulation, improving speech clarity and situational awareness in hybrid work settings.
Technology standardization is emerging as a strategic battleground. The joint Samsung–Google Immersive Audio Model and Formats (IAMF) initiative, launched in 2023, seeks to provide an open 3D audio framework that supports vertical sound placement and AI-driven scene analysis as an alternative to incumbent formats. Competing ecosystems increase short-term fragmentation risk but also stimulate innovation in codecs, authoring tools, and cloud-based rendering platforms.
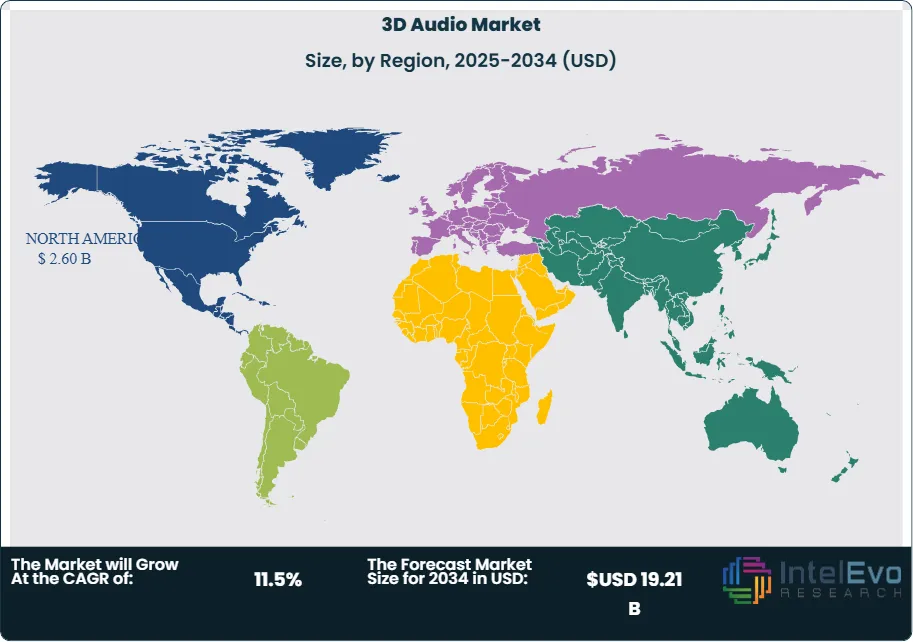
Regulatory and risk considerations gain weight as adoption scales. Content and broadcasting authorities influence codec choices, loudness norms, and accessibility features such as dialogue enhancement. Data protection rules shape AI training on listener behavior. High implementation costs, skills gaps in immersive audio production, and uneven content availability remain key restraints. Regionally, North America holds about 35% of 2024 revenues, followed by Europe at 28%, while Asia Pacific, with the fastest projected CAGR above 13%, stands out as the leading emerging investment hotspot.
Key Takeaways
Market Growth: The global 3D audio market stands at USD 6.47 billion in 2024 and is on a path toward USD 19.21 billion by 2034, reflecting a CAGR of 11.5%, 2026-2034.
Segment Dominance: The hardware segment leads the competitive landscape with a 46.8%, 2023 revenue share, signaling strong demand for devices that enable immersive listening. This dominance anchors an estimated: 3.0 billion USD, 2023 in hardware-driven 3D audio sales.
Segment Dominance: The residential segment holds a 72.5%, 2023 share of total 3D audio revenues, reflecting its role as the core adoption arena. This segment likely generates estimated: 4.2 billion USD, 2023 as consumers upgrade home entertainment setups.
Driver: Growing investment in home entertainment, supported by a 72.5%, 2023 residential share, drives sustained replacement and upgrade cycles. The 11.5%, 2024-2034 CAGR aligns with rising adoption of 3D-enabled devices and content services.
Restraint: High upfront device costs and limited native 3D content constrain penetration beyond premium users, particularly in price-sensitive segments. These barriers could cap near-term adoption at an estimated: 60.0% of addressable households, 2024.
Opportunity: Expansion into non-residential venues such as automotive, cinemas, and public spaces offers upside beyond the 72.5%, 2023 residential base. Emerging applications could unlock estimated: 1.5 billion USD, 2024 in incremental revenues, with outsized gains in developing economies.
Trend: Vendors increasingly shift from pure hardware to integrated software and AI-driven spatial processing, raising the software and services contribution from an estimated: 25.0% of revenues, 2024 to higher levels over 2024-2034. This shift supports recurring revenue models and accelerates feature innovation.
Regional Analysis: North America leads with a 36.4%, 2023 share and 2.1 billion USD, 2023 in revenues, underpinned by high spending and strong vendor presence. Asia Pacific, while smaller today at an estimated: 25.0% share, 2024, likely delivers faster growth as device affordability and content availability improve.
By Component
The hardware segment continues to hold a central position in the 3D audio landscape in 2025. It accounts for more than 46 percent of global revenue and remains the primary channel through which you experience spatial sound. Headphones, soundbars, in-ear devices, and multi-speaker systems form the core of this category. Growth reflects steady improvements in acoustic engineering, stronger output efficiency in compact devices, and rising demand for spatial sound across entertainment, gaming, and personal audio ecosystems.
Manufacturers expand hardware portfolios as 3D audio adoption increases in home theater systems, VR and AR headsets, and gaming accessories. Consumers expect consistent sound positioning and room-adaptive playback, which drives upgrades to higher precision drivers and DSP-enabled hardware. AI-supported tuning features now appear in mid-range products, and this shift supports faster replacement cycles. As smart homes expand, you see more households adopting multi-room speakers with embedded spatial audio features.
Software and services also expand their roles. Software platforms that render spatial audio in real time support higher device compatibility. Services such as spatial audio mixing, content authoring, and cloud-based tuning tools grow as content creators adopt advanced sound formats. These segments grow faster than hardware from 2025 onward, although hardware remains the revenue anchor.
By End-Use
Residential use accounts for the largest share of 3D audio deployments, reaching more than 70 percent in 2025. Households continue to upgrade entertainment systems as streaming platforms expand libraries encoded with spatial sound. You see higher adoption of 3D-enabled smart speakers, TVs, and soundbars as consumers seek more realistic sound reproduction for movies, games, and music. The expansion of VR-based entertainment also strengthens residential demand.
Commercial buyers follow a different trajectory. Cinemas, retail venues, automotive OEMs, and simulation centers integrate spatial audio to improve audience engagement and operational training. Commercial adoption grows at a steady pace as companies invest in sound systems that support immersive media, virtual collaboration, and passenger-experience upgrades. Industrial sites adopt spatial audio selectively for alert systems and situational awareness.
By Region
North America maintains the largest regional share at more than 36 percent of global revenue in 2025. Strong device penetration, high spending on entertainment, and the presence of leading technology companies support this lead. Firms such as Dolby and DTS continue to expand spatial audio standards across consumer electronics and streaming ecosystems. The region also benefits from rapid uptake of AR and VR systems in gaming and enterprise applications.
Europe holds a stable share driven by cinema modernization, automotive production, and strong demand for premium audio products. Asia Pacific records the fastest growth rate due to rising consumer spending in China, South Korea, and India. You see rapid increases in gaming adoption, smartphone upgrades, and smart home expansion. Latin America and the Middle East and Africa advance from a smaller base but show improving demand as broadband connectivity and streaming services scale across these regions.
Customization for segments, region/country-level will be provided. Moreover, additional customization can be done based on the requirements.
Pricing and Purchase Options
Avail customized purchase options to meet your exact research needs. We have three licenses to opt for: Single User License, Multi-User License (Up to 5 Users), Corporate Use License (Unlimited User and Printable PDF).
TABLE OF CONTENTS
1. EXECUTIVE SUMMARY
1.1. MARKET SNAPSHOT
1.2. KEY FINDINGS & INSIGHTS
1.3. ANALYST RECOMMENDATIONS
1.4. FUTURE OUTLOOK
2. RESEARCH METHODOLOGY
2.1. MARKET DEFINITION & SCOPE
2.2. RESEARCH OBJECTIVES: PRIMARY & SECONDARY DATA SOURCES
2.3. DATA COLLECTION SOURCES
2.3.1. COVERAGE OF 100+ PRIMARY RESEARCH/CONSULTATION CALLS WITH INDUSTRY STAKEHOLDERS
FIGURE 17 NORTH AMERICA 3D AUDIOCURRENT AND FUTURE TYPE ANALYSIS, 2025–2034, (USD MILLION)
FIGURE 18 NORTH AMERICA 3D AUDIOCURRENT AND FUTURE END USER ANALYSIS, 2025–2034, (USD MILLION)
FIGURE 19 MARKET SHARE BY COUNTRY
FIGURE 20 LATIN AMERICA 3D AUDIOCURRENT AND FUTURE TYPE ANALYSIS, 2025–2034, (USD MILLION)
FIGURE 21 LATIN AMERICA 3D AUDIOCURRENT AND FUTURE END USER ANALYSIS, 2025–2034, (USD MILLION)
FIGURE 22 MARKET SHARE BY COUNTRY
FIGURE 23 EASTERN EUROPE 3D AUDIOCURRENT AND FUTURE TYPE ANALYSIS, 2025–2034, (USD MILLION)
FIGURE 24 EASTERN EUROPE 3D AUDIOCURRENT AND FUTURE END USER ANALYSIS, 2025–2034, (USD MILLION)
FIGURE 25 MARKET SHARE BY COUNTRY
FIGURE 26 WESTERN EUROPE 3D AUDIOCURRENT AND FUTURE TYPE ANALYSIS, 2025–2034, (USD MILLION)
FIGURE 27 WESTERN EUROPE 3D AUDIOCURRENT AND FUTURE END USER ANALYSIS, 2025–2034, (USD MILLION)
FIGURE 28 MARKET SHARE BY COUNTRY
FIGURE 29 EAST ASIA AND PACIFIC 3D AUDIOCURRENT AND FUTURE TYPE ANALYSIS, 2025–2034, (USD MILLION)
FIGURE 30 EAST ASIA AND PACIFIC 3D AUDIOCURRENT AND FUTURE END USER ANALYSIS, 2025–2034, (USD MILLION)
FIGURE 31 MARKET SHARE BY COUNTRY
FIGURE 32 SEA AND SOUTH ASIA 3D AUDIOCURRENT AND FUTURE TYPE ANALYSIS, 2025–2034, (USD MILLION)
FIGURE 33 SEA AND SOUTH ASIA 3D AUDIOCURRENT AND FUTURE END USER ANALYSIS, 2025–2034, (USD MILLION)
FIGURE 34 MARKET SHARE BY COUNTRY
FIGURE 35 MIDDLE EAST AND AFRICA 3D AUDIOCURRENT AND FUTURE TYPE ANALYSIS, 2025–2034, (USD MILLION)
FIGURE 36 MIDDLE EAST AND AFRICA 3D AUDIOCURRENT AND FUTURE END USER ANALYSIS, 2025–2034, (USD MILLION)
FIGURE 37 NORTH AMERICA 3D AUDIOCURRENT AND FUTURE MARKET VOLUME SHARE REGIONAL ANALYSIS, 2025–2034, (USD MILLION)
FIGURE 38 U.S. 3D AUDIOCURRENT AND FUTURE TYPE ANALYSIS, 2025–2034, (USD MILLION)
FIGURE 39 U.S. 3D AUDIOCURRENT AND FUTURE END USER ANALYSIS, 2025–2034, (USD MILLION)
FIGURE 40 CANADA 3D AUDIOCURRENT AND FUTURE TYPE ANALYSIS, 2025–2034, (USD MILLION)
FIGURE 41 CANADA 3D AUDIOCURRENT AND FUTURE END USER ANALYSIS, 2025–2034, (USD MILLION)
FIGURE 42 LATIN AMERICA 3D AUDIOCURRENT AND FUTURE MARKET VOLUME SHARE REGIONAL ANALYSIS, 2025–2034, (USD MILLION)
FIGURE 43 MEXICO 3D AUDIOCURRENT AND FUTURE TYPE ANALYSIS, 2025–2034, (USD MILLION)
FIGURE 44 MEXICO 3D AUDIOCURRENT AND FUTURE END USER ANALYSIS, 2025–2034, (USD MILLION)
FIGURE 45 BRAZIL 3D AUDIOCURRENT AND FUTURE TYPE ANALYSIS, 2025–2034, (USD MILLION)
FIGURE 46 BRAZIL 3D AUDIOCURRENT AND FUTURE END USER ANALYSIS, 2025–2034, (USD MILLION)
FIGURE 47 ARGENTINA 3D AUDIOCURRENT AND FUTURE TYPE ANALYSIS, 2025–2034, (USD MILLION)
FIGURE 48 ARGENTINA 3D AUDIOCURRENT AND FUTURE END USER ANALYSIS, 2025–2034, (USD MILLION)
FIGURE 49 COLUMBIA 3D AUDIOCURRENT AND FUTURE TYPE ANALYSIS, 2025–2034, (USD MILLION)
FIGURE 50 COLUMBIA 3D AUDIOCURRENT AND FUTURE END USER ANALYSIS, 2025–2034, (USD MILLION)
FIGURE 51 REST OF LATIN AMERICA 3D AUDIOCURRENT AND FUTURE TYPE ANALYSIS, 2025–2034, (USD MILLION)
FIGURE 52 REST OF LATIN AMERICA 3D AUDIOCURRENT AND FUTURE END USER ANALYSIS, 2025–2034, (USD MILLION)
FIGURE 53 EASTERN EUROPE 3D AUDIOCURRENT AND FUTURE MARKET VOLUME SHARE REGIONAL ANALYSIS, 2025–2034, (USD MILLION)
FIGURE 54 POLAND 3D AUDIOCURRENT AND FUTURE TYPE ANALYSIS, 2025–2034, (USD MILLION)
FIGURE 55 POLAND 3D AUDIOCURRENT AND FUTURE END USER ANALYSIS, 2025–2034, (USD MILLION)
FIGURE 56 RUSSIA 3D AUDIOCURRENT AND FUTURE TYPE ANALYSIS, 2025–2034, (USD MILLION)
FIGURE 57 RUSSIA 3D AUDIOCURRENT AND FUTURE END USER ANALYSIS, 2025–2034, (USD MILLION)
FIGURE 58 CZECH REPUBLIC 3D AUDIOCURRENT AND FUTURE TYPE ANALYSIS, 2025–2034, (USD MILLION)
FIGURE 59 CZECH REPUBLIC 3D AUDIOCURRENT AND FUTURE END USER ANALYSIS, 2025–2034, (USD MILLION)
FIGURE 60 ROMANIA 3D AUDIOCURRENT AND FUTURE TYPE ANALYSIS, 2025–2034, (USD MILLION)
FIGURE 61 ROMANIA 3D AUDIOCURRENT AND FUTURE END USER ANALYSIS, 2025–2034, (USD MILLION)
FIGURE 62 REST OF EASTERN EUROPE 3D AUDIOCURRENT AND FUTURE TYPE ANALYSIS, 2025–2034, (USD MILLION)
FIGURE 63 REST OF EASTERN EUROPE 3D AUDIOCURRENT AND FUTURE END USER ANALYSIS, 2025–2034, (USD MILLION)
FIGURE 64 WESTERN EUROPE 3D AUDIOCURRENT AND FUTURE MARKET VOLUME SHARE REGIONAL ANALYSIS, 2025–2034, (USD MILLION)
FIGURE 65 GERMANY 3D AUDIOCURRENT AND FUTURE TYPE ANALYSIS, 2025–2034, (USD MILLION)
FIGURE 66 GERMANY 3D AUDIOCURRENT AND FUTURE END USER ANALYSIS, 2025–2034, (USD MILLION)
FIGURE 67 FRANCE 3D AUDIOCURRENT AND FUTURE TYPE ANALYSIS, 2025–2034, (USD MILLION)
FIGURE 68 FRANCE 3D AUDIOCURRENT AND FUTURE END USER ANALYSIS, 2025–2034, (USD MILLION)
FIGURE 69 UK 3D AUDIOCURRENT AND FUTURE TYPE ANALYSIS, 2025–2034, (USD MILLION)
FIGURE 70 UK 3D AUDIOCURRENT AND FUTURE END USER ANALYSIS, 2025–2034, (USD MILLION)
FIGURE 71 SPAIN 3D AUDIOCURRENT AND FUTURE TYPE ANALYSIS, 2025–2034, (USD MILLION)
FIGURE 72 SPAIN 3D AUDIOCURRENT AND FUTURE END USER ANALYSIS, 2025–2034, (USD MILLION)
FIGURE 73 ITALY 3D AUDIOCURRENT AND FUTURE TYPE ANALYSIS, 2025–2034, (USD MILLION)
FIGURE 74 ITALY 3D AUDIOCURRENT AND FUTURE END USER ANALYSIS, 2025–2034, (USD MILLION)
FIGURE 75 REST OF WESTERN EUROPE 3D AUDIOCURRENT AND FUTURE TYPE ANALYSIS, 2025–2034, (USD MILLION)
FIGURE 76 REST OF WESTERN EUROPE 3D AUDIOCURRENT AND FUTURE END USER ANALYSIS, 2025–2034, (USD MILLION)
FIGURE 77 EAST ASIA AND PACIFIC 3D AUDIOCURRENT AND FUTURE MARKET VOLUME SHARE REGIONAL ANALYSIS, 2025–2034, (USD MILLION)
FIGURE 78 CHINA 3D AUDIOCURRENT AND FUTURE TYPE ANALYSIS, 2025–2034, (USD MILLION)
FIGURE 79 CHINA 3D AUDIOCURRENT AND FUTURE END USER ANALYSIS, 2025–2034, (USD MILLION)
FIGURE 80 JAPAN 3D AUDIOCURRENT AND FUTURE TYPE ANALYSIS, 2025–2034, (USD MILLION)
FIGURE 81 JAPAN 3D AUDIOCURRENT AND FUTURE END USER ANALYSIS, 2025–2034, (USD MILLION)
FIGURE 82 AUSTRALIA 3D AUDIOCURRENT AND FUTURE TYPE ANALYSIS, 2025–2034, (USD MILLION)
FIGURE 83 AUSTRALIA 3D AUDIOCURRENT AND FUTURE END USER ANALYSIS, 2025–2034, (USD MILLION)
FIGURE 84 CAMBODIA 3D AUDIOCURRENT AND FUTURE TYPE ANALYSIS, 2025–2034, (USD MILLION)
FIGURE 85 CAMBODIA 3D AUDIOCURRENT AND FUTURE END USER ANALYSIS, 2025–2034, (USD MILLION)
FIGURE 86 FIJI 3D AUDIOCURRENT AND FUTURE TYPE ANALYSIS, 2025–2034, (USD MILLION)
FIGURE 87 FIJI 3D AUDIOCURRENT AND FUTURE END USER ANALYSIS, 2025–2034, (USD MILLION)
FIGURE 88 INDONESIA 3D AUDIOCURRENT AND FUTURE TYPE ANALYSIS, 2025–2034, (USD MILLION)
FIGURE 89 INDONESIA 3D AUDIOCURRENT AND FUTURE END USER ANALYSIS, 2025–2034, (USD MILLION)
FIGURE 90 SOUTH KOREA 3D AUDIOCURRENT AND FUTURE TYPE ANALYSIS, 2025–2034, (USD MILLION)
FIGURE 91 SOUTH KOREA 3D AUDIOCURRENT AND FUTURE END USER ANALYSIS, 2025–2034, (USD MILLION)
FIGURE 92 REST OF EAST ASIA AND PACIFIC 3D AUDIOCURRENT AND FUTURE TYPE ANALYSIS, 2025–2034, (USD MILLION)
FIGURE 93 REST OF EAST ASIA AND PACIFIC 3D AUDIOCURRENT AND FUTURE END USER ANALYSIS, 2025–2034, (USD MILLION)
FIGURE 94 SEA AND SOUTH ASIA 3D AUDIOCURRENT AND FUTURE MARKET VOLUME SHARE REGIONAL ANALYSIS, 2025–2034, (USD MILLION)
FIGURE 95 BANGLADESH 3D AUDIOCURRENT AND FUTURE TYPE ANALYSIS, 2025–2034, (USD MILLION)
FIGURE 96 BANGLADESH 3D AUDIOCURRENT AND FUTURE END USER ANALYSIS, 2025–2034, (USD MILLION)
FIGURE 97 NEW ZEALAND 3D AUDIOCURRENT AND FUTURE TYPE ANALYSIS, 2025–2034, (USD MILLION)
FIGURE 98 NEW ZEALAND 3D AUDIOCURRENT AND FUTURE END USER ANALYSIS, 2025–2034, (USD MILLION)
FIGURE 99 INDIA 3D AUDIOCURRENT AND FUTURE TYPE ANALYSIS, 2025–2034, (USD MILLION)
FIGURE 100 INDIA 3D AUDIOCURRENT AND FUTURE END USER ANALYSIS, 2025–2034, (USD MILLION)
FIGURE 101 SINGAPORE 3D AUDIOCURRENT AND FUTURE TYPE ANALYSIS, 2025–2034, (USD MILLION)
FIGURE 102 SINGAPORE 3D AUDIOCURRENT AND FUTURE END USER ANALYSIS, 2025–2034, (USD MILLION)
FIGURE 103 THAILAND 3D AUDIOCURRENT AND FUTURE TYPE ANALYSIS, 2025–2034, (USD MILLION)
FIGURE 104 THAILAND 3D AUDIOCURRENT AND FUTURE END USER ANALYSIS, 2025–2034, (USD MILLION)
FIGURE 105 TAIWAN 3D AUDIOCURRENT AND FUTURE TYPE ANALYSIS, 2025–2034, (USD MILLION)
FIGURE 106 TAIWAN 3D AUDIOCURRENT AND FUTURE END USER ANALYSIS, 2025–2034, (USD MILLION)
FIGURE 107 MALAYSIA 3D AUDIOCURRENT AND FUTURE TYPE ANALYSIS, 2025–2034, (USD MILLION)
FIGURE 108 MALAYSIA 3D AUDIOCURRENT AND FUTURE END USER ANALYSIS, 2025–2034, (USD MILLION)
FIGURE 109 REST OF SEA AND SOUTH ASIA 3D AUDIOCURRENT AND FUTURE TYPE ANALYSIS, 2025–2034, (USD MILLION)
FIGURE 110 REST OF SEA AND SOUTH ASIA 3D AUDIOCURRENT AND FUTURE END USER ANALYSIS, 2025–2034, (USD MILLION)
FIGURE 111 MIDDLE EAST AND AFRICA 3D AUDIOCURRENT AND FUTURE MARKET VOLUME SHARE REGIONAL ANALYSIS, 2025–2034, (USD MILLION)
FIGURE 112 GCC COUNTRIES 3D AUDIOCURRENT AND FUTURE TYPE ANALYSIS, 2025–2034, (USD MILLION)
FIGURE 113 GCC COUNTRIES 3D AUDIOCURRENT AND FUTURE END USER ANALYSIS, 2025–2034, (USD MILLION)
FIGURE 114 SAUDI ARABIA 3D AUDIOCURRENT AND FUTURE TYPE ANALYSIS, 2025–2034, (USD MILLION)
FIGURE 115 SAUDI ARABIA 3D AUDIOCURRENT AND FUTURE END USER ANALYSIS, 2025–2034, (USD MILLION)
FIGURE 116 UAE 3D AUDIOCURRENT AND FUTURE TYPE ANALYSIS, 2025–2034, (USD MILLION)
FIGURE 117 UAE 3D AUDIOCURRENT AND FUTURE END USER ANALYSIS, 2025–2034, (USD MILLION)
FIGURE 118 BAHRAIN 3D AUDIOCURRENT AND FUTURE TYPE ANALYSIS, 2025–2034, (USD MILLION)
FIGURE 119 BAHRAIN 3D AUDIOCURRENT AND FUTURE END USER ANALYSIS, 2025–2034, (USD MILLION)
FIGURE 120 KUWAIT 3D AUDIOCURRENT AND FUTURE TYPE ANALYSIS, 2025–2034, (USD MILLION)
FIGURE 121 KUWAIT 3D AUDIOCURRENT AND FUTURE END USER ANALYSIS, 2025–2034, (USD MILLION)
FIGURE 122 OMAN 3D AUDIOCURRENT AND FUTURE TYPE ANALYSIS, 2025–2034, (USD MILLION)
FIGURE 123 OMAN 3D AUDIOCURRENT AND FUTURE END USER ANALYSIS, 2025–2034, (USD MILLION)
FIGURE 124 QATAR 3D AUDIOCURRENT AND FUTURE TYPE ANALYSIS, 2025–2034, (USD MILLION)
FIGURE 125 QATAR 3D AUDIOCURRENT AND FUTURE END USER ANALYSIS, 2025–2034, (USD MILLION)
FIGURE 126 EGYPT 3D AUDIOCURRENT AND FUTURE TYPE ANALYSIS, 2025–2034, (USD MILLION)
FIGURE 127 EGYPT 3D AUDIOCURRENT AND FUTURE END USER ANALYSIS, 2025–2034, (USD MILLION)
FIGURE 128 NIGERIA 3D AUDIOCURRENT AND FUTURE TYPE ANALYSIS, 2025–2034, (USD MILLION)
FIGURE 129 NIGERIA 3D AUDIOCURRENT AND FUTURE END USER ANALYSIS, 2025–2034, (USD MILLION)
FIGURE 130 SOUTH AFRICA 3D AUDIOCURRENT AND FUTURE TYPE ANALYSIS, 2025–2034, (USD MILLION)
FIGURE 131 SOUTH AFRICA 3D AUDIOCURRENT AND FUTURE END USER ANALYSIS, 2025–2034, (USD MILLION)
FIGURE 132 ISRAEL 3D AUDIOCURRENT AND FUTURE TYPE ANALYSIS, 2025–2034, (USD MILLION)
FIGURE 133 ISRAEL 3D AUDIOCURRENT AND FUTURE END USER ANALYSIS, 2025–2034, (USD MILLION)
FIGURE 134 REST OF MEA 3D AUDIOCURRENT AND FUTURE TYPE ANALYSIS, 2025–2034, (USD MILLION)
FIGURE 135 REST OF MEA 3D AUDIOCURRENT AND FUTURE END USER ANALYSIS, 2025–2034, (USD MILLION)
FIGURE 136 U. S. MARKET SHARE ANALYSIS BY TYPE (2024)
FIGURE 137 U. S. MARKET SHARE ANALYSIS BY END USER (2024)
FIGURE 138 CANADA MARKET SHARE ANALYSIS BY TYPE (2024)
FIGURE 139 CANADA MARKET SHARE ANALYSIS BY END USER (2024)
FIGURE 140 MEXICO MARKET SHARE ANALYSIS BY TYPE (2024)
FIGURE 141 MEXICO MARKET SHARE ANALYSIS BY END USER (2024)
FIGURE 142 CHINA MARKET SHARE ANALYSIS BY TYPE (2024)
FIGURE 143 CHINA MARKET SHARE ANALYSIS BY END USER (2024)
FIGURE 144 JAPAN MARKET SHARE ANALYSIS BY TYPE (2024)
FIGURE 145 JAPAN MARKET SHARE ANALYSIS BY END USER (2024)
FIGURE 146 INDIA MARKET SHARE ANALYSIS BY TYPE (2024)
FIGURE 147 INDIA MARKET SHARE ANALYSIS BY END USER (2024)
FIGURE 148 SOUTH KOREA MARKET SHARE ANALYSIS BY TYPE (2024)
FIGURE 149 SOUTH KOREA MARKET SHARE ANALYSIS BY END USER (2024)
FIGURE 150 SAUDI ARABIA MARKET SHARE ANALYSIS BY TYPE (2024)
FIGURE 151 SAUDI ARABIA MARKET SHARE ANALYSIS BY END USER (2024)
FIGURE 152 UAE MARKET SHARE ANALYSIS BY TYPE (2024)
FIGURE 153 UAE MARKET SHARE ANALYSIS BY END USER (2024)
FIGURE 154 EGYPT MARKET SHARE ANALYSIS BY TYPE (2024)
FIGURE 155 EGYPT MARKET SHARE ANALYSIS BY END USER (2024)
FIGURE 156 NIGERIA MARKET SHARE ANALYSIS BY TYPE (2024)
FIGURE 157 NIGERIA MARKET SHARE ANALYSIS BY END USER (2024)
FIGURE 158 SOUTH AFRICA MARKET SHARE ANALYSIS BY TYPE (2024)
FIGURE 159 SOUTH AFRICA MARKET SHARE ANALYSIS BY END USER (2024)
FIGURE 160 GERMANY MARKET SHARE ANALYSIS BY TYPE (2024)
FIGURE 161 GERMANY MARKET SHARE ANALYSIS BY END USER (2024)
FIGURE 162 FRANCE MARKET SHARE ANALYSIS BY TYPE (2024)
FIGURE 163 FRANCE MARKET SHARE ANALYSIS BY END USER (2024)
FIGURE 164 UK MARKET SHARE ANALYSIS BY TYPE (2024)
FIGURE 165 UK MARKET SHARE ANALYSIS BY END USER (2024)
FIGURE 166 SPAIN MARKET SHARE ANALYSIS BY TYPE (2024)
FIGURE 167 SPAIN MARKET SHARE ANALYSIS BY END USER (2024)
FIGURE 168 ITALY MARKET SHARE ANALYSIS BY TYPE (2024)
FIGURE 169 ITALY MARKET SHARE ANALYSIS BY END USER (2024)
FIGURE 170 BRAZIL MARKET SHARE ANALYSIS BY TYPE (2024)
FIGURE 171 BRAZIL MARKET SHARE ANALYSIS BY END USER (2024)
FIGURE 172 ARGENTINA MARKET SHARE ANALYSIS BY TYPE (2024)
FIGURE 173 ARGENTINA MARKET SHARE ANALYSIS BY END USER (2024)
FIGURE 174 COLUMBIA MARKET SHARE ANALYSIS BY TYPE (2024)
FIGURE 175 COLUMBIA MARKET SHARE ANALYSIS BY END USER (2024)
FIGURE 176 GLOBAL 3D AUDIOCURRENT AND FUTURE MARKET KEY COUNTRY LEVEL ANALYSIS, 2024–2034, (USD MILLION)
FIGURE 177 FINANCIAL OVERVIEW:
Key Player Analysis
Amazon Web Services: Amazon Web Services positions itself as a leader in cloud-based audio processing for 3D sound applications. The company strengthens its role through scalable compute, machine learning tools, and low-latency edge services that support real-time spatial audio rendering. AWS attracts media, gaming, and automotive clients that seek to process large audio workloads with consistent performance. Its audio-related services grow in line with the broader AWS media solutions portfolio, which has expanded at an estimated double-digit rate through 2024 and 2025. AWS invests in partnerships with audio engine developers and streaming platforms to support spatial audio pipelines. The launch of AI-enhanced rendering and personalization APIs in 2025 broadens adoption across entertainment and enterprise collaboration tools. Its global cloud footprint enables near-instant deployment of 3D audio workloads in North America, Europe, and Asia. The combination of ecosystem breadth, machine learning assets, and long-term enterprise contracts continues to differentiate AWS in the market.
AT&T: AT&T acts as a challenger in the 3D audio market with a strong focus on network-delivered spatial sound experiences. Its fiber and 5G networks support low-latency streaming for gaming, immersive entertainment, and metaverse applications. The company integrates 3D audio into premium subscription bundles and content partnerships, which helps raise adoption among its large U.S. subscriber base. AT&T reports steady growth in high-bandwidth content traffic, with immersive media accounting for an increasing share of downstream usage in 2025. The company invests in R&D with audio software firms to embed spatial audio in live sports, concerts, and event broadcasting. AT&T also collaborates with device makers to certify handsets and home entertainment systems for enhanced playback. Its network performance, customer reach, and control over distribution give it a competitive position in streaming-based spatial audio delivery.
Cisco: Cisco positions itself as an innovator in enterprise-focused 3D audio solutions. The company integrates spatial audio into collaboration platforms such as Webex to improve clarity and reduce meeting fatigue. This aligns with rising demand for advanced communication tools as hybrid work becomes standard in 2025. Cisco reports higher enterprise adoption of spatial audio features, supported by AI-driven voice separation and background noise control. Cisco enhances its competitive stance through acquisitions in AI-based voice processing and continued investment in cloud collaboration services. Its strength lies in secure, reliable enterprise infrastructure combined with integrated audio capabilities. The company’s installed global base across networks, meeting devices, and collaboration software gives it a strong position as spatial audio becomes a standard expectation in professional communication environments.
Market Key Players
Waves Audio Ltd.
Google
VisiSonics Corporation
Auro Technologies Inc
Hooke Audio
Sennheiser electronic GmbH & Co.
dearVR
Dolby Labs
3D Sound Labs
Fraunhofer
Other Key Players
Driver:
Demand for High-Fidelity Spatial Experiences
By 2026, the demand for immersive entertainment will reach new heights as streaming, gaming, and home theater activities take over leisure time. Spatial sound is now a key expectation for any modern viewing or gaming setup, rather than just a niche feature for enthusiasts. Major platforms like Netflix, Amazon Prime Video, and Apple Music now support formats such as Dolby Atmos, making 3D audio a standard requirement for delivering premium content.
Accelerated Hardware Upgrade Cycles
This shift in consumer preferences is pushing manufacturers to fill the market with 3D audio-enabled soundbars, high-end headphones, and connected smart speakers. As users expect precise sound placement, we see faster upgrade cycles and a greater willingness to pay for devices that can create a cinema-like experience at home. This increase in demand is the main driver for a market expected to grow at over 11 percent annually through 2030, changing how audio hardware is marketed and sold.
Restraint:
The Persistent 3D Content Gap
Despite the hardware boom, a limited supply of native spatial audio content remains a barrier to widespread adoption. While blockbuster titles and popular streaming shows are increasingly available in 3D formats, the amount of media still falls short compared to traditional stereo and 5.1 surround sound collections. This "content lag" makes some practical buyers hesitant to invest in costly, specialized hardware when most of their media consumption does not support full 3D playback.
High Costs of Spatial Post-Production
From the creator's standpoint, moving to 3D audio faces challenges due to higher production costs and longer post-processing times. Mastering audio for a three-dimensional environment requires specialized skills and costly software, which slows down the conversion of existing content. This issue delays mainstream adoption and lowers the immediate return for device makers, who must wait for the "content library" to catch up with their technical abilities.
Opportunity:
Automotive and Healthcare Integration
The growth of 3D audio in non-entertainment areas is opening up significant new revenue opportunities for component and software suppliers. Automotive manufacturers are increasingly using spatial sound to improve cockpit awareness, employing directional audio for navigation prompts and safety warnings, and enhancing the in-car media experience. At the same time, healthcare providers are adopting spatial audio in diagnostic training and therapeutic applications, where realistic soundscapes are crucial for patient care and practitioner precision.
Education and Simulation Growth
Education and training platforms are also shifting toward realistic soundscapes to enhance simulation-based learning, which boosts user engagement. These enterprise and industrial sectors are projected to create a multi-billion dollar market by 2030, often growing faster than traditional consumer entertainment. Engaging these sectors early enables providers to secure long-term B2B contracts and move toward more profitable service and licensing models.
Trend:
Spatial Audio in Enterprise Collaboration
In 2026, 3D audio use will rapidly increase in virtual meetings and digital collaboration tools. Businesses are looking for clearer separation of voices during large video conferences to reduce "Zoom fatigue" and enhance communication accuracy among global teams. By incorporating 3D rendering engines that place participants in different acoustic locations, platforms are making virtual interactions feel more natural and significantly improving speech clarity in noisy settings.
Standardizing the Vertical Sound Field
The trend toward supporting "height channels" is spreading across home and commercial audio systems, offering listeners a fuller vertical sound experience. This development is reshaping device design, software development plans, and content production strategies as spatial audio becomes a standard expectation across all digital channels. In communication, entertainment, or enterprise environments, the industry is moving towards a future where audio is inherently three-dimensional.
Recent Developments
Dec 2024 – Samsung & Google: Samsung and Google announced the first commercial deployments of the Immersive Audio Model and Formats (IAMF) standard across select smart TVs and Android devices, targeting coverage of nearly 20% of global premium TV shipments in 2025. The move strengthens their position against proprietary 3D audio formats and accelerates standard-based adoption across consumer electronics.
Feb 2025 – Dolby Laboratories: Dolby introduced an AI-assisted spatial mixing suite for Dolby Atmos, aimed at mid-tier studios and independent creators, with subscription pricing starting near USD 99 per month. The launch broadens content supply for 3D audio and reinforces Dolby’s role as a reference format across streaming, gaming, and broadcast.
Apr 2025 – Sony Group Corporation: Sony expanded its 360 Reality Audio catalog to over 25,000 tracks and announced new licensing deals with two global music distributors covering Europe and Asia Pacific. This expansion increases listener access to 3D content and supports higher hardware pull-through for compatible headphones and speakers.
Jul 2025 – Apple Inc.: Apple rolled out enhanced spatial audio profiles in iOS for AirPods and Beats devices, using on-device machine learning to adapt sound fields to ear shape and listening environment. The feature deepens user lock-in within the Apple ecosystem and raises the performance benchmark for mobile-centric 3D audio.
Sep 2025 – Meta Platforms: Meta released an upgraded spatial audio toolkit for VR and mixed reality developers on its XR platform, including real-time occlusion and room modeling, alongside funding support for more than 100 immersive content projects valued at over USD 30 million. The initiative strengthens Meta’s XR content pipeline and increases demand for advanced 3D audio capabilities across immersive applications.