3D Printing in Sustainable Housing Market to Hit $3.28B by 2034 | CAGR 45.1%
Global 3D Printing in Sustainable Housing Market Size, Share, Analysis Report By Material (Concrete, Plastics, Metals, Ceramics, Composites, Others), Construction Method (Extrusion-based 3D Printing, Powder Bed Fusion, Binder Jetting, Directed Energy Deposition, Sheet Lamination), Application (Commercial, Residential, Industrial), Region and Key Players - Industry Segment Overview, Market Dynamics, Competitive Strategies, Trends and Forecast 2025-2034
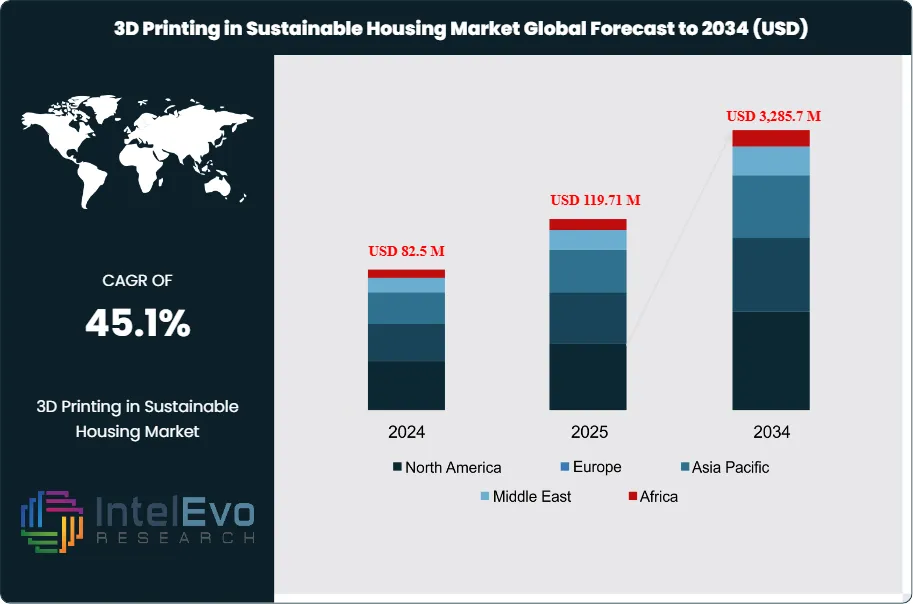
The 3D Printing in Sustainable Housing Market size is expected to be worth around USD 3,285.7 Million by 2034, up from USD 82.5 Million in 2024, growing at a CAGR of 45.1% during the forecast period from 2024 to 2034. This surge is fueled by rising demand for affordable, eco-friendly housing solutions and rapid advancements in 3D printing technology. Governments and private developers worldwide are increasingly adopting additive manufacturing to reduce construction costs, minimize waste, and accelerate sustainable urban development.
The global 3D printing in sustainable housing market is witnessing fast growth as advancements in additive manufacturing technology with the increasing demand for cost-effective and eco-friendly housing solutions. 3D printing is also known as additive manufacturing. It expresses the method of construction, during which structures are built, layer by layer, from varied materials, such as concrete, plastics, metals, ceramics, composites, and others. This method has the advantage of minimizing material waste, energy consumption, and labor requirements in processes used during construction stages that make it one of the most imperative driving forces behind the green building movement.
3D printing in sustainable housing refers to the use of this technology for the building of residential, commercial, and industrial structures in a manner that avoids any environmental impact. This allows for the recyclable low-carbon material usage, as it minimizes the consumption of energy due to transportation; hence, energy efficiency while building strong structures is allowed. This process does not only save time but also delivers more efficient ends as desired in modern current sustainability standards.
The market is segmented by construction methods, such as extrusion-based 3D printing, powder bed fusion, binder jetting, directed energy deposition, and sheet lamination. Each method offers its own advantages-from rapid large-scale construction to high-precision manufacturing of complex architectural components.
In application, 3D printing markets of sustainable housing cut across residential, commercial, and industrial segments. Most significant momentum is seen within the residential segment, because a greater number of 3D-printed homes are being designed to solve the affordability and sustainability issues around the world. The commercial sector uses this technology for office buildings and retail spaces, and also in industrials, it focuses on warehouses and production facilities.
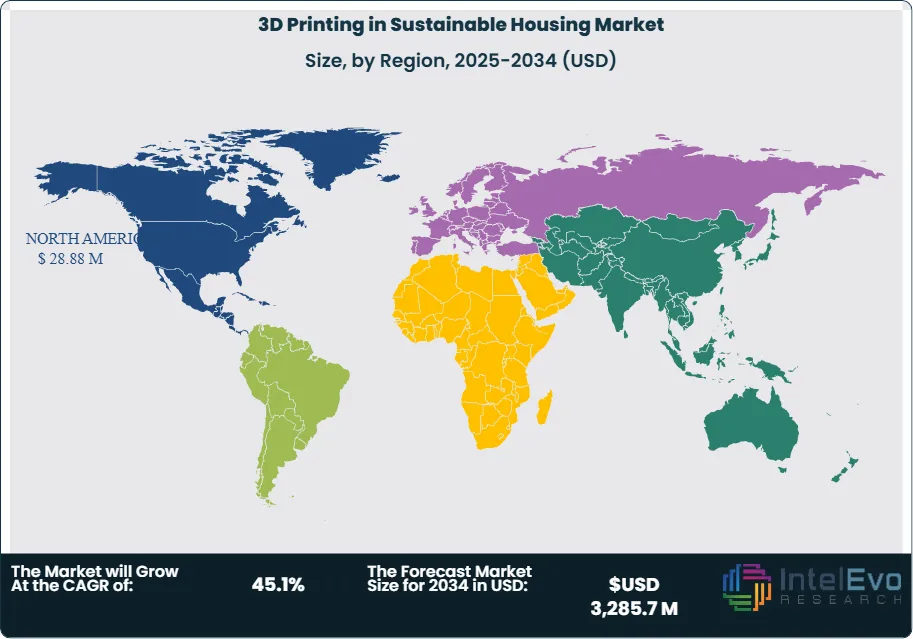
Geographically, the market spans North America, Europe, Asia-Pacific, Latin America, and the Middle East & Africa. North America and Europe are perceived to be leaders in embracing 3D printing in construction because of government initiatives and increasing environmental regulations. Asia-Pacific emerges as a key player in the regions where affordable housing and smart city demands are greater. Other regions that hold promise are Latin America and the Middle East & Africa as governments within these regions are keen on solving housing shortages and building infrastructure to be resilient.
Key Takeaways
Market Growth: The 3D Printing in Sustainable Housing market is expected to reach USD 3,285.7 million by 2034, growing at a robust CAGR of 45.1%, indicating strong market expansion.
Material Dominance: Concrete dominates the material segment due to its strength, availability, and suitability for 3D printing. It is the primary choice for building durable and cost-effective structures, making it essential for large-scale sustainable housing projects globally.
Construction Method Preference: Extrusion-based 3D printing leads the market due to its scalability and ability to create entire structures layer-by-layer quickly. It is widely adopted for housing, offering cost and material savings while ensuring rapid, sustainable construction.
Application Dominance: The residential sector dominates, driven by the growing need for affordable, sustainable homes. 3D printing technology enables faster construction, reduced waste, and innovative designs, making it ideal for addressing housing shortages and environmental concerns.
Driver: The demand for 3D Printing in Sustainable Housing is increasing across multiple industries, particularly in healthcare (for imaging and anesthesia), aerospace (for ion propulsion systems), and electronics (for semiconductor manufacturing). The rising investment in healthcare, driven by an aging population and advancements in medical technologies, is boosting the demand for high-purity 3D Printing in Sustainable Housing.
Restraint: The cost of producing high-purity xenon can be significant, which may limit its accessibility for some applications. Stringent regulations regarding the handling and use of industrial gases can impact market dynamics and operational costs.
Opportunity: The growing demand for 3D Printing in Sustainable Housing in developing regions, particularly in Asia-Pacific, presents significant growth opportunities for manufacturers. Expanding the use of 3D Printing in Sustainable Housing in new technologies, such as advanced lighting systems and energy-efficient solutions, can create new revenue streams.
Trend: Cylinder distribution remains the dominant supply mode, accounting for over 43% of the market, reflecting the preference for convenience and portability.
Regional Analysis: North America dominates the market, propelled by advanced technology adoption, government sustainability initiatives, and strong R&D efforts. The region's focus on eco-friendly construction and housing affordability supports widespread 3D printing in sustainable housing projects.
Material Analysis:
Concrete dominates the material segment due to its versatility, structural integrity, and compatibility with large-scale 3D printing. Green alternatives like recycled concrete and geopolymers increase usage for green construction. Plastics are frequently used for housing components, such as appliances and insulation. Biodegradable and recycled plastics are increasingly important. Metals do not have a wide application, particularly for complete structures but have utility for supporting elements in housing. Ceramics is used for detailed designs and insulation properties, and composites combined to enhance strength and flexibility offer innovative options for sustainable housing. Other materials that are natural fibers and advanced recyclables offer opportunities for more environmentally friendly products, especially in experimental or niche designs of housing.
Construction Method Analysis:
Extrusion-based 3D printing is the leading market by methods of construction since it enables a fully printed structure, layer by layer, using materials such as concrete. The technique also presents huge cost-saving potential for high scalability and rapid construction times, ideal for affordable housing. Powder Bed Fusion is quickly gaining traction within the housing sector to create complex parts and detailed structures made from metals and ceramics, for which it is widely used in industrial applications. Binder Jetting is very accurate but not well suited for large-scale housing structures rather than small-scale components. Directed Energy Deposition is used in extremely limited niche applications for repairs or modification purposes. Sheet Lamination is a developing technology in construction with great potential for future 3D-printed housing application using composite or recyclable materials.
Application Analysis:
The residential sector is leading the application market, with most demand for affordable and sustainable housing. The 3D printing technology is solving worldwide housing shortages since one can build faster, cheaper houses with a lesser negative impact on the environment. In the commercial segment, 3D printing applies in office spaces, retail buildings, and other commercial facilities characterized by sustainability and innovative architectural designs. The industrial sector is gaining momentum as companies increasingly employ 3D printing in warehouses, factories, and other large edifices where green construction techniques will assist them in lowering costs and saving on material usage. This capability to produce energy-efficient, customized, and permanent structures within all of these segments indicates the importance of the market pertaining to sustainable housing.
Region Analysis:
North America Leads With 35% Market Share In 3D Printing in Sustainable Housing market. North America, with advanced technological infrastructure and government support for innovation, combined with the use of an eco-friendly material during construction, dominates the 3D printing in sustainable housing market. The US alone has many pilot programs that are focused upon the use of 3D printing to help alleviate the affordable housing deficit. This region boasts a robust ecosystem of R&D and partnerships between tech companies, construction companies, and governments to encourage more cutting-edge methods of the construction of sustainable housing. Facilitating this is the positive regulations governing green building and renewable materials adoption at the different tiers of government in North America, with the region holding the top position. Continued market demand in this area is churned on by the need for rapid and cost-effective housing solutions that are responsible to the environment; hence, North America leads the rest of the world in their sustainable 3D-printed housing development.
Asia-Pacific is the fastest-growing region in the 3D printing sustainable housing market, driven by rapid urbanization, increased demand for affordable housing, and government initiatives for promoting green building. China, Japan, and India are investing more to create smart cities and sustainable infrastructure, where 3D printing is utilized. Housing shortage in the region coupled with the need for low-cost and scalable solutions is driving the acceptance of 3D printing technologies. In addition, large-scale Asia-Pacific construction projects, increasing environmental awareness, are fertile ground for the growth of 3D printing. The region will, therefore, likely become a leading market in sustainable housing with additive manufacturing due to further technological development.
By Material (Concrete, Composites, Recycled Materials (Plastics, Metals, Ceramics), Others), By Construction Method (Extrusion-Based 3D Printing, Powder Bonding, Binder Jetting, Directed Energy Deposition, Sheet Lamination, Others), By Application (Residential Housing, Affordable Housing Projects, Disaster Relief Shelters, Commercial & Institutional Buildings)
Research Methodology
Primary Research- 100 Interviews of Stakeholders
Secondary Research
Desk Research
Regional scope
North America (United States, Canada, Mexico)
Latin America (Brazil, Argentina, Columbia)
East Asia And Pacific (China, Japan, South Korea, Australia, Cambodia, Fiji, Indonesia)
Sea And South Asia (India, Singapore, Thailand, Taiwan, Malaysia)
Eastern Europe (Poland, Russia, Czech Republic, Romania)
Western Europe (Germany, U.K., France, Spain, Itlay)
Middle East & Africa (GCC Countries, Egypt, Nigeria, South Africa, Israel)
Competitive Landscape
ICON Technology, Inc., COBOD International A/S, Apis Cor, Inc., Winsun Global, Mighty Buildings, Inc., XtreeE SAS, CyBe Construction B.V., Branch Technology, Inc., SQ4D Inc., Contour Crafting Corporation, Yingchuang Building Technique (Shanghai) Co., Ltd., Cazza Construction Technologies, MudBots 3D Concrete Printing, Alquist 3D, Luyten 3D, Total Kustom, Sika AG, MX3D, Concreative, Black Buffalo 3D, WASP (World’s Advanced Saving Project), LafargeHolcim (Holcim Group), BatiPrint3D
Customization Scope
Customization for segments, region/country-level will be provided. Moreover, additional customization can be done based on the requirements.
Pricing and Purchase Options
Avail customized purchase options to meet your exact research needs. We have three licenses to opt for: Single User License, Multi-User License (Up to 5 Users), Corporate Use License (Unlimited User and Printable PDF).
TABLE OF CONTENTS
1. EXECUTIVE SUMMARY
1.1. MARKET SNAPSHOT
1.2. KEY FINDINGS & INSIGHTS
1.3. ANALYST RECOMMENDATIONS
1.4. FUTURE OUTLOOK
2. RESEARCH METHODOLOGY
2.1. MARKET DEFINITION & SCOPE
2.2. RESEARCH OBJECTIVES: PRIMARY & SECONDARY DATA SOURCES
2.3. DATA COLLECTION SOURCES
2.3.1. COVERAGE OF 100+ PRIMARY RESEARCH/CONSULTATION CALLS WITH INDUSTRY STAKEHOLDERS
FIGURE 17 NORTH AMERICA 3D PRINTING IN SUSTAINABLE HOUSING CURRENT AND FUTURE TYPE ANALYSIS, 2025–2034, (USD MILLION)
FIGURE 18 NORTH AMERICA 3D PRINTING IN SUSTAINABLE HOUSING CURRENT AND FUTURE END USER ANALYSIS, 2025–2034, (USD MILLION)
FIGURE 19 MARKET SHARE BY COUNTRY
FIGURE 20 LATIN AMERICA 3D PRINTING IN SUSTAINABLE HOUSING CURRENT AND FUTURE TYPE ANALYSIS, 2025–2034, (USD MILLION)
FIGURE 21 LATIN AMERICA 3D PRINTING IN SUSTAINABLE HOUSING CURRENT AND FUTURE END USER ANALYSIS, 2025–2034, (USD MILLION)
FIGURE 22 MARKET SHARE BY COUNTRY
FIGURE 23 EASTERN EUROPE 3D PRINTING IN SUSTAINABLE HOUSING CURRENT AND FUTURE TYPE ANALYSIS, 2025–2034, (USD MILLION)
FIGURE 24 EASTERN EUROPE 3D PRINTING IN SUSTAINABLE HOUSING CURRENT AND FUTURE END USER ANALYSIS, 2025–2034, (USD MILLION)
FIGURE 25 MARKET SHARE BY COUNTRY
FIGURE 26 WESTERN EUROPE 3D PRINTING IN SUSTAINABLE HOUSING CURRENT AND FUTURE TYPE ANALYSIS, 2025–2034, (USD MILLION)
FIGURE 27 WESTERN EUROPE 3D PRINTING IN SUSTAINABLE HOUSING CURRENT AND FUTURE END USER ANALYSIS, 2025–2034, (USD MILLION)
FIGURE 28 MARKET SHARE BY COUNTRY
FIGURE 29 EAST ASIA AND PACIFIC 3D PRINTING IN SUSTAINABLE HOUSING CURRENT AND FUTURE TYPE ANALYSIS, 2025–2034, (USD MILLION)
FIGURE 30 EAST ASIA AND PACIFIC 3D PRINTING IN SUSTAINABLE HOUSING CURRENT AND FUTURE END USER ANALYSIS, 2025–2034, (USD MILLION)
FIGURE 31 MARKET SHARE BY COUNTRY
FIGURE 32 SEA AND SOUTH ASIA 3D PRINTING IN SUSTAINABLE HOUSING CURRENT AND FUTURE TYPE ANALYSIS, 2025–2034, (USD MILLION)
FIGURE 33 SEA AND SOUTH ASIA 3D PRINTING IN SUSTAINABLE HOUSING CURRENT AND FUTURE END USER ANALYSIS, 2025–2034, (USD MILLION)
FIGURE 34 MARKET SHARE BY COUNTRY
FIGURE 35 MIDDLE EAST AND AFRICA 3D PRINTING IN SUSTAINABLE HOUSING CURRENT AND FUTURE TYPE ANALYSIS, 2025–2034, (USD MILLION)
FIGURE 36 MIDDLE EAST AND AFRICA 3D PRINTING IN SUSTAINABLE HOUSING CURRENT AND FUTURE END USER ANALYSIS, 2025–2034, (USD MILLION)
FIGURE 37 NORTH AMERICA 3D PRINTING IN SUSTAINABLE HOUSING CURRENT AND FUTURE MARKET VOLUME SHARE REGIONAL ANALYSIS, 2025–2034, (USD MILLION)
FIGURE 38 U.S. 3D PRINTING IN SUSTAINABLE HOUSING CURRENT AND FUTURE TYPE ANALYSIS, 2025–2034, (USD MILLION)
FIGURE 39 U.S. 3D PRINTING IN SUSTAINABLE HOUSING CURRENT AND FUTURE END USER ANALYSIS, 2025–2034, (USD MILLION)
FIGURE 40 CANADA 3D PRINTING IN SUSTAINABLE HOUSING CURRENT AND FUTURE TYPE ANALYSIS, 2025–2034, (USD MILLION)
FIGURE 41 CANADA 3D PRINTING IN SUSTAINABLE HOUSING CURRENT AND FUTURE END USER ANALYSIS, 2025–2034, (USD MILLION)
FIGURE 42 LATIN AMERICA 3D PRINTING IN SUSTAINABLE HOUSING CURRENT AND FUTURE MARKET VOLUME SHARE REGIONAL ANALYSIS, 2025–2034, (USD MILLION)
FIGURE 43 MEXICO 3D PRINTING IN SUSTAINABLE HOUSING CURRENT AND FUTURE TYPE ANALYSIS, 2025–2034, (USD MILLION)
FIGURE 44 MEXICO 3D PRINTING IN SUSTAINABLE HOUSING CURRENT AND FUTURE END USER ANALYSIS, 2025–2034, (USD MILLION)
FIGURE 45 BRAZIL 3D PRINTING IN SUSTAINABLE HOUSING CURRENT AND FUTURE TYPE ANALYSIS, 2025–2034, (USD MILLION)
FIGURE 46 BRAZIL 3D PRINTING IN SUSTAINABLE HOUSING CURRENT AND FUTURE END USER ANALYSIS, 2025–2034, (USD MILLION)
FIGURE 47 ARGENTINA 3D PRINTING IN SUSTAINABLE HOUSING CURRENT AND FUTURE TYPE ANALYSIS, 2025–2034, (USD MILLION)
FIGURE 48 ARGENTINA 3D PRINTING IN SUSTAINABLE HOUSING CURRENT AND FUTURE END USER ANALYSIS, 2025–2034, (USD MILLION)
FIGURE 49 COLUMBIA 3D PRINTING IN SUSTAINABLE HOUSING CURRENT AND FUTURE TYPE ANALYSIS, 2025–2034, (USD MILLION)
FIGURE 50 COLUMBIA 3D PRINTING IN SUSTAINABLE HOUSING CURRENT AND FUTURE END USER ANALYSIS, 2025–2034, (USD MILLION)
FIGURE 51 REST OF LATIN AMERICA 3D PRINTING IN SUSTAINABLE HOUSING CURRENT AND FUTURE TYPE ANALYSIS, 2025–2034, (USD MILLION)
FIGURE 52 REST OF LATIN AMERICA 3D PRINTING IN SUSTAINABLE HOUSING CURRENT AND FUTURE END USER ANALYSIS, 2025–2034, (USD MILLION)
FIGURE 53 EASTERN EUROPE 3D PRINTING IN SUSTAINABLE HOUSING CURRENT AND FUTURE MARKET VOLUME SHARE REGIONAL ANALYSIS, 2025–2034, (USD MILLION)
FIGURE 54 POLAND 3D PRINTING IN SUSTAINABLE HOUSING CURRENT AND FUTURE TYPE ANALYSIS, 2025–2034, (USD MILLION)
FIGURE 55 POLAND 3D PRINTING IN SUSTAINABLE HOUSING CURRENT AND FUTURE END USER ANALYSIS, 2025–2034, (USD MILLION)
FIGURE 56 RUSSIA 3D PRINTING IN SUSTAINABLE HOUSING CURRENT AND FUTURE TYPE ANALYSIS, 2025–2034, (USD MILLION)
FIGURE 57 RUSSIA 3D PRINTING IN SUSTAINABLE HOUSING CURRENT AND FUTURE END USER ANALYSIS, 2025–2034, (USD MILLION)
FIGURE 58 CZECH REPUBLIC 3D PRINTING IN SUSTAINABLE HOUSING CURRENT AND FUTURE TYPE ANALYSIS, 2025–2034, (USD MILLION)
FIGURE 59 CZECH REPUBLIC 3D PRINTING IN SUSTAINABLE HOUSING CURRENT AND FUTURE END USER ANALYSIS, 2025–2034, (USD MILLION)
FIGURE 60 ROMANIA 3D PRINTING IN SUSTAINABLE HOUSING CURRENT AND FUTURE TYPE ANALYSIS, 2025–2034, (USD MILLION)
FIGURE 61 ROMANIA 3D PRINTING IN SUSTAINABLE HOUSING CURRENT AND FUTURE END USER ANALYSIS, 2025–2034, (USD MILLION)
FIGURE 62 REST OF EASTERN EUROPE 3D PRINTING IN SUSTAINABLE HOUSING CURRENT AND FUTURE TYPE ANALYSIS, 2025–2034, (USD MILLION)
FIGURE 63 REST OF EASTERN EUROPE 3D PRINTING IN SUSTAINABLE HOUSING CURRENT AND FUTURE END USER ANALYSIS, 2025–2034, (USD MILLION)
FIGURE 64 WESTERN EUROPE 3D PRINTING IN SUSTAINABLE HOUSING CURRENT AND FUTURE MARKET VOLUME SHARE REGIONAL ANALYSIS, 2025–2034, (USD MILLION)
FIGURE 65 GERMANY 3D PRINTING IN SUSTAINABLE HOUSING CURRENT AND FUTURE TYPE ANALYSIS, 2025–2034, (USD MILLION)
FIGURE 66 GERMANY 3D PRINTING IN SUSTAINABLE HOUSING CURRENT AND FUTURE END USER ANALYSIS, 2025–2034, (USD MILLION)
FIGURE 67 FRANCE 3D PRINTING IN SUSTAINABLE HOUSING CURRENT AND FUTURE TYPE ANALYSIS, 2025–2034, (USD MILLION)
FIGURE 68 FRANCE 3D PRINTING IN SUSTAINABLE HOUSING CURRENT AND FUTURE END USER ANALYSIS, 2025–2034, (USD MILLION)
FIGURE 69 UK 3D PRINTING IN SUSTAINABLE HOUSING CURRENT AND FUTURE TYPE ANALYSIS, 2025–2034, (USD MILLION)
FIGURE 70 UK 3D PRINTING IN SUSTAINABLE HOUSING CURRENT AND FUTURE END USER ANALYSIS, 2025–2034, (USD MILLION)
FIGURE 71 SPAIN 3D PRINTING IN SUSTAINABLE HOUSING CURRENT AND FUTURE TYPE ANALYSIS, 2025–2034, (USD MILLION)
FIGURE 72 SPAIN 3D PRINTING IN SUSTAINABLE HOUSING CURRENT AND FUTURE END USER ANALYSIS, 2025–2034, (USD MILLION)
FIGURE 73 ITALY 3D PRINTING IN SUSTAINABLE HOUSING CURRENT AND FUTURE TYPE ANALYSIS, 2025–2034, (USD MILLION)
FIGURE 74 ITALY 3D PRINTING IN SUSTAINABLE HOUSING CURRENT AND FUTURE END USER ANALYSIS, 2025–2034, (USD MILLION)
FIGURE 75 REST OF WESTERN EUROPE 3D PRINTING IN SUSTAINABLE HOUSING CURRENT AND FUTURE TYPE ANALYSIS, 2025–2034, (USD MILLION)
FIGURE 76 REST OF WESTERN EUROPE 3D PRINTING IN SUSTAINABLE HOUSING CURRENT AND FUTURE END USER ANALYSIS, 2025–2034, (USD MILLION)
FIGURE 77 EAST ASIA AND PACIFIC 3D PRINTING IN SUSTAINABLE HOUSING CURRENT AND FUTURE MARKET VOLUME SHARE REGIONAL ANALYSIS, 2025–2034, (USD MILLION)
FIGURE 78 CHINA 3D PRINTING IN SUSTAINABLE HOUSING CURRENT AND FUTURE TYPE ANALYSIS, 2025–2034, (USD MILLION)
FIGURE 79 CHINA 3D PRINTING IN SUSTAINABLE HOUSING CURRENT AND FUTURE END USER ANALYSIS, 2025–2034, (USD MILLION)
FIGURE 80 JAPAN 3D PRINTING IN SUSTAINABLE HOUSING CURRENT AND FUTURE TYPE ANALYSIS, 2025–2034, (USD MILLION)
FIGURE 81 JAPAN 3D PRINTING IN SUSTAINABLE HOUSING CURRENT AND FUTURE END USER ANALYSIS, 2025–2034, (USD MILLION)
FIGURE 82 AUSTRALIA 3D PRINTING IN SUSTAINABLE HOUSING CURRENT AND FUTURE TYPE ANALYSIS, 2025–2034, (USD MILLION)
FIGURE 83 AUSTRALIA 3D PRINTING IN SUSTAINABLE HOUSING CURRENT AND FUTURE END USER ANALYSIS, 2025–2034, (USD MILLION)
FIGURE 84 CAMBODIA 3D PRINTING IN SUSTAINABLE HOUSING CURRENT AND FUTURE TYPE ANALYSIS, 2025–2034, (USD MILLION)
FIGURE 85 CAMBODIA 3D PRINTING IN SUSTAINABLE HOUSING CURRENT AND FUTURE END USER ANALYSIS, 2025–2034, (USD MILLION)
FIGURE 86 FIJI 3D PRINTING IN SUSTAINABLE HOUSING CURRENT AND FUTURE TYPE ANALYSIS, 2025–2034, (USD MILLION)
FIGURE 87 FIJI 3D PRINTING IN SUSTAINABLE HOUSING CURRENT AND FUTURE END USER ANALYSIS, 2025–2034, (USD MILLION)
FIGURE 88 INDONESIA 3D PRINTING IN SUSTAINABLE HOUSING CURRENT AND FUTURE TYPE ANALYSIS, 2025–2034, (USD MILLION)
FIGURE 89 INDONESIA 3D PRINTING IN SUSTAINABLE HOUSING CURRENT AND FUTURE END USER ANALYSIS, 2025–2034, (USD MILLION)
FIGURE 90 SOUTH KOREA 3D PRINTING IN SUSTAINABLE HOUSING CURRENT AND FUTURE TYPE ANALYSIS, 2025–2034, (USD MILLION)
FIGURE 91 SOUTH KOREA 3D PRINTING IN SUSTAINABLE HOUSING CURRENT AND FUTURE END USER ANALYSIS, 2025–2034, (USD MILLION)
FIGURE 92 REST OF EAST ASIA AND PACIFIC 3D PRINTING IN SUSTAINABLE HOUSING CURRENT AND FUTURE TYPE ANALYSIS, 2025–2034, (USD MILLION)
FIGURE 93 REST OF EAST ASIA AND PACIFIC 3D PRINTING IN SUSTAINABLE HOUSING CURRENT AND FUTURE END USER ANALYSIS, 2025–2034, (USD MILLION)
FIGURE 94 SEA AND SOUTH ASIA 3D PRINTING IN SUSTAINABLE HOUSING CURRENT AND FUTURE MARKET VOLUME SHARE REGIONAL ANALYSIS, 2025–2034, (USD MILLION)
FIGURE 95 BANGLADESH 3D PRINTING IN SUSTAINABLE HOUSING CURRENT AND FUTURE TYPE ANALYSIS, 2025–2034, (USD MILLION)
FIGURE 96 BANGLADESH 3D PRINTING IN SUSTAINABLE HOUSING CURRENT AND FUTURE END USER ANALYSIS, 2025–2034, (USD MILLION)
FIGURE 97 NEW ZEALAND 3D PRINTING IN SUSTAINABLE HOUSING CURRENT AND FUTURE TYPE ANALYSIS, 2025–2034, (USD MILLION)
FIGURE 98 NEW ZEALAND 3D PRINTING IN SUSTAINABLE HOUSING CURRENT AND FUTURE END USER ANALYSIS, 2025–2034, (USD MILLION)
FIGURE 99 INDIA 3D PRINTING IN SUSTAINABLE HOUSING CURRENT AND FUTURE TYPE ANALYSIS, 2025–2034, (USD MILLION)
FIGURE 100 INDIA 3D PRINTING IN SUSTAINABLE HOUSING CURRENT AND FUTURE END USER ANALYSIS, 2025–2034, (USD MILLION)
FIGURE 101 SINGAPORE 3D PRINTING IN SUSTAINABLE HOUSING CURRENT AND FUTURE TYPE ANALYSIS, 2025–2034, (USD MILLION)
FIGURE 102 SINGAPORE 3D PRINTING IN SUSTAINABLE HOUSING CURRENT AND FUTURE END USER ANALYSIS, 2025–2034, (USD MILLION)
FIGURE 103 THAILAND 3D PRINTING IN SUSTAINABLE HOUSING CURRENT AND FUTURE TYPE ANALYSIS, 2025–2034, (USD MILLION)
FIGURE 104 THAILAND 3D PRINTING IN SUSTAINABLE HOUSING CURRENT AND FUTURE END USER ANALYSIS, 2025–2034, (USD MILLION)
FIGURE 105 TAIWAN 3D PRINTING IN SUSTAINABLE HOUSING CURRENT AND FUTURE TYPE ANALYSIS, 2025–2034, (USD MILLION)
FIGURE 106 TAIWAN 3D PRINTING IN SUSTAINABLE HOUSING CURRENT AND FUTURE END USER ANALYSIS, 2025–2034, (USD MILLION)
FIGURE 107 MALAYSIA 3D PRINTING IN SUSTAINABLE HOUSING CURRENT AND FUTURE TYPE ANALYSIS, 2025–2034, (USD MILLION)
FIGURE 108 MALAYSIA 3D PRINTING IN SUSTAINABLE HOUSING CURRENT AND FUTURE END USER ANALYSIS, 2025–2034, (USD MILLION)
FIGURE 109 REST OF SEA AND SOUTH ASIA 3D PRINTING IN SUSTAINABLE HOUSING CURRENT AND FUTURE TYPE ANALYSIS, 2025–2034, (USD MILLION)
FIGURE 110 REST OF SEA AND SOUTH ASIA 3D PRINTING IN SUSTAINABLE HOUSING CURRENT AND FUTURE END USER ANALYSIS, 2025–2034, (USD MILLION)
FIGURE 111 MIDDLE EAST AND AFRICA 3D PRINTING IN SUSTAINABLE HOUSING CURRENT AND FUTURE MARKET VOLUME SHARE REGIONAL ANALYSIS, 2025–2034, (USD MILLION)
FIGURE 112 GCC COUNTRIES 3D PRINTING IN SUSTAINABLE HOUSING CURRENT AND FUTURE TYPE ANALYSIS, 2025–2034, (USD MILLION)
FIGURE 113 GCC COUNTRIES 3D PRINTING IN SUSTAINABLE HOUSING CURRENT AND FUTURE END USER ANALYSIS, 2025–2034, (USD MILLION)
FIGURE 114 SAUDI ARABIA 3D PRINTING IN SUSTAINABLE HOUSING CURRENT AND FUTURE TYPE ANALYSIS, 2025–2034, (USD MILLION)
FIGURE 115 SAUDI ARABIA 3D PRINTING IN SUSTAINABLE HOUSING CURRENT AND FUTURE END USER ANALYSIS, 2025–2034, (USD MILLION)
FIGURE 116 UAE 3D PRINTING IN SUSTAINABLE HOUSING CURRENT AND FUTURE TYPE ANALYSIS, 2025–2034, (USD MILLION)
FIGURE 117 UAE 3D PRINTING IN SUSTAINABLE HOUSING CURRENT AND FUTURE END USER ANALYSIS, 2025–2034, (USD MILLION)
FIGURE 118 BAHRAIN 3D PRINTING IN SUSTAINABLE HOUSING CURRENT AND FUTURE TYPE ANALYSIS, 2025–2034, (USD MILLION)
FIGURE 119 BAHRAIN 3D PRINTING IN SUSTAINABLE HOUSING CURRENT AND FUTURE END USER ANALYSIS, 2025–2034, (USD MILLION)
FIGURE 120 KUWAIT 3D PRINTING IN SUSTAINABLE HOUSING CURRENT AND FUTURE TYPE ANALYSIS, 2025–2034, (USD MILLION)
FIGURE 121 KUWAIT 3D PRINTING IN SUSTAINABLE HOUSING CURRENT AND FUTURE END USER ANALYSIS, 2025–2034, (USD MILLION)
FIGURE 122 OMAN 3D PRINTING IN SUSTAINABLE HOUSING CURRENT AND FUTURE TYPE ANALYSIS, 2025–2034, (USD MILLION)
FIGURE 123 OMAN 3D PRINTING IN SUSTAINABLE HOUSING CURRENT AND FUTURE END USER ANALYSIS, 2025–2034, (USD MILLION)
FIGURE 124 QATAR 3D PRINTING IN SUSTAINABLE HOUSING CURRENT AND FUTURE TYPE ANALYSIS, 2025–2034, (USD MILLION)
FIGURE 125 QATAR 3D PRINTING IN SUSTAINABLE HOUSING CURRENT AND FUTURE END USER ANALYSIS, 2025–2034, (USD MILLION)
FIGURE 126 EGYPT 3D PRINTING IN SUSTAINABLE HOUSING CURRENT AND FUTURE TYPE ANALYSIS, 2025–2034, (USD MILLION)
FIGURE 127 EGYPT 3D PRINTING IN SUSTAINABLE HOUSING CURRENT AND FUTURE END USER ANALYSIS, 2025–2034, (USD MILLION)
FIGURE 128 NIGERIA 3D PRINTING IN SUSTAINABLE HOUSING CURRENT AND FUTURE TYPE ANALYSIS, 2025–2034, (USD MILLION)
FIGURE 129 NIGERIA 3D PRINTING IN SUSTAINABLE HOUSING CURRENT AND FUTURE END USER ANALYSIS, 2025–2034, (USD MILLION)
FIGURE 130 SOUTH AFRICA 3D PRINTING IN SUSTAINABLE HOUSING CURRENT AND FUTURE TYPE ANALYSIS, 2025–2034, (USD MILLION)
FIGURE 131 SOUTH AFRICA 3D PRINTING IN SUSTAINABLE HOUSING CURRENT AND FUTURE END USER ANALYSIS, 2025–2034, (USD MILLION)
FIGURE 132 ISRAEL 3D PRINTING IN SUSTAINABLE HOUSING CURRENT AND FUTURE TYPE ANALYSIS, 2025–2034, (USD MILLION)
FIGURE 133 ISRAEL 3D PRINTING IN SUSTAINABLE HOUSING CURRENT AND FUTURE END USER ANALYSIS, 2025–2034, (USD MILLION)
FIGURE 134 REST OF MEA 3D PRINTING IN SUSTAINABLE HOUSING CURRENT AND FUTURE TYPE ANALYSIS, 2025–2034, (USD MILLION)
FIGURE 135 REST OF MEA 3D PRINTING IN SUSTAINABLE HOUSING CURRENT AND FUTURE END USER ANALYSIS, 2025–2034, (USD MILLION)
FIGURE 136 U. S. MARKET SHARE ANALYSIS BY TYPE (2024)
FIGURE 137 U. S. MARKET SHARE ANALYSIS BY END USER (2024)
FIGURE 138 CANADA MARKET SHARE ANALYSIS BY TYPE (2024)
FIGURE 139 CANADA MARKET SHARE ANALYSIS BY END USER (2024)
FIGURE 140 MEXICO MARKET SHARE ANALYSIS BY TYPE (2024)
FIGURE 141 MEXICO MARKET SHARE ANALYSIS BY END USER (2024)
FIGURE 142 CHINA MARKET SHARE ANALYSIS BY TYPE (2024)
FIGURE 143 CHINA MARKET SHARE ANALYSIS BY END USER (2024)
FIGURE 144 JAPAN MARKET SHARE ANALYSIS BY TYPE (2024)
FIGURE 145 JAPAN MARKET SHARE ANALYSIS BY END USER (2024)
FIGURE 146 INDIA MARKET SHARE ANALYSIS BY TYPE (2024)
FIGURE 147 INDIA MARKET SHARE ANALYSIS BY END USER (2024)
FIGURE 148 SOUTH KOREA MARKET SHARE ANALYSIS BY TYPE (2024)
FIGURE 149 SOUTH KOREA MARKET SHARE ANALYSIS BY END USER (2024)
FIGURE 150 SAUDI ARABIA MARKET SHARE ANALYSIS BY TYPE (2024)
FIGURE 151 SAUDI ARABIA MARKET SHARE ANALYSIS BY END USER (2024)
FIGURE 152 UAE MARKET SHARE ANALYSIS BY TYPE (2024)
FIGURE 153 UAE MARKET SHARE ANALYSIS BY END USER (2024)
FIGURE 154 EGYPT MARKET SHARE ANALYSIS BY TYPE (2024)
FIGURE 155 EGYPT MARKET SHARE ANALYSIS BY END USER (2024)
FIGURE 156 NIGERIA MARKET SHARE ANALYSIS BY TYPE (2024)
FIGURE 157 NIGERIA MARKET SHARE ANALYSIS BY END USER (2024)
FIGURE 158 SOUTH AFRICA MARKET SHARE ANALYSIS BY TYPE (2024)
FIGURE 159 SOUTH AFRICA MARKET SHARE ANALYSIS BY END USER (2024)
FIGURE 160 GERMANY MARKET SHARE ANALYSIS BY TYPE (2024)
FIGURE 161 GERMANY MARKET SHARE ANALYSIS BY END USER (2024)
FIGURE 162 FRANCE MARKET SHARE ANALYSIS BY TYPE (2024)
FIGURE 163 FRANCE MARKET SHARE ANALYSIS BY END USER (2024)
FIGURE 164 UK MARKET SHARE ANALYSIS BY TYPE (2024)
FIGURE 165 UK MARKET SHARE ANALYSIS BY END USER (2024)
FIGURE 166 SPAIN MARKET SHARE ANALYSIS BY TYPE (2024)
FIGURE 167 SPAIN MARKET SHARE ANALYSIS BY END USER (2024)
FIGURE 168 ITALY MARKET SHARE ANALYSIS BY TYPE (2024)
FIGURE 169 ITALY MARKET SHARE ANALYSIS BY END USER (2024)
FIGURE 170 BRAZIL MARKET SHARE ANALYSIS BY TYPE (2024)
FIGURE 171 BRAZIL MARKET SHARE ANALYSIS BY END USER (2024)
FIGURE 172 ARGENTINA MARKET SHARE ANALYSIS BY TYPE (2024)
FIGURE 173 ARGENTINA MARKET SHARE ANALYSIS BY END USER (2024)
FIGURE 174 COLUMBIA MARKET SHARE ANALYSIS BY TYPE (2024)
FIGURE 175 COLUMBIA MARKET SHARE ANALYSIS BY END USER (2024)
FIGURE 176 GLOBAL 3D PRINTING IN SUSTAINABLE HOUSING CURRENT AND FUTURE MARKET KEY COUNTRY LEVEL ANALYSIS, 2024–2034, (USD MILLION)
FIGURE 177 FINANCIAL OVERVIEW:
Key Players Analysis:
ICON Technology, Inc.: ICON is a pioneering company specializing in 3D-printed homes, focusing on affordability and sustainability. Their innovative construction technology aims to address housing shortages through rapid, cost-effective building solutions.
COBOD International A/S: COBOD designs and manufactures 3D construction printers, emphasizing modular and sustainable building solutions. They partner with various organizations to promote the adoption of 3D printing technology in the construction sector.
Apis Cor, Inc.: Apis Cor specializes in mobile 3D printing technology for construction. Their innovative approach allows for on-site printing of structures, significantly reducing labor and construction time while promoting sustainable practices.
Winsun Global: Winsun is a leader in 3D printing technology for construction, focusing on advanced materials and environmentally friendly processes. They have successfully completed various large-scale projects, showcasing their innovative capabilities.
Mighty Buildings, Inc.: Mighty Buildings utilizes 3D printing and robotic automation to create sustainable, customizable homes. Their focus on eco-friendly materials and energy-efficient designs positions them as a frontrunner in modern housing solutions.
XtreeE SAS: XtreeE specializes in large-scale 3D printing solutions for architecture and construction. They emphasize customization and sustainability, offering innovative approaches to building design that reduce waste and enhance efficiency.
Market Key Players
ICON Technology, Inc.
COBOD International A/S
Apis Cor, Inc.
Winsun Global
Mighty Buildings, Inc.
XtreeE SAS
CyBe Construction B.V.
Branch Technology, Inc.
SQ4D Inc.
Contour Crafting Corporation
Yingchuang Building Technique (Shanghai) Co., Ltd.
Cazza Construction Technologies
MudBots 3D Concrete Printing
Alquist 3D
Luyten 3D
Total Kustom
Sika AG
MX3D
Concreative
Black Buffalo 3D
WASP (World’s Advanced Saving Project)
LafargeHolcim (Holcim Group)
BatiPrint3D
Other Prominent Players
Driver:
Growing Emphasis on Sustainability
The growing emphasis on reducing carbon footprints and environmental impact is a key driver for 3D printing in sustainable housing. The technology saves material wastage, supports the ability to work with environmentally friendly, recycled, or biodegradable materials. In addition, 3D printing enables energy efficiency in buildings. The growing adoption of sustainability at governments and industries levels will highlight the need for 3D-printed housing constructed according to worldly environment standards and other green building projects.
Affordable Housing Demand
The vast deficit of affordable houses worldwide is driving acceptance of 3D printing technologies. Traditional construction is labor- and material-intensive with concomitant high costs, and it takes a much longer period of time to complete the projects. This leads to 3D printing being cost-effective in its application, cuts labor costs, accelerates the construction cycle, and requires less material for buildings. Therefore, 3D printing is a great solution for the provision of affordable, sustainable housing, especially for the very rapidly urbanizing regions of Asia-Pacific and Africa.
Technological Advancements
The rapid development of 3D printing technologies is enabling larger, more efficient printers capable of constructing entire homes. Other technological developments in materials especially include printable concrete, biodegradable plastics, and composites that open up possibilities for more sustainable housing. Additionally, improvements in software and design tools allow for more complex and customizable architectural designs. All these technologies are making 3D printing increasingly feasible for large-scale housing projects, thus affecting the development of the market.
Restrain:
Regulatory and Building Code Challenges
The lack of established building codes and regulations specifically tailored to 3D-printed housing is a major restraint. In most regions, strict construction standards and 3D-printed buildings often face regulatory problems related to safety, durability, and compliance. The slow adaptation of regulatory frameworks to provide support for new technologies results in delayed acceptance of this technology in the housing sector, which considerably constrains market growth in certain geographies.
High Initial Investment
The high capital costs associated with acquiring 3D printing equipment, materials, and technology infrastructure can act as a restraint, especially for small and medium-sized construction firms. Even though long-term benefits include cost savings, the up-front investment is a hindrance for companies with a reluctance toward new technologies. Additionally, training and skilled labour to operate the 3D printing systems, once more increasing up-front costs that limit the number of market entries.
Opportunities:
Government Initiatives and Green Building Policies
The increasing implementation of government policies promoting sustainable construction and energy efficiency provides a significant opportunity for 3D printing in housing. Many governments are are offering incentives towards green building projects by providing subsidies, grants, and tax benefits. These initiatives, combined with growing regulations around carbon emissions and sustainable development, form an ecosystem friendly to 3D-printed housing, allowing companies to play along with public goals while enhancing presence in the market.
Smart Cities Development
The global momentum toward development of smart cities presents an unprecedented opportunity for utilizing 3D printing in sustainable housing. Smart cities emphasize on the concepts of sustainability, digitalization, and innovative infrastructures, which 3D printing is ideal for meeting these demands. As cities increasingly adopt smart technologies, there is a growing need for sustainable and efficient housing that can be built quickly. This is an opportunity for 3D printing companies to collaborate with the governments and developers to provide infrastructure that is smart, green, and cost-effective for urban areas.
Trends:
Customization and Design Flexibility
An emerging feature of 3D printing innovation in the development of sustainable housing is the burgeoning need for personalization and flexibility in architectural designs. 3D printing supports designers in achieving highly detailed, custom structures designed to meet specific environmental or aesthetic requirements. However, developers and homeowners are finding such novel, eco-friendly designs attractive. The ability to customize housing with optimized material usage and design freedom also fits well with sustainability objectives, hence attracting 3D-printed housing across disparate industries.
Recent Development
In July 2024, Kazakhstan has its first ever 3D printed house in Central Asia courtesy of BM Partners, a company that claims to specialize in construction printing using three-dimensional (3D) technology. Situated in Almaty, considered to be the biggest urban center of the country by population density, this building falls into high-risk earthquake region according to the Richter scale.
In June 2023, Celaya Tequila, the premium, small-batch tequila brand founded by brothers Matt & Ryan Kalil, announced a charitable partnership with New Story, a non-profit organization whose goal is to end global homelessness. In this partnership, for each bottle sold, Celaya tequila contributes part of the money funding an affordable housing program in Jalisco Mexico, where houses are built through the help of 3D printing technology.