5G Infrastructure Market Size, Demand & Outlook | 40.2% CAGR
Global 5G Infrastructure Market Size, Share & Analysis By Component (Hardware, Services), By Spectrum (Sub-6 GHz, mmWave), By Network Architecture (Standalone, Non-standalone), By Vertical Industry (Manufacturing, Automotive and Transportation, Enterprise/Corporate, Energy & Utilities, Healthcare/Hospitals, Smart Cities, Others) Industry Dynamics, Rollout Strategies & Forecast 2025–2034
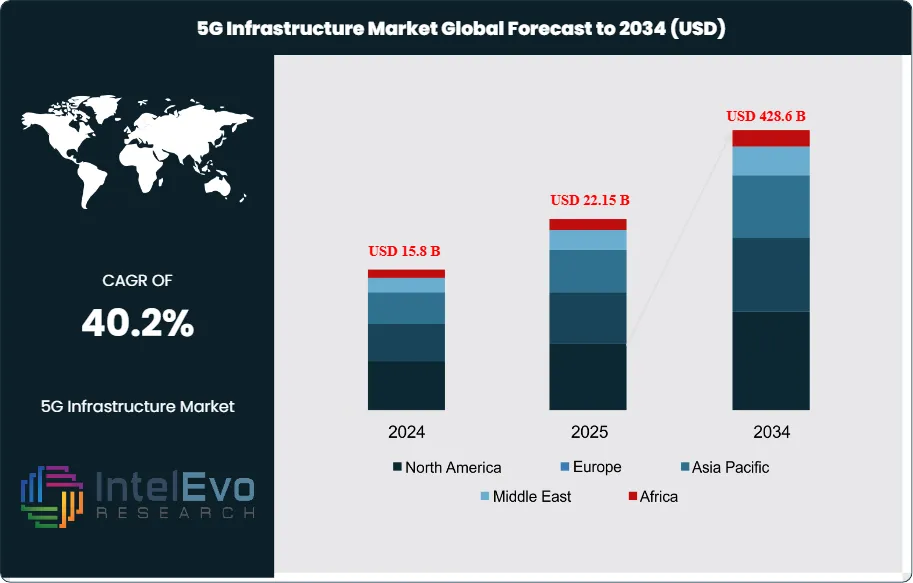
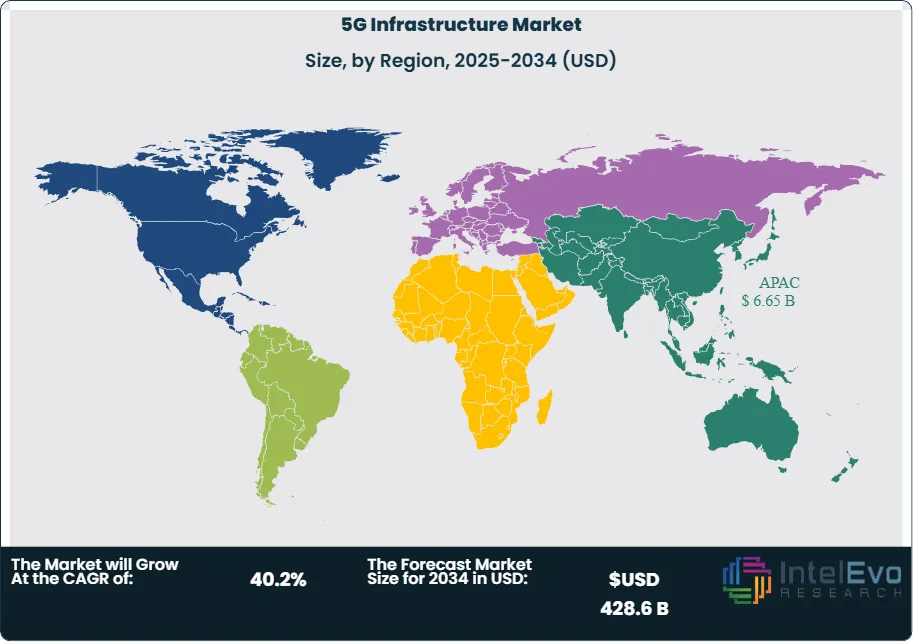
The 5G Infrastructure Market was valued at approximately USD 15.8 Billion in 2024 and is projected to reach nearly USD 428.6 Billion by 2034, growing at an estimated CAGR of around 40.2% from 2025 to 2034. The rapid surge in smart devices, autonomous mobility, and industrial automation is accelerating global 5G deployment. Massive MIMO, small cells, and edge computing are becoming core components of next-gen connectivity. With telecom operators and governments boosting large-scale network investments, 5G is entering a hyper-growth decade, reshaping digital economies worldwide.
Having moved beyond experimental deployments observed between 2019 and 2021, the sector has entered a new phase marked by broader implementation. Current investment patterns suggest a growing shift toward modern core network architectures, extensive fiber deployment, and the installation of compact, high-density cell sites.
Asia Pacific stood out in 2024 as the highest-earning region, contributing over 42% of the total market revenue. This dominance reflects robust government-led 5G initiatives and heavy infrastructure investment by telecom operators. Meanwhile, the North American and European markets are progressing steadily, focusing on mid-band frequency rollouts and advancing toward full standalone 5G network capabilities.
The explosive rise in mobile data usage has been a key force behind this growth. Monthly global data traffic reached around 130 exabytes in 2024 and is projected to triple by the end of the decade. Alongside this, the increasing presence of interconnected devices and industrial IoT systems is creating the need for networks that can guarantee minimal latency and exceptional reliability.
Commercial and enterprise applications are playing a pivotal role in shaping demand. The rollout of fixed wireless internet services for homes and businesses, alongside the rise of private 5G networks in manufacturing and logistics, is expanding the market’s reach. Additionally, industries like healthcare, automotive, and digital media are adopting 5G to support advanced, real-time operations. On the supply side, technological innovation is helping reduce deployment costs. Hardware improvements, like new radio technologies and enhanced chipsets, as well as the rise of virtual network solutions, are making 5G deployment more cost-effective and scalable.
Policymakers are also facilitating growth by accelerating spectrum licensing and simplifying approval processes for infrastructure installation. However, several challenges remain. Telecom providers must be cautious with capital expenditures, given the long return cycles. In urban areas, gaining approvals for installing compact cell stations is often slow and fragmented. On top of that, operators are dealing with rising operational costs, cybersecurity vulnerabilities, and a complex global supply chain that’s sensitive to political dynamics.
Emerging technologies are reshaping the way networks are built and operated. In congested city environments, smart antenna systems are increasing throughput, while the transition to standalone network cores is enabling advanced features like real-time network customization and low-latency communication for critical tasks. Edge computing is also gaining momentum, shifting processing tasks closer to end users to enhance performance. Meanwhile, open network standards and software-defined approaches are improving compatibility and speeding up deployment cycles, while fiber-based backhaul systems are enhancing end-to-end connectivity.
Regionally, Asia Pacific is expected to remain at the forefront of 5G expansion, due to government-backed digital initiatives and sector-wide modernization. North America is projected to accelerate its adoption of private and fixed wireless networks, especially in underserved areas. Europe is advancing gradually, with a strong emphasis on uniform regulatory practices and manufacturing use cases. The Middle East, on the other hand, is gaining global attention through its investment in digital infrastructure as part of new smart city developments.
Looking ahead, investment opportunities are likely to center on urban densification of network infrastructure, deployment of cloud-native core software, and establishment of localized edge data centers. Solutions focused on logistics, utilities, and automated manufacturing—especially those using private 5G networks—are also expected to be among the most attractive segments for investors and technology vendors alike.
Market Growth: The global 5G Infrastructure market will expand from USD 15.8 Billion in 2024 to USD 428.6 Billion by 2034 at a 40.2% CAGR (2025–2034), propelled by densification of radio access networks (RAN), fiberized backhaul, and migration to cloud-native cores.
Component: Hardware led in 2024 with 80.5% revenue share, reflecting intensive rollouts of antennas, small cells, and massive MIMO RAN; near term, spend remains capex-heavy while software/core and automation layers scale post-NSA stabilization.
Frequency Band: Sub-6 GHz accounted for 86.3% of deployments in 2024, favored for its coverage–capacity balance in urban/suburban grids; mmWave remains targeted to high-density venues and fixed wireless access where ultra-capacity justifies cost.
Deployment Architecture: Non-Standalone (NSA) captured 61% share in 2024 as operators leveraged 4G cores for speed-to-market; Standalone (SA) is set to accelerate with network slicing and URLLC use cases unlocking new service revenues.
Driver: Exploding data demand is stretching legacy networks—global monthly mobile data traffic reached ~130 EB in 2024 and is projected to triple to ~403 EB by 2029—pressing operators and enterprises to invest in high-capacity 5G RAN and core upgrades.
Restraint: Monetization lag and cost intensity weigh on returns—an 80.5% hardware mix and 61% NSA dependence skew spend to infrastructure while delaying SA-driven premium services, constraining near-term free cash flow and lengthening payback cycles.
Opportunity: Industrial private 5G—anchored by manufacturing (the top vertical at 23.8% share in 2024)—offers high-growth potential via robotics, machine vision, and digital twins; adjacent hotspots include logistics hubs, energy sites, and hospital campuses.
Trend: Open RAN, virtualized RAN, and AI/ML-driven automation are shifting value to software, improving spectral efficiency and operating economics; early SA rollouts are piloting network slicing SLAs for media uplink, mission-critical IoT, and edge analytics.
Regional Analysis: APAC led with 42.1% share (USD 5.7 billion) in 2024 on aggressive national programs and enterprise digitization; North America is scaling SA cores and FWA, Europe advances manufacturing-centric private 5G, and the Middle East/India emerge as investment hotspots via greenfield smart-city and industrial corridors.
Component Analysis
Hardware remains the economic backbone of 5G buildouts. In 2024, physical infrastructure (RAN, core, transport, small cells) captured ~80.5% of market revenue, reflecting intensive densification, fiberized backhaul/fronthaul, and massive-MIMO upgrades. Through 2025–2028, operators in APAC, North America, and parts of Europe are prioritizing mid-band overlays and small-cell grids to relieve traffic hot spots, sustaining a hardware-heavy mix even as unit costs fall.
That said, Services are set to outgrow the base, propelled by Standalone (SA) migrations, private 5G design–build–operate models, and lifecycle automation. Managed services, RAN optimization, and security will expand faster than total market CAGR as enterprises seek guaranteed SLAs for latency and reliability, while operators outsource operations to compress opex and accelerate time-to-value.
Spectrum Analysis
Sub-6 GHz is the workhorse of nationwide 5G. It accounted for ~86.3% of deployments in 2024 and will remain the coverage foundation through the decade due to favorable propagation, indoor penetration, and compatibility with refarmed LTE spectrum. Continuous improvements in beamforming and multi-band radios are lifting spectral efficiency, enabling operators to meet rising data loads without linear capex growth.
mmWave will scale more selectively where ultra-capacity economics pencil out—dense venues, fixed wireless access (FWA), industrial campuses, and transport hubs. As device ecosystems mature and integrated access/backhaul (IAB) reduces fiber dependence, mmWave contribution to new adds increases post-2026, particularly in North America, Japan, and the Gulf, though overall share remains secondary to Sub-6 for wide-area mobility.
Network Architecture Analysis
Non-standalone (NSA) dominated in 2024 (~61% share) by leveraging existing 4G cores for speed-to-market and capex efficiency. NSA will continue supporting enhanced mobile broadband and FWA where rapid capacity is paramount, especially in suburban footprints and emerging markets scaling first-phase 5G.
From 2025 onward, Standalone (SA) becomes the strategic pivot. SA cores unlock network slicing, ultra-reliable low-latency communications (URLLC), exposure APIs, and deterministic QoS required by mission-critical IoT. As slicing pilots move to commercial SLAs and enterprise edge nodes proliferate, SA’s share rises each year, despite transitional challenges (device readiness, integration complexity, and security hardening).
Vertical Analysis
Manufacturing leads enterprise demand (≈23.8% share in 2024) as factories deploy private 5G for robotics, machine vision, AGVs, and digital twins. Low jitter and high uplink performance reduce defects and downtime, while predictive maintenance and real-time quality analytics compress cycle times—key in autos, electronics, and process industries.
Automotive & Transportation, Energy & Utilities, and Healthcare are fast followers. Smart ports, rail yards, and airports are adopting 5G for asset tracking and safety systems; utilities are piloting field-area networks and substation automation; hospitals employ 5G for high-resolution imaging transfer and connected care. Smart-city programs—video analytics, V2X corridors, and public safety—create multi-tenant demand that benefits both public and private networks.
Regional Analysis
Asia Pacific remains the largest and most dynamic region (≈42.1% share; USD ~5.7 billion in 2024), underpinned by aggressive national programs and deep local supply chains. China’s expansive base-station footprint (well over three million sites by 2024) and India’s rapid mid-band rollout are catalysts for regional scale, while Japan and South Korea continue to push SA, edge, and enterprise private 5G use cases.
North America is a profitability-focused market, emphasizing SA core upgrades, mmWave/FWA capacity layers, and private-network partnerships for industrial campuses. Europe is accelerating spectrum harmonization and industry-centric private 5G—particularly in Germany, the Nordics, and the UK—balancing coverage goals with manufacturing digitalization. Latin America advances through staggered auctions and FWA economics in underserved areas, and the Middle East & Africa are emerging investment hotbeds, leveraging greenfield smart-city initiatives and industrial corridors to jump-start high-capacity 5G deployments post-2025.
By Component (Hardware, Services), By Spectrum (Sub-6 GHz, mmWave), By Network Architecture (Standalone, Non-standalone), By Vertical Industry (Manufacturing, Automotive and Transportation, Enterprise/Corporate, Energy & Utilities, Healthcare/Hospitals, Smart Cities, Others)
Research Methodology
Primary Research- 100 Interviews of Stakeholders
Secondary Research
Desk Research
Regional scope
North America (United States, Canada, Mexico)
Latin America (Brazil, Argentina, Columbia)
East Asia And Pacific (China, Japan, South Korea, Australia, Cambodia, Fiji, Indonesia)
Sea And South Asia (India, Singapore, Thailand, Taiwan, Malaysia)
Eastern Europe (Poland, Russia, Czech Republic, Romania)
Western Europe (Germany, U.K., France, Spain, Itlay)
Middle East & Africa (GCC Countries, Egypt, Nigeria, South Africa, Israel)
Competitive Landscape
CommScope Holding Company Inc., NEC Corporation, Huawei Technologies Co. Ltd, ZTE Corporation, Telefonaktiebolaget LM Ericsson, Qualcomm Technologies Inc., Cisco Systems Inc., Airspan Networks Inc., Nokia Corporation, Oracle Corporation, Hewlett Packard Enterprise Development LP, Mavenir Systems Inc., Samsung Electronics Co. Ltd, Qucell Networks Co. Ltd, Other Key Players
Customization Scope
Customization for segments, region/country-level will be provided. Moreover, additional customization can be done based on the requirements.
Pricing and Purchase Options
Avail customized purchase options to meet your exact research needs. We have three licenses to opt for: Single User License, Multi-User License (Up to 5 Users), Corporate Use License (Unlimited User and Printable PDF).
TABLE OF CONTENTS
1. EXECUTIVE SUMMARY
1.1. MARKET SNAPSHOT
1.2. KEY FINDINGS & INSIGHTS
1.3. ANALYST RECOMMENDATIONS
1.4. FUTURE OUTLOOK
2. RESEARCH METHODOLOGY
2.1. MARKET DEFINITION & SCOPE
2.2. RESEARCH OBJECTIVES: PRIMARY & SECONDARY DATA SOURCES
2.3. DATA COLLECTION SOURCES
2.3.1. COVERAGE OF 100+ PRIMARY RESEARCH/CONSULTATION CALLS WITH INDUSTRY STAKEHOLDERS
FIGURE 17 NORTH AMERICA 5G INFRASTRUCTURE CURRENT AND FUTURE TYPE ANALYSIS, 2025–2034, (USD MILLION)
FIGURE 18 NORTH AMERICA 5G INFRASTRUCTURE CURRENT AND FUTURE END USER ANALYSIS, 2025–2034, (USD MILLION)
FIGURE 19 MARKET SHARE BY COUNTRY
FIGURE 20 LATIN AMERICA 5G INFRASTRUCTURE CURRENT AND FUTURE TYPE ANALYSIS, 2025–2034, (USD MILLION)
FIGURE 21 LATIN AMERICA 5G INFRASTRUCTURE CURRENT AND FUTURE END USER ANALYSIS, 2025–2034, (USD MILLION)
FIGURE 22 MARKET SHARE BY COUNTRY
FIGURE 23 EASTERN EUROPE 5G INFRASTRUCTURE CURRENT AND FUTURE TYPE ANALYSIS, 2025–2034, (USD MILLION)
FIGURE 24 EASTERN EUROPE 5G INFRASTRUCTURE CURRENT AND FUTURE END USER ANALYSIS, 2025–2034, (USD MILLION)
FIGURE 25 MARKET SHARE BY COUNTRY
FIGURE 26 WESTERN EUROPE 5G INFRASTRUCTURE CURRENT AND FUTURE TYPE ANALYSIS, 2025–2034, (USD MILLION)
FIGURE 27 WESTERN EUROPE 5G INFRASTRUCTURE CURRENT AND FUTURE END USER ANALYSIS, 2025–2034, (USD MILLION)
FIGURE 28 MARKET SHARE BY COUNTRY
FIGURE 29 EAST ASIA AND PACIFIC 5G INFRASTRUCTURE CURRENT AND FUTURE TYPE ANALYSIS, 2025–2034, (USD MILLION)
FIGURE 30 EAST ASIA AND PACIFIC 5G INFRASTRUCTURE CURRENT AND FUTURE END USER ANALYSIS, 2025–2034, (USD MILLION)
FIGURE 31 MARKET SHARE BY COUNTRY
FIGURE 32 SEA AND SOUTH ASIA 5G INFRASTRUCTURE CURRENT AND FUTURE TYPE ANALYSIS, 2025–2034, (USD MILLION)
FIGURE 33 SEA AND SOUTH ASIA 5G INFRASTRUCTURE CURRENT AND FUTURE END USER ANALYSIS, 2025–2034, (USD MILLION)
FIGURE 34 MARKET SHARE BY COUNTRY
FIGURE 35 MIDDLE EAST AND AFRICA 5G INFRASTRUCTURE CURRENT AND FUTURE TYPE ANALYSIS, 2025–2034, (USD MILLION)
FIGURE 36 MIDDLE EAST AND AFRICA 5G INFRASTRUCTURE CURRENT AND FUTURE END USER ANALYSIS, 2025–2034, (USD MILLION)
FIGURE 37 NORTH AMERICA 5G INFRASTRUCTURE CURRENT AND FUTURE MARKET VOLUME SHARE REGIONAL ANALYSIS, 2025–2034, (USD MILLION)
FIGURE 38 U.S. 5G INFRASTRUCTURE CURRENT AND FUTURE TYPE ANALYSIS, 2025–2034, (USD MILLION)
FIGURE 39 U.S. 5G INFRASTRUCTURE CURRENT AND FUTURE END USER ANALYSIS, 2025–2034, (USD MILLION)
FIGURE 40 CANADA 5G INFRASTRUCTURE CURRENT AND FUTURE TYPE ANALYSIS, 2025–2034, (USD MILLION)
FIGURE 41 CANADA 5G INFRASTRUCTURE CURRENT AND FUTURE END USER ANALYSIS, 2025–2034, (USD MILLION)
FIGURE 42 LATIN AMERICA 5G INFRASTRUCTURE CURRENT AND FUTURE MARKET VOLUME SHARE REGIONAL ANALYSIS, 2025–2034, (USD MILLION)
FIGURE 43 MEXICO 5G INFRASTRUCTURE CURRENT AND FUTURE TYPE ANALYSIS, 2025–2034, (USD MILLION)
FIGURE 44 MEXICO 5G INFRASTRUCTURE CURRENT AND FUTURE END USER ANALYSIS, 2025–2034, (USD MILLION)
FIGURE 45 BRAZIL 5G INFRASTRUCTURE CURRENT AND FUTURE TYPE ANALYSIS, 2025–2034, (USD MILLION)
FIGURE 46 BRAZIL 5G INFRASTRUCTURE CURRENT AND FUTURE END USER ANALYSIS, 2025–2034, (USD MILLION)
FIGURE 47 ARGENTINA 5G INFRASTRUCTURE CURRENT AND FUTURE TYPE ANALYSIS, 2025–2034, (USD MILLION)
FIGURE 48 ARGENTINA 5G INFRASTRUCTURE CURRENT AND FUTURE END USER ANALYSIS, 2025–2034, (USD MILLION)
FIGURE 49 COLUMBIA 5G INFRASTRUCTURE CURRENT AND FUTURE TYPE ANALYSIS, 2025–2034, (USD MILLION)
FIGURE 50 COLUMBIA 5G INFRASTRUCTURE CURRENT AND FUTURE END USER ANALYSIS, 2025–2034, (USD MILLION)
FIGURE 51 REST OF LATIN AMERICA 5G INFRASTRUCTURE CURRENT AND FUTURE TYPE ANALYSIS, 2025–2034, (USD MILLION)
FIGURE 52 REST OF LATIN AMERICA 5G INFRASTRUCTURE CURRENT AND FUTURE END USER ANALYSIS, 2025–2034, (USD MILLION)
FIGURE 53 EASTERN EUROPE 5G INFRASTRUCTURE CURRENT AND FUTURE MARKET VOLUME SHARE REGIONAL ANALYSIS, 2025–2034, (USD MILLION)
FIGURE 54 POLAND 5G INFRASTRUCTURE CURRENT AND FUTURE TYPE ANALYSIS, 2025–2034, (USD MILLION)
FIGURE 55 POLAND 5G INFRASTRUCTURE CURRENT AND FUTURE END USER ANALYSIS, 2025–2034, (USD MILLION)
FIGURE 56 RUSSIA 5G INFRASTRUCTURE CURRENT AND FUTURE TYPE ANALYSIS, 2025–2034, (USD MILLION)
FIGURE 57 RUSSIA 5G INFRASTRUCTURE CURRENT AND FUTURE END USER ANALYSIS, 2025–2034, (USD MILLION)
FIGURE 58 CZECH REPUBLIC 5G INFRASTRUCTURE CURRENT AND FUTURE TYPE ANALYSIS, 2025–2034, (USD MILLION)
FIGURE 59 CZECH REPUBLIC 5G INFRASTRUCTURE CURRENT AND FUTURE END USER ANALYSIS, 2025–2034, (USD MILLION)
FIGURE 60 ROMANIA 5G INFRASTRUCTURE CURRENT AND FUTURE TYPE ANALYSIS, 2025–2034, (USD MILLION)
FIGURE 61 ROMANIA 5G INFRASTRUCTURE CURRENT AND FUTURE END USER ANALYSIS, 2025–2034, (USD MILLION)
FIGURE 62 REST OF EASTERN EUROPE 5G INFRASTRUCTURE CURRENT AND FUTURE TYPE ANALYSIS, 2025–2034, (USD MILLION)
FIGURE 63 REST OF EASTERN EUROPE 5G INFRASTRUCTURE CURRENT AND FUTURE END USER ANALYSIS, 2025–2034, (USD MILLION)
FIGURE 64 WESTERN EUROPE 5G INFRASTRUCTURE CURRENT AND FUTURE MARKET VOLUME SHARE REGIONAL ANALYSIS, 2025–2034, (USD MILLION)
FIGURE 65 GERMANY 5G INFRASTRUCTURE CURRENT AND FUTURE TYPE ANALYSIS, 2025–2034, (USD MILLION)
FIGURE 66 GERMANY 5G INFRASTRUCTURE CURRENT AND FUTURE END USER ANALYSIS, 2025–2034, (USD MILLION)
FIGURE 67 FRANCE 5G INFRASTRUCTURE CURRENT AND FUTURE TYPE ANALYSIS, 2025–2034, (USD MILLION)
FIGURE 68 FRANCE 5G INFRASTRUCTURE CURRENT AND FUTURE END USER ANALYSIS, 2025–2034, (USD MILLION)
FIGURE 69 UK 5G INFRASTRUCTURE CURRENT AND FUTURE TYPE ANALYSIS, 2025–2034, (USD MILLION)
FIGURE 70 UK 5G INFRASTRUCTURE CURRENT AND FUTURE END USER ANALYSIS, 2025–2034, (USD MILLION)
FIGURE 71 SPAIN 5G INFRASTRUCTURE CURRENT AND FUTURE TYPE ANALYSIS, 2025–2034, (USD MILLION)
FIGURE 72 SPAIN 5G INFRASTRUCTURE CURRENT AND FUTURE END USER ANALYSIS, 2025–2034, (USD MILLION)
FIGURE 73 ITALY 5G INFRASTRUCTURE CURRENT AND FUTURE TYPE ANALYSIS, 2025–2034, (USD MILLION)
FIGURE 74 ITALY 5G INFRASTRUCTURE CURRENT AND FUTURE END USER ANALYSIS, 2025–2034, (USD MILLION)
FIGURE 75 REST OF WESTERN EUROPE 5G INFRASTRUCTURE CURRENT AND FUTURE TYPE ANALYSIS, 2025–2034, (USD MILLION)
FIGURE 76 REST OF WESTERN EUROPE 5G INFRASTRUCTURE CURRENT AND FUTURE END USER ANALYSIS, 2025–2034, (USD MILLION)
FIGURE 77 EAST ASIA AND PACIFIC 5G INFRASTRUCTURE CURRENT AND FUTURE MARKET VOLUME SHARE REGIONAL ANALYSIS, 2025–2034, (USD MILLION)
FIGURE 78 CHINA 5G INFRASTRUCTURE CURRENT AND FUTURE TYPE ANALYSIS, 2025–2034, (USD MILLION)
FIGURE 79 CHINA 5G INFRASTRUCTURE CURRENT AND FUTURE END USER ANALYSIS, 2025–2034, (USD MILLION)
FIGURE 80 JAPAN 5G INFRASTRUCTURE CURRENT AND FUTURE TYPE ANALYSIS, 2025–2034, (USD MILLION)
FIGURE 81 JAPAN 5G INFRASTRUCTURE CURRENT AND FUTURE END USER ANALYSIS, 2025–2034, (USD MILLION)
FIGURE 82 AUSTRALIA 5G INFRASTRUCTURE CURRENT AND FUTURE TYPE ANALYSIS, 2025–2034, (USD MILLION)
FIGURE 83 AUSTRALIA 5G INFRASTRUCTURE CURRENT AND FUTURE END USER ANALYSIS, 2025–2034, (USD MILLION)
FIGURE 84 CAMBODIA 5G INFRASTRUCTURE CURRENT AND FUTURE TYPE ANALYSIS, 2025–2034, (USD MILLION)
FIGURE 85 CAMBODIA 5G INFRASTRUCTURE CURRENT AND FUTURE END USER ANALYSIS, 2025–2034, (USD MILLION)
FIGURE 86 FIJI 5G INFRASTRUCTURE CURRENT AND FUTURE TYPE ANALYSIS, 2025–2034, (USD MILLION)
FIGURE 87 FIJI 5G INFRASTRUCTURE CURRENT AND FUTURE END USER ANALYSIS, 2025–2034, (USD MILLION)
FIGURE 88 INDONESIA 5G INFRASTRUCTURE CURRENT AND FUTURE TYPE ANALYSIS, 2025–2034, (USD MILLION)
FIGURE 89 INDONESIA 5G INFRASTRUCTURE CURRENT AND FUTURE END USER ANALYSIS, 2025–2034, (USD MILLION)
FIGURE 90 SOUTH KOREA 5G INFRASTRUCTURE CURRENT AND FUTURE TYPE ANALYSIS, 2025–2034, (USD MILLION)
FIGURE 91 SOUTH KOREA 5G INFRASTRUCTURE CURRENT AND FUTURE END USER ANALYSIS, 2025–2034, (USD MILLION)
FIGURE 92 REST OF EAST ASIA AND PACIFIC 5G INFRASTRUCTURE CURRENT AND FUTURE TYPE ANALYSIS, 2025–2034, (USD MILLION)
FIGURE 93 REST OF EAST ASIA AND PACIFIC 5G INFRASTRUCTURE CURRENT AND FUTURE END USER ANALYSIS, 2025–2034, (USD MILLION)
FIGURE 94 SEA AND SOUTH ASIA 5G INFRASTRUCTURE CURRENT AND FUTURE MARKET VOLUME SHARE REGIONAL ANALYSIS, 2025–2034, (USD MILLION)
FIGURE 95 BANGLADESH 5G INFRASTRUCTURE CURRENT AND FUTURE TYPE ANALYSIS, 2025–2034, (USD MILLION)
FIGURE 96 BANGLADESH 5G INFRASTRUCTURE CURRENT AND FUTURE END USER ANALYSIS, 2025–2034, (USD MILLION)
FIGURE 97 NEW ZEALAND 5G INFRASTRUCTURE CURRENT AND FUTURE TYPE ANALYSIS, 2025–2034, (USD MILLION)
FIGURE 98 NEW ZEALAND 5G INFRASTRUCTURE CURRENT AND FUTURE END USER ANALYSIS, 2025–2034, (USD MILLION)
FIGURE 99 INDIA 5G INFRASTRUCTURE CURRENT AND FUTURE TYPE ANALYSIS, 2025–2034, (USD MILLION)
FIGURE 100 INDIA 5G INFRASTRUCTURE CURRENT AND FUTURE END USER ANALYSIS, 2025–2034, (USD MILLION)
FIGURE 101 SINGAPORE 5G INFRASTRUCTURE CURRENT AND FUTURE TYPE ANALYSIS, 2025–2034, (USD MILLION)
FIGURE 102 SINGAPORE 5G INFRASTRUCTURE CURRENT AND FUTURE END USER ANALYSIS, 2025–2034, (USD MILLION)
FIGURE 103 THAILAND 5G INFRASTRUCTURE CURRENT AND FUTURE TYPE ANALYSIS, 2025–2034, (USD MILLION)
FIGURE 104 THAILAND 5G INFRASTRUCTURE CURRENT AND FUTURE END USER ANALYSIS, 2025–2034, (USD MILLION)
FIGURE 105 TAIWAN 5G INFRASTRUCTURE CURRENT AND FUTURE TYPE ANALYSIS, 2025–2034, (USD MILLION)
FIGURE 106 TAIWAN 5G INFRASTRUCTURE CURRENT AND FUTURE END USER ANALYSIS, 2025–2034, (USD MILLION)
FIGURE 107 MALAYSIA 5G INFRASTRUCTURE CURRENT AND FUTURE TYPE ANALYSIS, 2025–2034, (USD MILLION)
FIGURE 108 MALAYSIA 5G INFRASTRUCTURE CURRENT AND FUTURE END USER ANALYSIS, 2025–2034, (USD MILLION)
FIGURE 109 REST OF SEA AND SOUTH ASIA 5G INFRASTRUCTURE CURRENT AND FUTURE TYPE ANALYSIS, 2025–2034, (USD MILLION)
FIGURE 110 REST OF SEA AND SOUTH ASIA 5G INFRASTRUCTURE CURRENT AND FUTURE END USER ANALYSIS, 2025–2034, (USD MILLION)
FIGURE 111 MIDDLE EAST AND AFRICA 5G INFRASTRUCTURE CURRENT AND FUTURE MARKET VOLUME SHARE REGIONAL ANALYSIS, 2025–2034, (USD MILLION)
FIGURE 112 GCC COUNTRIES 5G INFRASTRUCTURE CURRENT AND FUTURE TYPE ANALYSIS, 2025–2034, (USD MILLION)
FIGURE 113 GCC COUNTRIES 5G INFRASTRUCTURE CURRENT AND FUTURE END USER ANALYSIS, 2025–2034, (USD MILLION)
FIGURE 114 SAUDI ARABIA 5G INFRASTRUCTURE CURRENT AND FUTURE TYPE ANALYSIS, 2025–2034, (USD MILLION)
FIGURE 115 SAUDI ARABIA 5G INFRASTRUCTURE CURRENT AND FUTURE END USER ANALYSIS, 2025–2034, (USD MILLION)
FIGURE 116 UAE 5G INFRASTRUCTURE CURRENT AND FUTURE TYPE ANALYSIS, 2025–2034, (USD MILLION)
FIGURE 117 UAE 5G INFRASTRUCTURE CURRENT AND FUTURE END USER ANALYSIS, 2025–2034, (USD MILLION)
FIGURE 118 BAHRAIN 5G INFRASTRUCTURE CURRENT AND FUTURE TYPE ANALYSIS, 2025–2034, (USD MILLION)
FIGURE 119 BAHRAIN 5G INFRASTRUCTURE CURRENT AND FUTURE END USER ANALYSIS, 2025–2034, (USD MILLION)
FIGURE 120 KUWAIT 5G INFRASTRUCTURE CURRENT AND FUTURE TYPE ANALYSIS, 2025–2034, (USD MILLION)
FIGURE 121 KUWAIT 5G INFRASTRUCTURE CURRENT AND FUTURE END USER ANALYSIS, 2025–2034, (USD MILLION)
FIGURE 122 OMAN 5G INFRASTRUCTURE CURRENT AND FUTURE TYPE ANALYSIS, 2025–2034, (USD MILLION)
FIGURE 123 OMAN 5G INFRASTRUCTURE CURRENT AND FUTURE END USER ANALYSIS, 2025–2034, (USD MILLION)
FIGURE 124 QATAR 5G INFRASTRUCTURE CURRENT AND FUTURE TYPE ANALYSIS, 2025–2034, (USD MILLION)
FIGURE 125 QATAR 5G INFRASTRUCTURE CURRENT AND FUTURE END USER ANALYSIS, 2025–2034, (USD MILLION)
FIGURE 126 EGYPT 5G INFRASTRUCTURE CURRENT AND FUTURE TYPE ANALYSIS, 2025–2034, (USD MILLION)
FIGURE 127 EGYPT 5G INFRASTRUCTURE CURRENT AND FUTURE END USER ANALYSIS, 2025–2034, (USD MILLION)
FIGURE 128 NIGERIA 5G INFRASTRUCTURE CURRENT AND FUTURE TYPE ANALYSIS, 2025–2034, (USD MILLION)
FIGURE 129 NIGERIA 5G INFRASTRUCTURE CURRENT AND FUTURE END USER ANALYSIS, 2025–2034, (USD MILLION)
FIGURE 130 SOUTH AFRICA 5G INFRASTRUCTURE CURRENT AND FUTURE TYPE ANALYSIS, 2025–2034, (USD MILLION)
FIGURE 131 SOUTH AFRICA 5G INFRASTRUCTURE CURRENT AND FUTURE END USER ANALYSIS, 2025–2034, (USD MILLION)
FIGURE 132 ISRAEL 5G INFRASTRUCTURE CURRENT AND FUTURE TYPE ANALYSIS, 2025–2034, (USD MILLION)
FIGURE 133 ISRAEL 5G INFRASTRUCTURE CURRENT AND FUTURE END USER ANALYSIS, 2025–2034, (USD MILLION)
FIGURE 134 REST OF MEA 5G INFRASTRUCTURE CURRENT AND FUTURE TYPE ANALYSIS, 2025–2034, (USD MILLION)
FIGURE 135 REST OF MEA 5G INFRASTRUCTURE CURRENT AND FUTURE END USER ANALYSIS, 2025–2034, (USD MILLION)
FIGURE 136 U. S. MARKET SHARE ANALYSIS BY TYPE (2024)
FIGURE 137 U. S. MARKET SHARE ANALYSIS BY END USER (2024)
FIGURE 138 CANADA MARKET SHARE ANALYSIS BY TYPE (2024)
FIGURE 139 CANADA MARKET SHARE ANALYSIS BY END USER (2024)
FIGURE 140 MEXICO MARKET SHARE ANALYSIS BY TYPE (2024)
FIGURE 141 MEXICO MARKET SHARE ANALYSIS BY END USER (2024)
FIGURE 142 CHINA MARKET SHARE ANALYSIS BY TYPE (2024)
FIGURE 143 CHINA MARKET SHARE ANALYSIS BY END USER (2024)
FIGURE 144 JAPAN MARKET SHARE ANALYSIS BY TYPE (2024)
FIGURE 145 JAPAN MARKET SHARE ANALYSIS BY END USER (2024)
FIGURE 146 INDIA MARKET SHARE ANALYSIS BY TYPE (2024)
FIGURE 147 INDIA MARKET SHARE ANALYSIS BY END USER (2024)
FIGURE 148 SOUTH KOREA MARKET SHARE ANALYSIS BY TYPE (2024)
FIGURE 149 SOUTH KOREA MARKET SHARE ANALYSIS BY END USER (2024)
FIGURE 150 SAUDI ARABIA MARKET SHARE ANALYSIS BY TYPE (2024)
FIGURE 151 SAUDI ARABIA MARKET SHARE ANALYSIS BY END USER (2024)
FIGURE 152 UAE MARKET SHARE ANALYSIS BY TYPE (2024)
FIGURE 153 UAE MARKET SHARE ANALYSIS BY END USER (2024)
FIGURE 154 EGYPT MARKET SHARE ANALYSIS BY TYPE (2024)
FIGURE 155 EGYPT MARKET SHARE ANALYSIS BY END USER (2024)
FIGURE 156 NIGERIA MARKET SHARE ANALYSIS BY TYPE (2024)
FIGURE 157 NIGERIA MARKET SHARE ANALYSIS BY END USER (2024)
FIGURE 158 SOUTH AFRICA MARKET SHARE ANALYSIS BY TYPE (2024)
FIGURE 159 SOUTH AFRICA MARKET SHARE ANALYSIS BY END USER (2024)
FIGURE 160 GERMANY MARKET SHARE ANALYSIS BY TYPE (2024)
FIGURE 161 GERMANY MARKET SHARE ANALYSIS BY END USER (2024)
FIGURE 162 FRANCE MARKET SHARE ANALYSIS BY TYPE (2024)
FIGURE 163 FRANCE MARKET SHARE ANALYSIS BY END USER (2024)
FIGURE 164 UK MARKET SHARE ANALYSIS BY TYPE (2024)
FIGURE 165 UK MARKET SHARE ANALYSIS BY END USER (2024)
FIGURE 166 SPAIN MARKET SHARE ANALYSIS BY TYPE (2024)
FIGURE 167 SPAIN MARKET SHARE ANALYSIS BY END USER (2024)
FIGURE 168 ITALY MARKET SHARE ANALYSIS BY TYPE (2024)
FIGURE 169 ITALY MARKET SHARE ANALYSIS BY END USER (2024)
FIGURE 170 BRAZIL MARKET SHARE ANALYSIS BY TYPE (2024)
FIGURE 171 BRAZIL MARKET SHARE ANALYSIS BY END USER (2024)
FIGURE 172 ARGENTINA MARKET SHARE ANALYSIS BY TYPE (2024)
FIGURE 173 ARGENTINA MARKET SHARE ANALYSIS BY END USER (2024)
FIGURE 174 COLUMBIA MARKET SHARE ANALYSIS BY TYPE (2024)
FIGURE 175 COLUMBIA MARKET SHARE ANALYSIS BY END USER (2024)
FIGURE 176 GLOBAL 5G INFRASTRUCTURE CURRENT AND FUTURE MARKET KEY COUNTRY LEVEL ANALYSIS, 2024–2034, (USD MILLION)
FIGURE 177 FINANCIAL OVERVIEW:
Key Player Analysis
Cisco Systems Inc.: Leader–innovator. Cisco is extending its dominance in enterprise and service-provider networking into 5G via cloud-native mobility, observability, and security. The 2024 acquisition of Splunk sharpened Cisco’s value proposition in telco analytics and threat detection across 5G cores and edge domains, enabling cross-stack visibility for SLA assurance and monetization use cases. In 2025, Cisco also integrated Working Group Two’s cloud mobile core into its Mobility Services Platform—positioning as a full-stack private 5G and IoT connectivity provider—and secured roles in Standalone (SA) 5G programs such as Rakuten Mobile’s vendor lineup. Differentiators include a software-led stack spanning core, transport, and security, a mature global channel, and expanding API exposure for developers.
Hewlett Packard Enterprise Development LP: Challenger evolving to leader through portfolio scale-up. HPE closed its USD 14 billion acquisition of Juniper Networks in July 2025, effectively doubling its networking business and combining AI-native routing, orchestration, and campus/SD-WAN with HPE’s GreenLake consumption model and edge compute. Strategically, the move creates a vertically integrated alternative in AI and telco cloud, strengthening HPE’s competitive stance against incumbents in 5G transport and core adjacencies. On the enterprise cellular side, HPE’s earlier Athonet acquisition provides a carrier-grade private 5G core integrated with Aruba Wi-Fi, enabling “design-build-operate” offers for industrial campuses and venues—an attractive wedge into high-growth private 5G where 2025–2030 CAGRs are tracking in the mid-30s.
Mavenir Systems Inc.: Innovator/disruptor refocusing on software. In 2025, Mavenir streamlined its portfolio—exiting radio hardware, refinancing debt, and doubling down on cloud-native core, IMS, messaging, and monetization software—with bookings of roughly USD 650 million for the 12 months to Jan-2025 (+45% YoY). The company is introducing AI-driven automation across core and RAN integration, targeting energy savings and faster lifecycle operations for brownfield operators. The sharpened scope, improved balance sheet, and Open RAN expertise position Mavenir as a credible software partner for SA migrations and private networks, especially where operators are pursuing vendor diversification.
NEC Corporation: Innovator and systems integrator in Open RAN and advanced radio. NEC leverages strong radio engineering (massive-MIMO RUs) and integration capabilities, anchored by its OREX SAI joint venture with NTT DOCOMO to globalize Open RAN packages and services. This JV accelerates commercial deployments and reduces lock-in through multivendor blueprints. (In 2025, NEC, NTT, and DOCOMO also demonstrated distributed-MIMO performance in the 40 GHz band, underscoring NEC’s R&D depth in high-band 5G and pathfinding toward 5G-Advanced/6G use cases. Regional strength in Japan, growing footprints in Europe and ASEAN, and a balanced portfolio (radio, transport, and SI) differentiate NEC as operators scale SA and evaluate Open RAN at volume.
Market Key Players
CommScope Holding Company Inc.
NEC Corporation
Huawei Technologies Co. Ltd
ZTE Corporation
Telefonaktiebolaget LM Ericsson
Qualcomm Technologies Inc.
Cisco Systems Inc.
Airspan Networks Inc.
Nokia Corporation
Oracle Corporation
Hewlett Packard Enterprise Development LP
Mavenir Systems Inc.
Samsung Electronics Co. Ltd
Qucell Networks Co. Ltd
Other Key Players
Driver:
Massive 5G Capacity Expansion and Enterprise Adoption Driving Market Growth
As of 2025, 5G has moved from coverage to capacity, with operators densifying mid-band layers and scaling Standalone (SA) cores to meet surging traffic and enterprise demands. Global monthly mobile data is on track to roughly triple from ~130 EB in 2024 to ~400+ EB by 2029, while 5G subscriptions are crossing the ~2 billion mark in 2025 on the back of device affordability and wider SA availability. Fixed Wireless Access (FWA) now accounts for a sizable share of net broadband adds in several mature markets (>40% in some quarters), and private 5G pilots are converting to production in manufacturing, logistics, and energy. These forces collectively underpin a market CAGR in the high-30% range through 2034, sustaining investment in RAN densification, fiberized transport, and cloud-native core software.
Restraint:
High Capital Costs and Monetization Delays Constraining 5G Deployment
Capital intensity and monetization timing remain the principal brake on returns. Spectrum auctions, site acquisition, and small-cell grids elevate upfront spend, while many networks still run on Non-Standalone (NSA) architectures that limit premium monetization (e.g., slicing). Densification can increase site counts by 1.5–3× versus 4G footprints, and energy costs typically consume 15–20% of operator opex; without AI-driven power management and targeted build strategies, payback periods extend and free cash flow tightens. The strategic implication is a sharper focus on phased builds, active-passive sharing, and vendor diversification to compress total cost per bit and de-risk ROI.
Opportunity:
Enterprise Private 5G and Edge-Driven Applications Unlocking Major Opportunities
Enterprise and mission-critical wireless present the most attractive upside. Private 5G for industrial campuses, ports, and utilities is projected to grow at a 35–45% CAGR through 2030, potentially exceeding USD 15–20 billion in annual revenue by decade’s end as robotics, machine vision, and digital twins move to 24/7 operations. Adjacent profit pools—edge computing, verticalized applications, and managed SLAs—compound the opportunity: network slicing, uplink-optimized mid-band, and deterministic QoS enable new service tiers in healthcare (tele-diagnostics), automotive (V2X corridors), and media (remote production). Vendors and operators positioned with turnkey “design–build–operate” models and ecosystem partnerships (cloud/ISV/OEM) will disproportionately capture this spend.
Trend:
Shift Toward Open, Software-Centric 5G Networks Defining Industry Trends
Open, software-centric networks are reshaping competitive dynamics. SA 5G is accelerating in 2025, with dozens of operators launching commercial slicing and exposure APIs, while Open RAN and virtualized RAN gain double-digit share of new RAN capex post-2026 as performance parity improves. AI/ML is moving from trials to production across planning, SON, and RAN Intelligent Controller (RIC) apps, delivering 10–20% energy savings and measurable spectral-efficiency gains. Strategically, the stack is tilting toward software and integration: value migrates to cloud-native cores, orchestration, and edge platforms, favoring players that couple radio portfolios with automation software, neutral-host models, and developer ecosystems.
Recent Developments:
Dec 2024 – AT&T: Announced new Open RAN agreements with Fujitsu and Mavenir to supply open C-band and dual-band FDD radios for dense urban deployments, all orchestrated via Ericsson’s Intelligent Automation Platform (EIAP); AT&T reiterated its aim to move ~70% of 5G traffic onto open-capable platforms by late 2026. Strategic impact: accelerates multi-vendor interoperability and urban capacity growth while deepening AT&T’s Open RAN supply chain.
Jan 2025 – OREX SAI (NTT DOCOMO & NEC JV) / SURGE (Indonesia): Signed an MoU to deploy Open RAN-based 5G FWA targeting up to ~40 million Indonesian households, with planned service tiers priced around IDR 100,000 for ~100 Mbps and trials beginning in 2025. Strategic impact: positions Open RAN as a cost-disruptive last-mile alternative in one of APAC’s most underserved broadband markets.
Mar 2025 – OREX SAI & Hewlett Packard Enterprise: Entered a strategic partnership to integrate HPE Telco RAN Automation with OREX SMO, aiming for zero-touch lifecycle automation in multi-vendor Open RAN and citing up to ~60% deployment cost reduction; first commercial projects are targeted by year-end 2025. Strategic impact: pairs Open RAN blueprints with carrier-grade automation to compress time-to-value and total cost of ownership.
Mar 2025 – NTT / NTT DOCOMO / NEC: Demonstrated 40 GHz distributed-MIMO for high-speed mobility, maintaining ~100 Mbps downlink during antenna switching at ~100 km/h and cutting beam/antenna selection latency to ~¼ of conventional methods. Strategic impact: advances 5G-Advanced/early-6G radio performance for rail, automotive, and other high-throughput mobility scenarios.
Jul 2025 – Hewlett Packard Enterprise: Closed the USD 14 billion acquisition of Juniper Networks, doubling HPE’s networking scale; the combined portfolio (including Mist AIOps and Aruba/GreenLake) is positioned to contribute >50% of HPE’s operating income and expand into data-center, SP, and AI-networking adjacencies. Strategic impact: creates a scaled, AI-native challenger across enterprise and service-provider networking, relevant to 5G core/transport domains.
Jul 2025 – Mavenir: Completed a comprehensive recapitalization eliminating >USD 1.3 billion of debt and securing ~USD 300 million in new senior financing; the company will prioritize software-centric Open RAN and cloud-native core with accelerated AI investment. Strategic impact: strengthens balance sheet and sharpens focus on software, improving competitiveness in SA core, Open RAN integration, and private-network opportunities.