Global Agrochemicals Market to Reach USD 335.4 Bn by 2034 | 4.9% CAGR
Global Agrochemicals Market Size, Share & Analysis By Product Type (Fertilizers, Pesticides, Herbicides, Insecticides, Fungicides), By Crop Type (Cereals, Fruits & Vegetables, Oilseeds), By Application Method, By End-User (Commercial Farming, Smallholders) Industry Outlook, Regulatory Landscape, Innovation Trends & Forecast 2025–2034
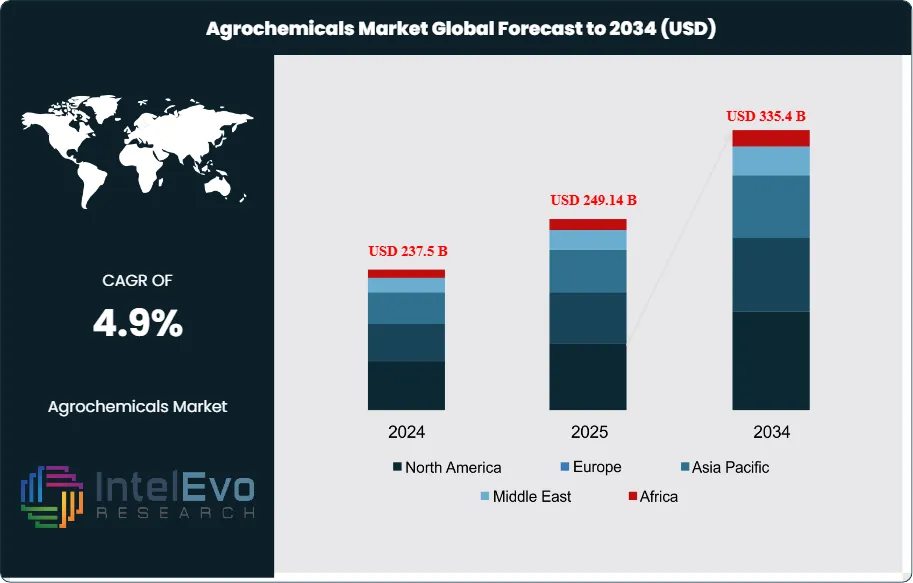
The Global Agrochemicals Market size is projected to reach approximately USD 335.4 billion by 2034, up from USD 237.5 billion in 2024, growing at a CAGR of 4.9% during the forecast period from 2025 to 2034. Rising global food demand, coupled with the need for sustainable crop protection solutions, is driving the growth of the agrochemicals market. Innovations in bio-based pesticides, herbicides, and fertilizers are enabling higher crop yields while minimizing environmental impact. Additionally, the integration of precision agriculture technologies and smart farming practices is accelerating the adoption of advanced agrochemical solutions globally, positioning the market for steady growth over the next decade.
The global agrochemical market refers to the industry focused on chemical and biological products used to enhance agricultural productivity and protect crops. These include pesticides (insecticides, herbicides, fungicides, and rodenticides), fertilizers (nitrogen, phosphatic, and potassic), plant growth regulators (PGRs), biopesticides, and soil conditioners. Agrochemicals play a vital role in modern farming by improving soil fertility, preventing pest infestations, and ensuring higher crop yields to meet the increasing global food demand. With the growing population and limited availability of arable land, the demand for agrochemicals continues to rise, supported by advancements in precision agriculture and sustainable farming practices.
The agrochemical market is influenced by regional agricultural trends, climate conditions, and government regulations, with Asia-Pacific, North America, and Europe leading the industry. Asia-Pacific dominates the global market, particularly in countries like China and India, where agriculture is a key sector. Population growth, government support for high-yield farming, and increasing use of fertilizers and pesticides drive market expansion in the region. North America follows closely, with the United States and Canada benefiting from advanced agricultural technologies, strong R&D investments, and a shift toward bio-based agrochemicals. In Europe, strict environmental regulations and a growing focus on organic farming are pushing the market toward sustainable solutions, such as biopesticides and eco-friendly fertilizers. Meanwhile, Latin America, particularly Brazil and Argentina, is witnessing significant agrochemical demand due to large-scale commercial farming and increased soy and grain production. Although the Middle East & Africa is still an emerging market, rising investments in modern farming techniques and soil fertility management are expected to drive future growth.
The COVID-19 pandemic had a notable impact on the global agrochemical market, disrupting supply chains, production, and distribution networks. Lockdowns and travel restrictions led to labor shortages, affecting agricultural operations and reducing demand for agrochemicals in some regions. However, since agriculture was classified as an essential sector, the industry rebounded relatively quickly compared to others. The pandemic also accelerated the adoption of digital farming and precision agriculture to optimize agrochemical use and ensure food security. Additionally, many governments emphasized self-sufficiency in food production, leading to increased support for local agriculture and boosting agrochemical sales. Despite initial setbacks, the market remains on a strong growth trajectory, driven by technological advancements, rising global food demand, and the shift toward sustainable agricultural solutions.
Key Takeaways:
Market Growth: The Global Agrochemicals Market is expected to reach USD 335.4 billion by 2034, growing at a robust CAGR of 4.9%, rising food demand, decreasing arable land, and advancements in sustainable agricultural practices.
Product Type: The market includes pesticides, fertilizers, plant growth regulators, biopesticides, and soil conditioners, with herbicides and nitrogen-based fertilizers dominating due to their essential role in crop productivity.
Form: Agrochemicals are available in liquid, granular, powder, and other forms, with liquid formulations preferred for ease of application and granular forms for slow nutrient release and soil conditioning.
Crop Type: Major application areas include cereals & grains, fruits & vegetables, oilseeds & pulses, and turf & ornamental plants, with cereals & grains leading due to their high global consumption.
Mode of Application: Agrochemicals are applied via foliar application, soil application, and seed treatment, with foliar spraying being the most effective for immediate absorption and protection.
Driver: Increasing global population, demand for high crop yields, and technological innovations in agrochemicals are key growth drivers, along with the rise of precision farming.
Restraint: Stringent environmental regulations, soil degradation concerns, and the push for organic farming pose challenges for synthetic agrochemical adoption.
Opportunity: The rise of bio-based agrochemicals, precision agriculture, and integrated pest management (IPM) presents lucrative opportunities for market growth.
Trend: Sustainable farming practices, AI-driven smart agriculture, and investment in eco-friendly agrochemicals are shaping the future of the industry.
Regional Analysis: Asia-Pacific leads the market, driven by agricultural expansion in China and India, followed by North America and Europe, where regulatory shifts favor sustainable solutions. Latin America is emerging as a key player due to large-scale farming in Brazil and Argentina.
By Product Type:
By product type, pesticides (insecticides, herbicides, fungicides, and rodenticides) dominate, with herbicides leading due to their widespread use in large-scale farming. Fertilizers are essential for soil fertility, with nitrogen-based fertilizers being the most widely used. Plant Growth Regulators (PGRs) like auxins and gibberellins support crop yield enhancement, while biopesticides are gaining traction as sustainable alternatives. Soil conditioners and adjuvants improve soil health and agrochemical efficiency.
By Form:
In terms of form, liquid formulations are preferred for their ease of application and rapid absorption, while granular fertilizers and pesticides offer long-term soil benefits. Powdered and other forms, such as gels and fumigants, are used for specialized agricultural needs.
By Crop Type:
Based on crop type, cereals and grains consume the highest volume of agrochemicals due to their global food demand, while fruits and vegetables rely heavily on fungicides and biopesticides. Oilseeds and pulses, such as soybeans and canola, require high herbicide and nitrogen fertilizer inputs, whereas turf and ornamental plants benefit from plant growth regulators and herbicides for landscaping and commercial horticulture.
By Mode of Application:
By mode of application, foliar spraying is widely used for quick absorption in high-value crops, while soil application remains crucial for long-term nutrient availability. Seed treatment is gaining popularity for its ability to protect against soil-borne pests and enhance germination, particularly in cereals and oilseeds. The market is shifting towards sustainable solutions, including biopesticides, controlled-release fertilizers, and precision agriculture, driven by growing food demand, regulatory changes, and the need for eco-friendly alternatives.
By Region Analysis:
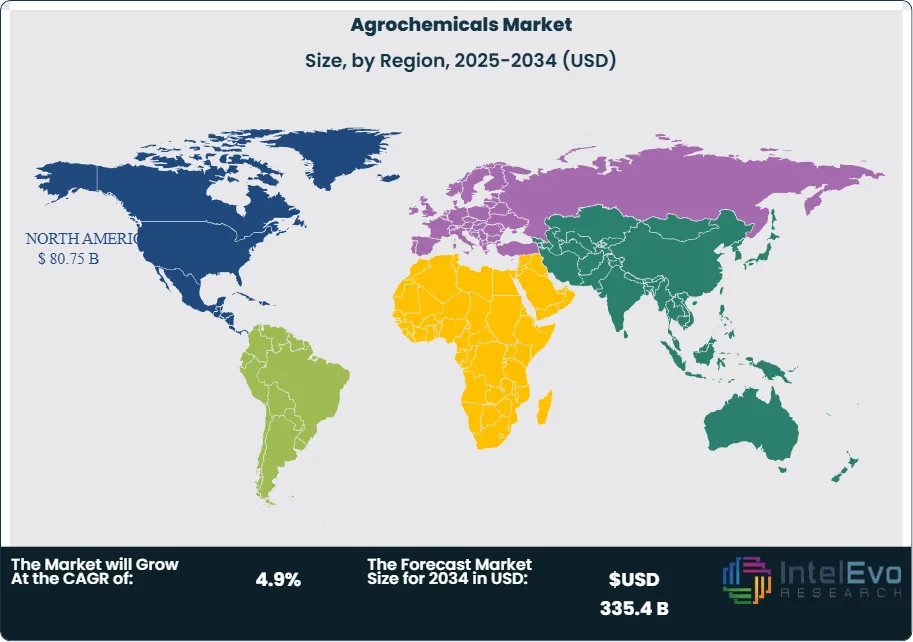
North America Leads With 34% Market Share in Agrochemical Market. North America is a mature yet evolving agrochemical market, driven by advanced agricultural practices, high adoption of technology, and stringent regulatory frameworks. The United States and Canada collectively account for a significant share of the global agrochemical industry, with large-scale farming operations that require high-efficiency crop protection solutions. The region primarily cultivates crops like corn, wheat, soybeans, and cotton, which demand extensive use of herbicides, fungicides, and insecticides. Europe represents one of the most stringently regulated agrochemical markets globally, with a strong emphasis on sustainability and environmental protection. The European Union (EU) has imposed strict guidelines on the usage of synthetic pesticides and fertilizers, pushing the industry towards the development of greener alternatives. The EU Farm to Fork Strategy, which aims to reduce chemical pesticide use by 50% by 2030, is a key factor shaping the agrochemical sector in the region.
The Asia-Pacific region is the fastest-growing agrochemical market, driven by rising food demand, expanding agricultural activities, and increasing adoption of modern farming practices. Countries such as China and India are among the largest consumers and producers of agrochemicals globally, with vast agricultural sectors that rely heavily on pesticides and fertilizers to meet the food requirements of their growing populations. The Middle East and Africa (MEA) represent emerging agrochemical markets, driven by the need for food security and the expansion of agricultural activities in arid and semi-arid regions. Countries such as South Africa, Egypt, and Nigeria are key markets for agrochemical companies, as they strive to increase agricultural productivity amid climate challenges.
By Product Type (Pesticides, (Insecticides, Herbicides, Fungicides, Rodenticides, Others), Fertilizers, (Nitrogen Fertilizers, Phosphatic Fertilizers, Potassic Fertilizers, Other Fertilizers), Plant Growth Regulators (PGRs), (Auxins, Gibberellins, Cytokinins, Ethylene), Biofertilizers & Biopesticides, Soil Conditioners and Other Agrochemicals, (Soil Conditioners, Adjuvants)), By Form (Liquid, Granular, Powder, Other Forms), By Crop Type (Cereals and Grains, Fruits and Vegetables, Oilseeds and Pulses, Turf and Ornamental Plants, Other Crops), By Mode of Application (Foliar Application, Soil Application, Seed Treatment), By End User (Commercial Agriculture, Horticulture & Specialty Farms, Greenhouses & Vertical Farming, Others)
Research Methodology
Primary Research- 100 Interviews of Stakeholders
Secondary Research
Desk Research
Regional scope
North America (United States, Canada, Mexico)
Latin America (Brazil, Argentina, Columbia)
East Asia And Pacific (China, Japan, South Korea, Australia, Cambodia, Fiji, Indonesia)
Sea And South Asia (India, Singapore, Thailand, Taiwan, Malaysia)
Eastern Europe (Poland, Russia, Czech Republic, Romania)
Western Europe (Germany, U.K., France, Spain, Itlay)
Middle East & Africa (GCC Countries, Egypt, Nigeria, South Africa, Israel)
Competitive Landscape
Corteva, Nufarm, Compass Minerals, Eurochem Group, K+S Aktiengesellschaft, Sociedad Química y Minera de Chile, BASF SE, Syngenta, UPL, ADAMA, Bayer AG, Sumitomo Chemical Co Ltd, Nutrien Ltd, YARA, Isagro S.p.A, ICL, Verdesian Life Sciences, OCP Group, Jiangsu Yangnong Chemical Co. Ltd, AGROLAC, Atticus LLC, Liben Crop Science Co Ltd, Valent U.S.A. LLC, Lier Chemical Co., Ltd, SIPCAM OXON
Customization Scope
Customization for segments, region/country-level will be provided. Moreover, additional customization can be done based on the requirements.
Pricing and Purchase Options
Avail customized purchase options to meet your exact research needs. We have three licenses to opt for: Single User License, Multi-User License (Up to 5 Users), Corporate Use License (Unlimited User and Printable PDF).
TABLE OF CONTENTS
1. EXECUTIVE SUMMARY
1.1. MARKET SNAPSHOT
1.2. KEY FINDINGS & INSIGHTS
1.3. ANALYST RECOMMENDATIONS
1.4. FUTURE OUTLOOK
2. RESEARCH METHODOLOGY
2.1. MARKET DEFINITION & SCOPE
2.2. RESEARCH OBJECTIVES: PRIMARY & SECONDARY DATA SOURCES
2.3. DATA COLLECTION SOURCES
2.3.1. COVERAGE OF 100+ PRIMARY RESEARCH/CONSULTATION CALLS WITH INDUSTRY STAKEHOLDERS
FIGURE 17 NORTH AMERICA AGROCHEMICALS CURRENT AND FUTURE TYPE ANALYSIS, 2025–2034, (USD MILLION)
FIGURE 18 NORTH AMERICA AGROCHEMICALS CURRENT AND FUTURE END USER ANALYSIS, 2025–2034, (USD MILLION)
FIGURE 19 MARKET SHARE BY COUNTRY
FIGURE 20 LATIN AMERICA AGROCHEMICALS CURRENT AND FUTURE TYPE ANALYSIS, 2025–2034, (USD MILLION)
FIGURE 21 LATIN AMERICA AGROCHEMICALS CURRENT AND FUTURE END USER ANALYSIS, 2025–2034, (USD MILLION)
FIGURE 22 MARKET SHARE BY COUNTRY
FIGURE 23 EASTERN EUROPE AGROCHEMICALS CURRENT AND FUTURE TYPE ANALYSIS, 2025–2034, (USD MILLION)
FIGURE 24 EASTERN EUROPE AGROCHEMICALS CURRENT AND FUTURE END USER ANALYSIS, 2025–2034, (USD MILLION)
FIGURE 25 MARKET SHARE BY COUNTRY
FIGURE 26 WESTERN EUROPE AGROCHEMICALS CURRENT AND FUTURE TYPE ANALYSIS, 2025–2034, (USD MILLION)
FIGURE 27 WESTERN EUROPE AGROCHEMICALS CURRENT AND FUTURE END USER ANALYSIS, 2025–2034, (USD MILLION)
FIGURE 28 MARKET SHARE BY COUNTRY
FIGURE 29 EAST ASIA AND PACIFIC AGROCHEMICALS CURRENT AND FUTURE TYPE ANALYSIS, 2025–2034, (USD MILLION)
FIGURE 30 EAST ASIA AND PACIFIC AGROCHEMICALS CURRENT AND FUTURE END USER ANALYSIS, 2025–2034, (USD MILLION)
FIGURE 31 MARKET SHARE BY COUNTRY
FIGURE 32 SEA AND SOUTH ASIA AGROCHEMICALS CURRENT AND FUTURE TYPE ANALYSIS, 2025–2034, (USD MILLION)
FIGURE 33 SEA AND SOUTH ASIA AGROCHEMICALS CURRENT AND FUTURE END USER ANALYSIS, 2025–2034, (USD MILLION)
FIGURE 34 MARKET SHARE BY COUNTRY
FIGURE 35 MIDDLE EAST AND AFRICA AGROCHEMICALS CURRENT AND FUTURE TYPE ANALYSIS, 2025–2034, (USD MILLION)
FIGURE 36 MIDDLE EAST AND AFRICA AGROCHEMICALS CURRENT AND FUTURE END USER ANALYSIS, 2025–2034, (USD MILLION)
FIGURE 37 NORTH AMERICA AGROCHEMICALS CURRENT AND FUTURE MARKET VOLUME SHARE REGIONAL ANALYSIS, 2025–2034, (USD MILLION)
FIGURE 38 U.S. AGROCHEMICALS CURRENT AND FUTURE TYPE ANALYSIS, 2025–2034, (USD MILLION)
FIGURE 39 U.S. AGROCHEMICALS CURRENT AND FUTURE END USER ANALYSIS, 2025–2034, (USD MILLION)
FIGURE 40 CANADA AGROCHEMICALS CURRENT AND FUTURE TYPE ANALYSIS, 2025–2034, (USD MILLION)
FIGURE 41 CANADA AGROCHEMICALS CURRENT AND FUTURE END USER ANALYSIS, 2025–2034, (USD MILLION)
FIGURE 42 LATIN AMERICA AGROCHEMICALS CURRENT AND FUTURE MARKET VOLUME SHARE REGIONAL ANALYSIS, 2025–2034, (USD MILLION)
FIGURE 43 MEXICO AGROCHEMICALS CURRENT AND FUTURE TYPE ANALYSIS, 2025–2034, (USD MILLION)
FIGURE 44 MEXICO AGROCHEMICALS CURRENT AND FUTURE END USER ANALYSIS, 2025–2034, (USD MILLION)
FIGURE 45 BRAZIL AGROCHEMICALS CURRENT AND FUTURE TYPE ANALYSIS, 2025–2034, (USD MILLION)
FIGURE 46 BRAZIL AGROCHEMICALS CURRENT AND FUTURE END USER ANALYSIS, 2025–2034, (USD MILLION)
FIGURE 47 ARGENTINA AGROCHEMICALS CURRENT AND FUTURE TYPE ANALYSIS, 2025–2034, (USD MILLION)
FIGURE 48 ARGENTINA AGROCHEMICALS CURRENT AND FUTURE END USER ANALYSIS, 2025–2034, (USD MILLION)
FIGURE 49 COLUMBIA AGROCHEMICALS CURRENT AND FUTURE TYPE ANALYSIS, 2025–2034, (USD MILLION)
FIGURE 50 COLUMBIA AGROCHEMICALS CURRENT AND FUTURE END USER ANALYSIS, 2025–2034, (USD MILLION)
FIGURE 51 REST OF LATIN AMERICA AGROCHEMICALS CURRENT AND FUTURE TYPE ANALYSIS, 2025–2034, (USD MILLION)
FIGURE 52 REST OF LATIN AMERICA AGROCHEMICALS CURRENT AND FUTURE END USER ANALYSIS, 2025–2034, (USD MILLION)
FIGURE 53 EASTERN EUROPE AGROCHEMICALS CURRENT AND FUTURE MARKET VOLUME SHARE REGIONAL ANALYSIS, 2025–2034, (USD MILLION)
FIGURE 54 POLAND AGROCHEMICALS CURRENT AND FUTURE TYPE ANALYSIS, 2025–2034, (USD MILLION)
FIGURE 55 POLAND AGROCHEMICALS CURRENT AND FUTURE END USER ANALYSIS, 2025–2034, (USD MILLION)
FIGURE 56 RUSSIA AGROCHEMICALS CURRENT AND FUTURE TYPE ANALYSIS, 2025–2034, (USD MILLION)
FIGURE 57 RUSSIA AGROCHEMICALS CURRENT AND FUTURE END USER ANALYSIS, 2025–2034, (USD MILLION)
FIGURE 58 CZECH REPUBLIC AGROCHEMICALS CURRENT AND FUTURE TYPE ANALYSIS, 2025–2034, (USD MILLION)
FIGURE 59 CZECH REPUBLIC AGROCHEMICALS CURRENT AND FUTURE END USER ANALYSIS, 2025–2034, (USD MILLION)
FIGURE 60 ROMANIA AGROCHEMICALS CURRENT AND FUTURE TYPE ANALYSIS, 2025–2034, (USD MILLION)
FIGURE 61 ROMANIA AGROCHEMICALS CURRENT AND FUTURE END USER ANALYSIS, 2025–2034, (USD MILLION)
FIGURE 62 REST OF EASTERN EUROPE AGROCHEMICALS CURRENT AND FUTURE TYPE ANALYSIS, 2025–2034, (USD MILLION)
FIGURE 63 REST OF EASTERN EUROPE AGROCHEMICALS CURRENT AND FUTURE END USER ANALYSIS, 2025–2034, (USD MILLION)
FIGURE 64 WESTERN EUROPE AGROCHEMICALS CURRENT AND FUTURE MARKET VOLUME SHARE REGIONAL ANALYSIS, 2025–2034, (USD MILLION)
FIGURE 65 GERMANY AGROCHEMICALS CURRENT AND FUTURE TYPE ANALYSIS, 2025–2034, (USD MILLION)
FIGURE 66 GERMANY AGROCHEMICALS CURRENT AND FUTURE END USER ANALYSIS, 2025–2034, (USD MILLION)
FIGURE 67 FRANCE AGROCHEMICALS CURRENT AND FUTURE TYPE ANALYSIS, 2025–2034, (USD MILLION)
FIGURE 68 FRANCE AGROCHEMICALS CURRENT AND FUTURE END USER ANALYSIS, 2025–2034, (USD MILLION)
FIGURE 69 UK AGROCHEMICALS CURRENT AND FUTURE TYPE ANALYSIS, 2025–2034, (USD MILLION)
FIGURE 70 UK AGROCHEMICALS CURRENT AND FUTURE END USER ANALYSIS, 2025–2034, (USD MILLION)
FIGURE 71 SPAIN AGROCHEMICALS CURRENT AND FUTURE TYPE ANALYSIS, 2025–2034, (USD MILLION)
FIGURE 72 SPAIN AGROCHEMICALS CURRENT AND FUTURE END USER ANALYSIS, 2025–2034, (USD MILLION)
FIGURE 73 ITALY AGROCHEMICALS CURRENT AND FUTURE TYPE ANALYSIS, 2025–2034, (USD MILLION)
FIGURE 74 ITALY AGROCHEMICALS CURRENT AND FUTURE END USER ANALYSIS, 2025–2034, (USD MILLION)
FIGURE 75 REST OF WESTERN EUROPE AGROCHEMICALS CURRENT AND FUTURE TYPE ANALYSIS, 2025–2034, (USD MILLION)
FIGURE 76 REST OF WESTERN EUROPE AGROCHEMICALS CURRENT AND FUTURE END USER ANALYSIS, 2025–2034, (USD MILLION)
FIGURE 77 EAST ASIA AND PACIFIC AGROCHEMICALS CURRENT AND FUTURE MARKET VOLUME SHARE REGIONAL ANALYSIS, 2025–2034, (USD MILLION)
FIGURE 78 CHINA AGROCHEMICALS CURRENT AND FUTURE TYPE ANALYSIS, 2025–2034, (USD MILLION)
FIGURE 79 CHINA AGROCHEMICALS CURRENT AND FUTURE END USER ANALYSIS, 2025–2034, (USD MILLION)
FIGURE 80 JAPAN AGROCHEMICALS CURRENT AND FUTURE TYPE ANALYSIS, 2025–2034, (USD MILLION)
FIGURE 81 JAPAN AGROCHEMICALS CURRENT AND FUTURE END USER ANALYSIS, 2025–2034, (USD MILLION)
FIGURE 82 AUSTRALIA AGROCHEMICALS CURRENT AND FUTURE TYPE ANALYSIS, 2025–2034, (USD MILLION)
FIGURE 83 AUSTRALIA AGROCHEMICALS CURRENT AND FUTURE END USER ANALYSIS, 2025–2034, (USD MILLION)
FIGURE 84 CAMBODIA AGROCHEMICALS CURRENT AND FUTURE TYPE ANALYSIS, 2025–2034, (USD MILLION)
FIGURE 85 CAMBODIA AGROCHEMICALS CURRENT AND FUTURE END USER ANALYSIS, 2025–2034, (USD MILLION)
FIGURE 86 FIJI AGROCHEMICALS CURRENT AND FUTURE TYPE ANALYSIS, 2025–2034, (USD MILLION)
FIGURE 87 FIJI AGROCHEMICALS CURRENT AND FUTURE END USER ANALYSIS, 2025–2034, (USD MILLION)
FIGURE 88 INDONESIA AGROCHEMICALS CURRENT AND FUTURE TYPE ANALYSIS, 2025–2034, (USD MILLION)
FIGURE 89 INDONESIA AGROCHEMICALS CURRENT AND FUTURE END USER ANALYSIS, 2025–2034, (USD MILLION)
FIGURE 90 SOUTH KOREA AGROCHEMICALS CURRENT AND FUTURE TYPE ANALYSIS, 2025–2034, (USD MILLION)
FIGURE 91 SOUTH KOREA AGROCHEMICALS CURRENT AND FUTURE END USER ANALYSIS, 2025–2034, (USD MILLION)
FIGURE 92 REST OF EAST ASIA AND PACIFIC AGROCHEMICALS CURRENT AND FUTURE TYPE ANALYSIS, 2025–2034, (USD MILLION)
FIGURE 93 REST OF EAST ASIA AND PACIFIC AGROCHEMICALS CURRENT AND FUTURE END USER ANALYSIS, 2025–2034, (USD MILLION)
FIGURE 94 SEA AND SOUTH ASIA AGROCHEMICALS CURRENT AND FUTURE MARKET VOLUME SHARE REGIONAL ANALYSIS, 2025–2034, (USD MILLION)
FIGURE 95 BANGLADESH AGROCHEMICALS CURRENT AND FUTURE TYPE ANALYSIS, 2025–2034, (USD MILLION)
FIGURE 96 BANGLADESH AGROCHEMICALS CURRENT AND FUTURE END USER ANALYSIS, 2025–2034, (USD MILLION)
FIGURE 97 NEW ZEALAND AGROCHEMICALS CURRENT AND FUTURE TYPE ANALYSIS, 2025–2034, (USD MILLION)
FIGURE 98 NEW ZEALAND AGROCHEMICALS CURRENT AND FUTURE END USER ANALYSIS, 2025–2034, (USD MILLION)
FIGURE 99 INDIA AGROCHEMICALS CURRENT AND FUTURE TYPE ANALYSIS, 2025–2034, (USD MILLION)
FIGURE 100 INDIA AGROCHEMICALS CURRENT AND FUTURE END USER ANALYSIS, 2025–2034, (USD MILLION)
FIGURE 101 SINGAPORE AGROCHEMICALS CURRENT AND FUTURE TYPE ANALYSIS, 2025–2034, (USD MILLION)
FIGURE 102 SINGAPORE AGROCHEMICALS CURRENT AND FUTURE END USER ANALYSIS, 2025–2034, (USD MILLION)
FIGURE 103 THAILAND AGROCHEMICALS CURRENT AND FUTURE TYPE ANALYSIS, 2025–2034, (USD MILLION)
FIGURE 104 THAILAND AGROCHEMICALS CURRENT AND FUTURE END USER ANALYSIS, 2025–2034, (USD MILLION)
FIGURE 105 TAIWAN AGROCHEMICALS CURRENT AND FUTURE TYPE ANALYSIS, 2025–2034, (USD MILLION)
FIGURE 106 TAIWAN AGROCHEMICALS CURRENT AND FUTURE END USER ANALYSIS, 2025–2034, (USD MILLION)
FIGURE 107 MALAYSIA AGROCHEMICALS CURRENT AND FUTURE TYPE ANALYSIS, 2025–2034, (USD MILLION)
FIGURE 108 MALAYSIA AGROCHEMICALS CURRENT AND FUTURE END USER ANALYSIS, 2025–2034, (USD MILLION)
FIGURE 109 REST OF SEA AND SOUTH ASIA AGROCHEMICALS CURRENT AND FUTURE TYPE ANALYSIS, 2025–2034, (USD MILLION)
FIGURE 110 REST OF SEA AND SOUTH ASIA AGROCHEMICALS CURRENT AND FUTURE END USER ANALYSIS, 2025–2034, (USD MILLION)
FIGURE 111 MIDDLE EAST AND AFRICA AGROCHEMICALS CURRENT AND FUTURE MARKET VOLUME SHARE REGIONAL ANALYSIS, 2025–2034, (USD MILLION)
FIGURE 112 GCC COUNTRIES AGROCHEMICALS CURRENT AND FUTURE TYPE ANALYSIS, 2025–2034, (USD MILLION)
FIGURE 113 GCC COUNTRIES AGROCHEMICALS CURRENT AND FUTURE END USER ANALYSIS, 2025–2034, (USD MILLION)
FIGURE 114 SAUDI ARABIA AGROCHEMICALS CURRENT AND FUTURE TYPE ANALYSIS, 2025–2034, (USD MILLION)
FIGURE 115 SAUDI ARABIA AGROCHEMICALS CURRENT AND FUTURE END USER ANALYSIS, 2025–2034, (USD MILLION)
FIGURE 116 UAE AGROCHEMICALS CURRENT AND FUTURE TYPE ANALYSIS, 2025–2034, (USD MILLION)
FIGURE 117 UAE AGROCHEMICALS CURRENT AND FUTURE END USER ANALYSIS, 2025–2034, (USD MILLION)
FIGURE 118 BAHRAIN AGROCHEMICALS CURRENT AND FUTURE TYPE ANALYSIS, 2025–2034, (USD MILLION)
FIGURE 119 BAHRAIN AGROCHEMICALS CURRENT AND FUTURE END USER ANALYSIS, 2025–2034, (USD MILLION)
FIGURE 120 KUWAIT AGROCHEMICALS CURRENT AND FUTURE TYPE ANALYSIS, 2025–2034, (USD MILLION)
FIGURE 121 KUWAIT AGROCHEMICALS CURRENT AND FUTURE END USER ANALYSIS, 2025–2034, (USD MILLION)
FIGURE 122 OMAN AGROCHEMICALS CURRENT AND FUTURE TYPE ANALYSIS, 2025–2034, (USD MILLION)
FIGURE 123 OMAN AGROCHEMICALS CURRENT AND FUTURE END USER ANALYSIS, 2025–2034, (USD MILLION)
FIGURE 124 QATAR AGROCHEMICALS CURRENT AND FUTURE TYPE ANALYSIS, 2025–2034, (USD MILLION)
FIGURE 125 QATAR AGROCHEMICALS CURRENT AND FUTURE END USER ANALYSIS, 2025–2034, (USD MILLION)
FIGURE 126 EGYPT AGROCHEMICALS CURRENT AND FUTURE TYPE ANALYSIS, 2025–2034, (USD MILLION)
FIGURE 127 EGYPT AGROCHEMICALS CURRENT AND FUTURE END USER ANALYSIS, 2025–2034, (USD MILLION)
FIGURE 128 NIGERIA AGROCHEMICALS CURRENT AND FUTURE TYPE ANALYSIS, 2025–2034, (USD MILLION)
FIGURE 129 NIGERIA AGROCHEMICALS CURRENT AND FUTURE END USER ANALYSIS, 2025–2034, (USD MILLION)
FIGURE 130 SOUTH AFRICA AGROCHEMICALS CURRENT AND FUTURE TYPE ANALYSIS, 2025–2034, (USD MILLION)
FIGURE 131 SOUTH AFRICA AGROCHEMICALS CURRENT AND FUTURE END USER ANALYSIS, 2025–2034, (USD MILLION)
FIGURE 132 ISRAEL AGROCHEMICALS CURRENT AND FUTURE TYPE ANALYSIS, 2025–2034, (USD MILLION)
FIGURE 133 ISRAEL AGROCHEMICALS CURRENT AND FUTURE END USER ANALYSIS, 2025–2034, (USD MILLION)
FIGURE 134 REST OF MEA AGROCHEMICALS CURRENT AND FUTURE TYPE ANALYSIS, 2025–2034, (USD MILLION)
FIGURE 135 REST OF MEA AGROCHEMICALS CURRENT AND FUTURE END USER ANALYSIS, 2025–2034, (USD MILLION)
FIGURE 136 U. S. MARKET SHARE ANALYSIS BY TYPE (2024)
FIGURE 137 U. S. MARKET SHARE ANALYSIS BY END USER (2024)
FIGURE 138 CANADA MARKET SHARE ANALYSIS BY TYPE (2024)
FIGURE 139 CANADA MARKET SHARE ANALYSIS BY END USER (2024)
FIGURE 140 MEXICO MARKET SHARE ANALYSIS BY TYPE (2024)
FIGURE 141 MEXICO MARKET SHARE ANALYSIS BY END USER (2024)
FIGURE 142 CHINA MARKET SHARE ANALYSIS BY TYPE (2024)
FIGURE 143 CHINA MARKET SHARE ANALYSIS BY END USER (2024)
FIGURE 144 JAPAN MARKET SHARE ANALYSIS BY TYPE (2024)
FIGURE 145 JAPAN MARKET SHARE ANALYSIS BY END USER (2024)
FIGURE 146 INDIA MARKET SHARE ANALYSIS BY TYPE (2024)
FIGURE 147 INDIA MARKET SHARE ANALYSIS BY END USER (2024)
FIGURE 148 SOUTH KOREA MARKET SHARE ANALYSIS BY TYPE (2024)
FIGURE 149 SOUTH KOREA MARKET SHARE ANALYSIS BY END USER (2024)
FIGURE 150 SAUDI ARABIA MARKET SHARE ANALYSIS BY TYPE (2024)
FIGURE 151 SAUDI ARABIA MARKET SHARE ANALYSIS BY END USER (2024)
FIGURE 152 UAE MARKET SHARE ANALYSIS BY TYPE (2024)
FIGURE 153 UAE MARKET SHARE ANALYSIS BY END USER (2024)
FIGURE 154 EGYPT MARKET SHARE ANALYSIS BY TYPE (2024)
FIGURE 155 EGYPT MARKET SHARE ANALYSIS BY END USER (2024)
FIGURE 156 NIGERIA MARKET SHARE ANALYSIS BY TYPE (2024)
FIGURE 157 NIGERIA MARKET SHARE ANALYSIS BY END USER (2024)
FIGURE 158 SOUTH AFRICA MARKET SHARE ANALYSIS BY TYPE (2024)
FIGURE 159 SOUTH AFRICA MARKET SHARE ANALYSIS BY END USER (2024)
FIGURE 160 GERMANY MARKET SHARE ANALYSIS BY TYPE (2024)
FIGURE 161 GERMANY MARKET SHARE ANALYSIS BY END USER (2024)
FIGURE 162 FRANCE MARKET SHARE ANALYSIS BY TYPE (2024)
FIGURE 163 FRANCE MARKET SHARE ANALYSIS BY END USER (2024)
FIGURE 164 UK MARKET SHARE ANALYSIS BY TYPE (2024)
FIGURE 165 UK MARKET SHARE ANALYSIS BY END USER (2024)
FIGURE 166 SPAIN MARKET SHARE ANALYSIS BY TYPE (2024)
FIGURE 167 SPAIN MARKET SHARE ANALYSIS BY END USER (2024)
FIGURE 168 ITALY MARKET SHARE ANALYSIS BY TYPE (2024)
FIGURE 169 ITALY MARKET SHARE ANALYSIS BY END USER (2024)
FIGURE 170 BRAZIL MARKET SHARE ANALYSIS BY TYPE (2024)
FIGURE 171 BRAZIL MARKET SHARE ANALYSIS BY END USER (2024)
FIGURE 172 ARGENTINA MARKET SHARE ANALYSIS BY TYPE (2024)
FIGURE 173 ARGENTINA MARKET SHARE ANALYSIS BY END USER (2024)
FIGURE 174 COLUMBIA MARKET SHARE ANALYSIS BY TYPE (2024)
FIGURE 175 COLUMBIA MARKET SHARE ANALYSIS BY END USER (2024)
FIGURE 176 GLOBAL AGROCHEMICALS CURRENT AND FUTURE MARKET KEY COUNTRY LEVEL ANALYSIS, 2024–2034, (USD MILLION)
FIGURE 177 FINANCIAL OVERVIEW:
Key Players Analysis:
Corteva Agriscience (U.S.) - A leader in agricultural products, Corteva focuses on seeds, crop protection, and digital agriculture solutions. It emerged from the merger of Dow AgroSciences and DuPont’s agricultural division, making it one of the most prominent players in the industry. Strong in both crop protection and seed technology. Known for innovation and sustainability in agricultural practices.
Nufarm (Australia) - Nufarm is a major producer of crop protection solutions, particularly herbicides, fungicides, and insecticides, with a significant global presence. Focuses on high-quality formulations and providing solutions to the agricultural community worldwide.
Compass Minerals (U.S.) - Primarily known for producing salt, Compass Minerals also supplies essential plant nutrition products such as potash and fertilizers, contributing to agricultural solutions. Strong supply chain in plant nutrition and fertilizers.
Eurochem Group (Switzerland) - Eurochem is a global leader in the production of fertilizers, with an integrated approach to the agriculture industry, from fertilizer production to distribution. Highly involved in the fertilizer market, with a growing presence in plant protection.
K+S Aktiengesellschaft (Germany) - A major German chemical company, K+S is one of the largest global producers of potassium and other essential nutrients used in fertilizers. A key player in the global fertilizer market, focusing on long-term sustainability and plant nutrition.
Sociedad Química y Minera de Chile (Chile) - Known for its role in the global market for plant nutrients, SQM is a leader in producing lithium and potassium nitrate, both important to the agriculture industry. Dominant in the supply of specialized fertilizers, particularly potassium nitrate.
BASF SE (Germany) - BASF is one of the largest global agrochemical companies, providing a wide range of crop protection products, including herbicides, fungicides, and insecticides. Strong research and development capabilities, as well as a broad portfolio of agricultural solutions.
Syngenta (Switzerland) - A leading multinational agrochemical company, Syngenta offers crop protection products and seeds, with a growing focus on sustainable agricultural solutions. Strong product portfolio in crop protection and seeds, plus a commitment to sustainability and digital agriculture.
UPL (India) - UPL is a global agrochemical player focusing on crop protection, seeds, and fertilizers. It has grown rapidly through acquisitions and a diversified portfolio. A significant player in emerging markets, with a strong global distribution network.
ADAMA (Israel) - ADAMA provides a wide range of crop protection products, focusing on offering farmers simple, effective solutions. Known for its broad product offerings and a strong presence in emerging markets.
Bayer AG (Germany) - Bayer is one of the largest global agrochemical companies, having acquired Monsanto in 2018. It offers a comprehensive range of products including herbicides, fungicides, and insecticides. Strong research, innovation, and leadership in digital agriculture and biotechnology.
Sumitomo Chemical Co., Ltd. (Japan) - Sumitomo Chemical provides a range of agricultural chemicals, including pesticides and fungicides, focusing on global expansion. Focus on chemical innovation with sustainable solutions.
Nutrien Ltd. (Canada) - One of the world’s largest suppliers of agricultural products, Nutrien is heavily involved in the fertilizer market and provides a wide range of crop protection products. Strong capabilities in both crop protection and fertilizer production.
YARA (Norway) - A leader in crop nutrition, YARA focuses on producing fertilizers and solutions for improving crop yields and sustainability. Leading the global fertilizer industry and focused on innovative crop nutrition solutions.
Isagro S.p.A (Italy) - Isagro is an agrochemical company that specializes in crop protection products, focusing on environmental sustainability and providing tailored solutions. Known for effective, high-performance products and research in environmentally-friendly agriculture.
ICL (Israel) - ICL is a global leader in fertilizers, specialty minerals, and agricultural chemicals, offering innovative solutions to enhance crop production. Strong focus on sustainable agriculture and innovative fertilizers.
Market Key Players
Corteva (US)
Nufarm (Australia)
Compass Minerals (US)
Eurochem Group (Switzerland)
K+S Aktiengesellschaft (Germany)
Sociedad Química y Minera de Chile (Chile)
BASF SE (Germany)
Syngenta (Switzerland)
UPL (India)
ADAMA (Israel)
Bayer AG (Germany)
Sumitomo Chemical Co., Ltd. (Japan)
Nutrien Ltd. (Canada)
YARA (Norway)
Isagro S.p.A (Italy)
ICL (Israel)
Verdesian Life Sciences (US)
OCP Group (Casablanca)
Jiangsu Yangnong Chemical Co., Ltd. (China)
AGROLAC (Spain)
Atticus, LLC (US)
Liben Crop Science Co., Ltd. (China)
Valent U.S.A. LLC (US)
Lier Chemical Co., Ltd. (China)
SIPCAM OXON (Itlay)
Driver:
Growing Global Population and Food Demand
The world’s population is projected to reach 9.7 billion by 2050, and this growing population creates an increased demand for food. To meet this demand, agricultural productivity must increase significantly, which directly boosts the demand for agrochemical products like fertilizers, pesticides, and herbicides to protect crops and increase yield. The rising need for food production drives the adoption of advanced agrochemical solutions for improving crop protection, growth rates, and overall yield.
Advancements in Agricultural Technology
Technology is revolutionizing the agrochemical industry. Innovations such as precision farming, bio-based pesticides, smart irrigation systems, and drones for crop monitoring are enhancing the efficiency of agrochemicals. Digital platforms enable farmers to precisely apply pesticides, reducing waste and increasing productivity. As new technologies emerge, agrochemical companies can offer more effective, efficient, and sustainable products, boosting market growth.
Sustainability and Regulatory Support
Governments and international organizations are encouraging sustainable farming practices through regulations and incentives for eco-friendly products. Agrochemical companies are increasingly developing products that reduce environmental impact, such as low-toxicity pesticides and organic fertilizers. The growing focus on sustainability is driving demand for environmentally friendly agrochemical solutions, fostering market growth.
Restraints:
Environmental and Health Concerns
The use of chemical pesticides and fertilizers has raised concerns about their impact on the environment, including soil degradation, water pollution, and loss of biodiversity. Additionally, there are growing health concerns related to pesticide residues in food, leading to increasing regulatory scrutiny in various regions. Stringent environmental regulations and health-conscious consumer behavior may reduce the demand for traditional agrochemicals, especially those with long-lasting environmental effects.
Regulatory Hurdles and Bans
Regulatory bodies like the European Union (EU) and the U.S. Environmental Protection Agency (EPA) are increasingly tightening the approval process for agrochemicals. The banning of chemicals like neonicotinoids (insecticides) and glyphosate (herbicide) in several countries is restricting the market for certain agrochemicals. Stringent regulations and chemical bans limit the availability of certain agrochemicals in some regions, hindering market growth.
Opportunities:
Biopesticides and Biologics
Biopesticides, which are derived from natural materials like plants, bacteria, and minerals, are gaining traction due to their eco-friendly nature. With increasing consumer demand for organic food, there is growing potential for biopesticides in agriculture. Biologics, such as beneficial fungi, bacteria, and plant extracts, also present an opportunity for crop protection. The shift towards biopesticides and biologics presents a lucrative opportunity for agrochemical companies to innovate and cater to the growing demand for sustainable and non-toxic crop protection solutions.
Digital Farming and Precision Agriculture
The integration of digital farming technologies, such as data analytics, artificial intelligence (AI), and machine learning, with agrochemical products allows for more precise application and tailored solutions. Precision agriculture ensures the optimal use of pesticides, fertilizers, and water, reducing costs and environmental impact. The growing use of digital tools in farming presents an opportunity for agrochemical companies to enhance their product offerings and develop more efficient, data-driven solutions for farmers.
Threats:
Price Sensitivity and Competition from Generic Products
Farmers, especially in price-sensitive markets, are increasingly turning to cheaper generic agrochemicals, which threaten the market share of major global players. These generic alternatives often come at a fraction of the cost, making them attractive despite potential risks related to product performance or reliability. Increased competition from low-cost generics could pressure pricing and margins for established agrochemical firms, especially in price-sensitive regions like parts of Asia and Africa.
Recent Development:
November 2024: U.S. farmers, grappling with financial constraints, are increasingly opting for more affordable generic pesticides and fungicides as they prepare for the upcoming planting season. This shift presents significant challenges for major agrochemical companies such as Bayer, Syngenta, Corteva, and BASF, which could face a reduction in market share and revenue. While generic alternatives offer cost benefits, they often lack certain guarantees, like respray cost coverage, which could lead to financial risks if the product's performance falls short.
December 2024: In Brazil, growing concerns have emerged over pesticide poisoning incidents linked to Reglone, a herbicide containing diquat produced by Syngenta in the UK for export to countries with less stringent regulatory frameworks. Despite being banned in the UK and EU due to its health and environmental dangers, the continued export and use of diquat in countries like Brazil have sparked renewed debates on the ethics of such trade practices and the need for stricter global regulatory oversight.

 Aerospace And Defence
 Agriculture
 Automotive And Transportation
 Banking And Finance
 Business
 Chemicals And Materials
 Consumer And Retail
 Electronics And Semiconductors
 Food And Beverages
 Machinery & Equipments
 Manufacturing And Construction
 Medical Devices
 Others
 Pharmaceuticals And Healthcare
 Power And Energy
 Sports
 Technology

, By Crop Type (Cereals, Fruits & Vegetables, Oilseeds), By Application Method, By End-User (Commercial Farming, Smallholders) Industry Outlook, Regulatory Landscape, Innovation Trends & Forecast 2025–2034")
, By Crop Type (Cereals, Fruits & Vegetables, Oilseeds), By Application Method, By End-User (Commercial Farming, Smallholders) Industry Outlook, Regulatory Landscape, Innovation Trends & Forecast 2025–2034")
, By Crop Type (Cereals, Fruits & Vegetables, Oilseeds), By Application Method, By End-User (Commercial Farming, Smallholders) Industry Outlook, Regulatory Landscape, Innovation Trends & Forecast 2025–2034")
, By Crop Type (Cereals, Fruits & Vegetables, Oilseeds), By Application Method, By End-User (Commercial Farming, Smallholders) Industry Outlook, Regulatory Landscape, Innovation Trends & Forecast 2025–2034")

