
- Home
- Industries
 Aerospace And Defence
 Agriculture
 Automotive And Transportation
 Banking And Finance
 Business
 Chemicals And Materials
 Consumer And Retail
 Electronics And Semiconductors
 Food And Beverages
 Machinery & Equipments
 Manufacturing And Construction
 Medical Devices
 Others
 Pharmaceuticals And Healthcare
 Power And Energy
 Sports
 Technology
- Services
- News Room
- About us
- Contact Us
-
AI and RAN Traffic Optimization Market Size, Growth | CAGR 30.8%
Global AI and RAN Traffic Optimization Market Size, Share & Telecom Analytics Analysis By Solution (Traffic Prediction, Load Balancing, Energy Optimization), By Network Type (4G, 5G, Open RAN), By End User (Telecom Operators, Enterprises), AI-Native RAN Trends, Key Vendors & Forecast 2025–2034

Report Overview
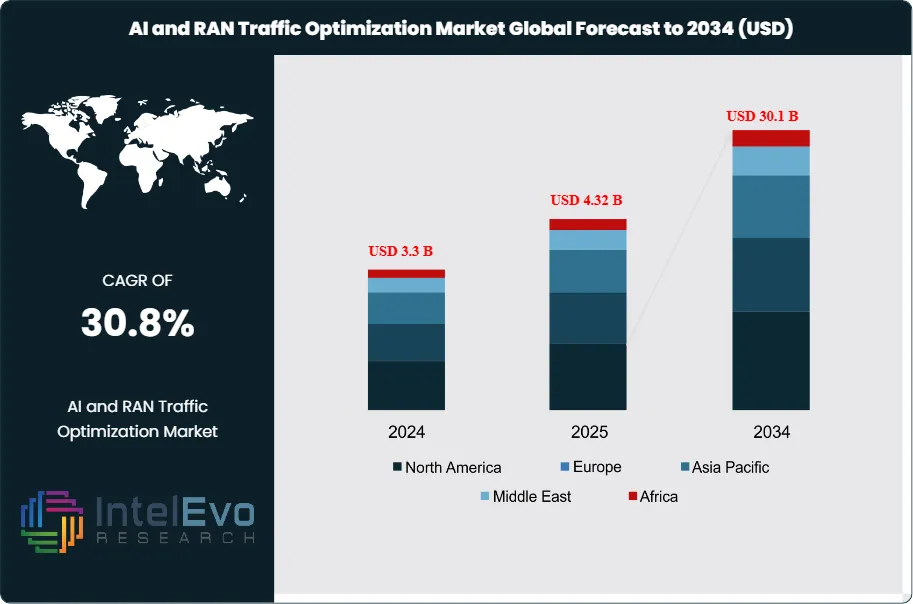
The AI and RAN Traffic Optimization Market is estimated at USD 3.3 billion in 2024 and is projected to reach approximately USD 30.1 billion by 2034, registering a robust CAGR of about 30.8% during 2025–2034. This rapid expansion is driven by accelerating 5G rollouts, rising mobile data traffic, and the need for real-time network intelligence to manage increasingly dense and heterogeneous radio access networks. Telecom operators are adopting AI-driven optimization to improve spectral efficiency, reduce latency, and lower operating costs, while supporting advanced use cases such as network slicing, massive IoT, and ultra-reliable low-latency communications. As automation becomes central to self-organizing networks (SON), AI-enabled RAN optimization is emerging as a critical enabler of next-generation telecom performance and scalability.
Get More Information about this report -
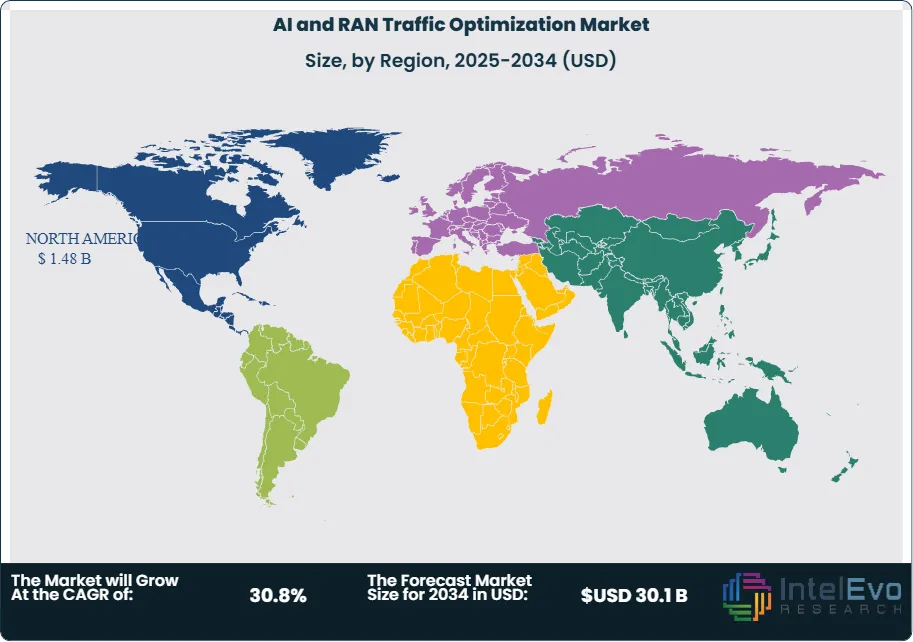
Request Free Sample ReportThis market is expanding rapidly as telecom operators face mounting pressure to manage surging mobile data volumes and deliver consistent service quality. AI-driven traffic optimization is now central to network planning and performance management. In 2024, North America accounted for 44.8% of global revenues, reaching USD 0.9 billion. The region remains the primary investment hub, driven by early 5G rollout and high mobile penetration. Asia Pacific is emerging fast, with operators in China, India, and South Korea accelerating AI adoption to handle dense urban traffic and rural connectivity gaps.
You’re seeing a shift from manual network tuning to automated, AI-led orchestration. Deep learning, predictive analytics, and real-time data processing are being deployed to forecast traffic loads, allocate spectrum, and reduce latency. Cloud-native RAN and virtualized network functions are gaining traction, enabling flexible deployment and faster upgrades. These technologies are not just improving throughput. They’re cutting operational costs and helping operators meet service-level agreements in congested zones.
Demand-side growth is fueled by rising smartphone usage, video streaming, and enterprise mobility. On the supply side, vendors are pushing AI-integrated solutions that promise faster diagnostics and self-healing capabilities. Regulatory bodies are also encouraging spectrum efficiency, which adds urgency to AI adoption. However, challenges remain. Data privacy concerns, integration complexity, and the need for skilled personnel are slowing deployments in some regions.
Investors should watch markets with high 5G penetration and urban density. Western Europe and parts of Southeast Asia are showing strong uptake, especially where governments support telecom modernization. The business case is clear. AI in RAN optimization delivers measurable gains in network efficiency, customer satisfaction, and cost control. Operators that act early will be better positioned to handle future traffic loads and monetize new services. This market is not just growing. It’s reshaping how mobile networks are built, managed, and scaled.
, By Network Type (4G, 5G, Open RAN), By End User (Telecom Operators, Enterprises), AI-Native RAN Trends, Key Vendors & Forecast 2025–2034")
Key Takeaways
- Market Growth: The global AI and RAN Traffic Optimization market is projected to grow from USD 3.3 billion in 2024 to USD 30.1 billion by 2034, registering a CAGR of 30.8%. Growth is driven by rising mobile data volumes, 5G deployments, and demand for automated network management.
- Product Type: Hardware accounted for over 40.0% of market share in 2024, reflecting strong demand for AI-integrated network infrastructure and edge computing components.
- Deployment Mode: On-premises solutions captured 62.4% of the market in 2024, favored by telecom operators seeking greater control over data security and latency-sensitive operations.
- Application: Traffic Load Balancing led with 28.7% share in 2024, as operators prioritized AI tools to manage congestion and maintain service quality in high-density zones.
- Network Type: 4G/LTE Networks held 34.4% of the market in 2024, driven by ongoing optimization needs in legacy infrastructure and transitional deployments alongside 5G.
- End Use: Telecommunication Service Providers represented 62.9% of total demand in 2024, reflecting their central role in deploying AI-based RAN solutions to manage expanding user bases and complex network environments.
- Driver: The surge in mobile traffic and connected devices is pushing operators to adopt AI for real-time traffic management. In urban areas, data usage per user has increased by over 30% year-on-year, straining legacy systems.
- Restraint: Integration complexity and high upfront costs are slowing adoption among mid-tier operators. On-premises AI deployments can exceed USD 5 million in initial investment, limiting uptake in cost-sensitive markets.
- Opportunity: Asia Pacific presents strong upside, with China and India investing in AI-led telecom modernization. The region is expected to grow at a CAGR above 30% through 2034, supported by government-backed 5G rollouts.
- Trend: Cloud-native RAN and virtualized network functions are gaining traction. Major vendors are embedding machine learning into orchestration platforms to enable predictive load balancing and self-healing capabilities.
- Regional Analysis: North America led in 2024 with 44.8% share and USD 0.9 billion in revenue. The US alone contributed USD 0.84 billion, growing at 29% CAGR. Asia Pacific is the fastest-growing region, while Western Europe shows steady adoption in urban telecom corridors.
Component
As of 2025, hardware remains the largest revenue contributor in the AI and RAN Traffic Optimization market, accounting for over 40% of total value. This dominance reflects sustained investment in physical infrastructure required to support AI workloads across mobile networks. Telecom operators are prioritizing high-throughput servers, low-latency network switches, and AI accelerators to manage rising data volumes and real-time traffic orchestration.
AI accelerators such as GPUs and custom ASICs are seeing rapid adoption due to their ability to process complex machine learning models at scale. These components are essential for executing predictive analytics and traffic routing algorithms with minimal delay. With 5G rollouts intensifying, operators are upgrading legacy systems to accommodate higher bandwidth and lower latency thresholds, driving demand for advanced hardware configurations.
The hardware segment is expected to maintain its lead through 2030, supported by the need for edge computing and localized processing in dense urban environments. Vendors offering integrated hardware-software stacks are gaining traction, especially among Tier 1 operators seeking end-to-end deployment capabilities.
Deployment Mode
In 2025, on-premises deployments continue to dominate, representing over 62% of global market share. Telecom providers favor this model for its superior control over data flows and compliance with national security and privacy regulations. On-premises systems also offer lower latency, which is critical for time-sensitive applications such as autonomous systems and industrial IoT.
Many operators have legacy infrastructure optimized for on-site deployment. Rather than shifting entirely to cloud-native models, they are layering AI capabilities onto existing systems. This hybrid approach allows for incremental upgrades while preserving sunk investments in physical assets.
Despite the rise of cloud-based RAN platforms, latency and data sovereignty concerns remain barriers to full migration. However, cloud deployments are gaining ground in enterprise use cases and smaller markets where cost efficiency and scalability outweigh customization needs.
Optimization Type
Traffic Load Balancing leads the optimization category in 2025, accounting for 28.7% of market share. This function is central to maintaining service quality amid rising data consumption, particularly in high-density urban zones. AI algorithms are being deployed to dynamically reroute traffic, reduce congestion, and ensure equitable bandwidth distribution across users.
Resource Allocation is another critical segment, addressing the challenge of fluctuating demand and heterogeneous traffic types. Operators are using AI to allocate spectrum and compute resources based on real-time usage patterns, improving throughput and reducing dropped connections.
Interference Mitigation and Spectrum Optimization are gaining relevance as networks become more crowded. AI models are being trained to detect and resolve signal conflicts, enhancing spectral efficiency and supporting seamless connectivity. These functions are vital for supporting emerging use cases such as AR/VR and mission-critical communications.
Network Type
4G/LTE networks remain the largest deployment base for AI and RAN optimization, holding 34.4% of market share in 2025. These networks continue to serve as the backbone of mobile connectivity in many regions, especially where 5G infrastructure is still under development.
The 5G segment is expanding rapidly, driven by its ability to support ultra-low latency and high-bandwidth applications. AI is being embedded into 5G RAN architectures to manage complex traffic flows and enable autonomous network operations. Adoption is strongest in North America, South Korea, and parts of Western Europe.
Other network types, including legacy 3G and emerging standards like 6G testbeds, represent niche opportunities. While their market share is limited, they serve specific geographies and use cases where newer technologies are not yet viable or cost-effective.
End-User
Telecommunication Service Providers dominate end-user adoption, capturing 62.9% of market share in 2025. Mobile Network Operators (MNOs) and Internet Service Providers (ISPs) are deploying AI to automate network diagnostics, predict traffic surges, and optimize bandwidth allocation.
The segment’s growth is fueled by rising demand for high-speed internet and the operational complexity introduced by 5G and IoT. AI-based traffic optimization enables providers to reduce downtime, improve customer experience, and manage infrastructure more efficiently.
Regulatory support and national digital transformation agendas are accelerating adoption. Governments in regions such as the EU and Asia Pacific are incentivizing AI integration in telecom networks to improve coverage and reliability. Enterprises in manufacturing, healthcare, and media are also beginning to adopt AI-driven RAN solutions, though their share remains secondary to telecom operators.
Get More Information about this report -
Request Free Sample ReportKey Market Segments
By Component
- Hardware
- Servers
- Network Infrastructure
- AI Accelerators
- Others
- Software
- Traffic Optimization Algorithms
- AI/ML-Driven Platforms
- RAN Intelligent Controllers (RICs)
- Others
- Services
- Professional Services
- Implementation & Integration
- Consulting & Training
- Support & Maintenance
- Managed Services
By Deployment Mode
- On-Premises
- Cloud-Based
By Optimization Type
- Traffic Load Balancing
- Resource Allocation
- Spectrum Optimization
- Interference Mitigation
- Energy Optimization
- Others (Coverage and Capacity Optimization,Latency Reduction, etc.)
By Network Type
- 4G/LTE Networks
- 5G Networks
- Others
By End-User
- Telecommunication Service Providers
- Mobile Network Operators (MNOs)
- Internet Service Providers (ISPs)
- Enterprises
- Manufacturing
- Retail
- Healthcare
- IT & Telecom
- Media & Entertainment
- Others (Energy & Utilities, etc.)
By Region
- North America
- Latin America
- East Asia And Pacific
- Sea And South Asia
- Eastern Europe
- Western Europe
- Middle East & Africa
| Report Attribute | Details |
| Market size (2024) | USD 3.3 B |
| Forecast Revenue (2034) | USD 30.1 B |
| CAGR (2024-2034) | 30.8% |
| Historical data | 2020-2023 |
| Base Year For Estimation | 2024 |
| Forecast Period | 2025-2034 |
| Report coverage | Revenue Forecast, Competitive Landscape, Market Dynamics, Growth Factors, Trends and Recent Developments |
| Segments covered | By Component (Hardware, Software, Services, (Professional Services, Managed Services)), By Deployment Mode (On-Premises, Cloud-Based), By Optimization Type (Traffic Load Balancing, Resource Allocation, Spectrum Optimization, Interference Mitigation, Energy Optimization, Others (Coverage and Capacity Optimization,Latency Reduction, etc.)), By Network Type (4G/LTE Networks, 5G Networks, Others), By End-User (Telecommunication Service Providers, Enterprises) |
| Research Methodology |
|
| Regional scope |
|
| Competitive Landscape | Samsung Electronics, NEC Corporation, Qualcomm Technologies, Juniper Networks, Huawei Technologies Co., Ltd., Intel Corporation, Nokia Corporation, Cisco Systems, Inc., ZTE Corporation, Amdocs, Telefonaktiebolaget LM Ericsson, Others |
| Customization Scope | Customization for segments, region/country-level will be provided. Moreover, additional customization can be done based on the requirements. |
| Pricing and Purchase Options | Avail customized purchase options to meet your exact research needs. We have three licenses to opt for: Single User License, Multi-User License (Up to 5 Users), Corporate Use License (Unlimited User and Printable PDF). |
, By Network Type (4G, 5G, Open RAN), By End User (Telecom Operators, Enterprises), AI-Native RAN Trends, Key Vendors & Forecast 2025–2034")
, By Network Type (4G, 5G, Open RAN), By End User (Telecom Operators, Enterprises), AI-Native RAN Trends, Key Vendors & Forecast 2025–2034")
, By Network Type (4G, 5G, Open RAN), By End User (Telecom Operators, Enterprises), AI-Native RAN Trends, Key Vendors & Forecast 2025–2034")

Select Licence Type
Connect with our sales team
AI and RAN Traffic Optimization Market
Published Date : 30 Dec 2025 | Formats :Why IntelEvoResearch
100%
Customer
Satisfaction
24x7+
Availability - we are always
there when you need us
200+
Fortune 50 Companies trust
IntelEvoResearch
80%
of our reports are exclusive
and first in the industry
100%
more data
and analysis
1000+
reports published
till date
