AI-Based 3D Vision System Market Size | 27.4% CAGR Forecast 2034
Global AI-Based 3D Vision System Market Size, Share, Industry Analysis By Component (Hardware, Software, Services), By Technology (Stereo Vision, Time-of-Flight, Structured Light), By Application (Robotics, Quality Inspection, Autonomous Vehicles, Healthcare Imaging), By End Use Industry, Global Trends, Key Players & Forecast 2025–2034
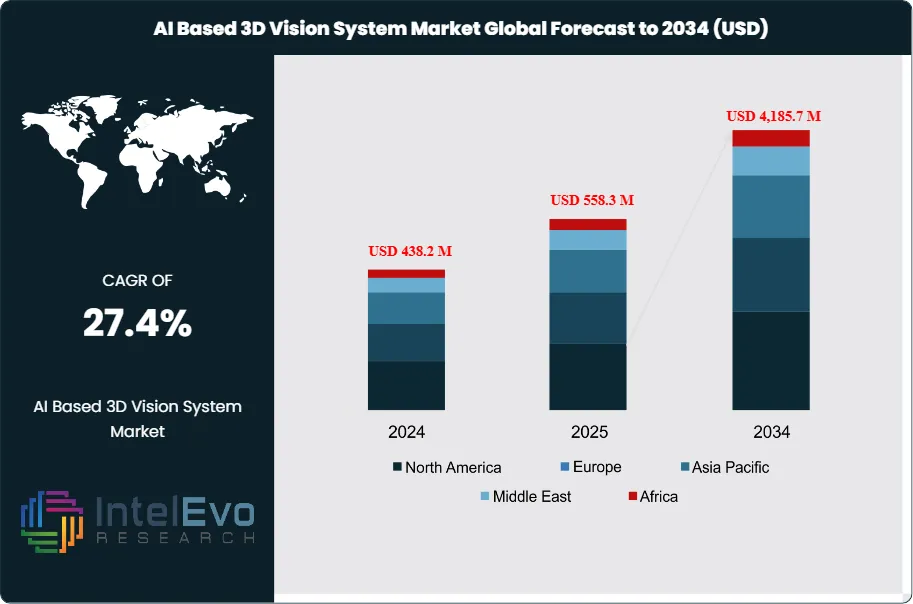
The AI-based 3D vision system market is estimated at USD 438.2 million in 2024 and is projected to reach approximately USD 4,185.7 million by 2034, reflecting a strong CAGR of about 27.4% from 2025–2034. These updated values reflect accelerating demand for intelligent automation, precision robotics, and real-time machine vision capabilities across industrial and high-tech sectors.
The AI-based 3D vision system market has shifted from a niche technology in industrial automation to a key feature in advanced manufacturing ecosystems. Demand has increased in the past five years as industries focus on higher automation, accuracy, and efficiency. Automotive, electronics, and medical device manufacturers lead the adoption, driven by their need for precise, complex tasks at scale. In 2024, North America had the largest market share at 34.6% and generated USD 105 million in revenue, supported by strong investments in robotics, smart factories, and intelligent inspection systems.
AI-enabled 3D vision systems provide real-time spatial intelligence. This capability supports critical applications like defect detection, autonomous navigation, volumetric measurement, and robotic picking in changing conditions. Their value grows as manufacturers seek to increase output and reduce errors. For example, automated inspection using 3D vision can cut quality control cycle times by up to 40% in high-volume production settings. These improvements are especially important as industries speed up digital transformation efforts and integrate AI technologies to enhance manufacturing processes.
On the supply side, ongoing improvements in sensor calibration, neural network models, optical parts, and processing systems are significantly boosting accuracy and reliability. Modern AI-based 3D vision solutions can now identify unusual shapes, track fast-moving objects, and adjust to different lighting or environmental conditions. This increase in performance is crucial in logistics, semiconductor packaging, precision assembly, and autonomous robotics. As computational power becomes cheaper and AI training processes improve, vendors are providing more flexible and modular systems suited to various industrial needs.
Despite this progress, several challenges still slow widespread adoption. High initial costs for deployment are a significant barrier, especially for small and mid-sized companies with limited automation budgets. Integrating with older equipment and split industrial control systems also hampers implementation in conservative sectors. Concerns about compatibility, maintenance skills, and long-term return on investment create more hesitation. However, early adopters are showing measurable benefits, which encourages broader industry acceptance as digital factories become more common.
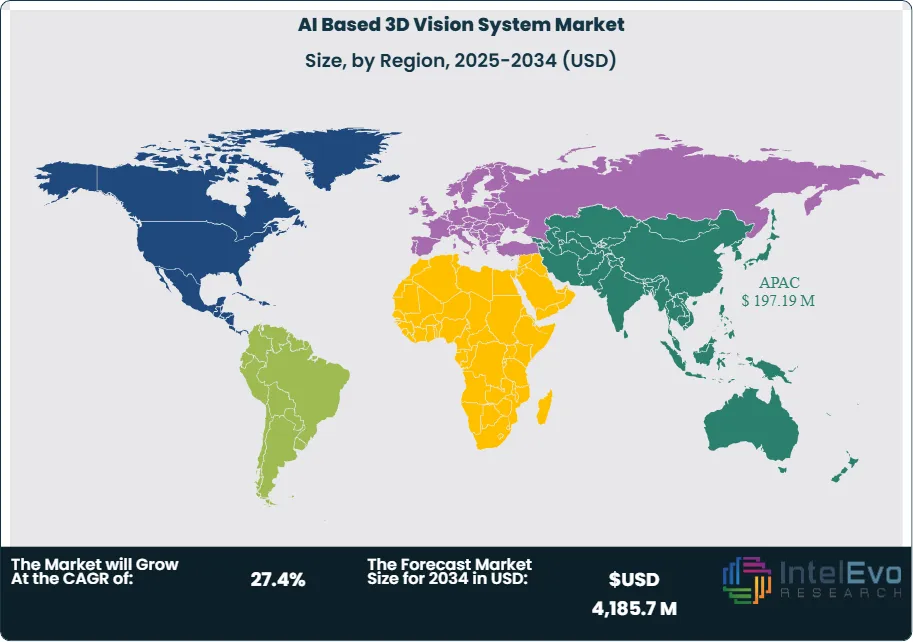
Global adoption trends indicate a positive outlook for long-term growth. The Asia Pacific region is quickly becoming a high-growth area, boosted by automotive manufacturing centers in China, Japan, and South Korea, along with government-supported AI modernization initiatives. European industries are also relying more on adaptive vision systems to comply with strict quality and safety standards in sectors like pharmaceuticals, aerospace, and advanced materials. As AI algorithms become better at learning from real-time production data and adapting automatically to changing conditions, AI-based 3D vision is becoming essential for the next generation of industrial intelligence. With growing complexity in automation, the need for precise, high-performing 3D vision technology will only increase over the next decade.
Key Takeaways
Market Growth: The global AI-based 3D vision system market is projected to reach USD 4,185.7 million by 2034, up from USD 438.2 million in 2024, reflecting a CAGR of 27.4%. Growth is driven by increasing automation needs in manufacturing, robotics, and quality control.
Component: Hardware accounted for over 67.8% of total market revenue in 2024. This dominance is due to high demand for advanced sensors, cameras, and processors that enable precise 3D data capture and real-time analysis.
Platform Type: PC-based systems led the market with a 51.3% share in 2024. Their dominance stems from superior computing power and ease of integration with industrial automation infrastructure.
Application: Quality Assurance & Inspection was the leading application, representing over 47.2% of market revenue in 2024. Manufacturers are adopting 3D vision systems to reduce defects and improve throughput in high-precision environments.
End Use Industry: Automotive remained the top end-use sector in 2024, contributing more than 19.5% of market revenue. Key drivers include increased adoption of robotics in assembly lines and demand for high-accuracy component inspection.
Driver: Rising automation in industrial processes is accelerating adoption. AI-based 3D vision systems reduce inspection time by up to 40% in high-volume operations, directly improving productivity and lowering labor costs.
Restraint: High upfront costs and integration challenges remain barriers for small and mid-sized enterprises. Many manufacturers face difficulties aligning AI-based systems with legacy equipment, slowing overall implementation rates.
Opportunity: Asia Pacific presents strong upside, supported by automotive production growth and government-backed AI investments. Markets like China, India, and Japan are expected to see double-digit adoption growth through 2030.
Trend: Integration of deep learning models with 3D vision systems is advancing real-time object recognition and adaptive automation. Companies are prioritizing systems that can learn from live production data to improve accuracy without manual recalibration.
Regional Analysis: North America led the global market in 2024 with a 34.6% share and USD 105 million in revenue. While the U.S. remains a hub for early adoption, Asia Pacific is gaining momentum as a manufacturing and R&D center with accelerating CAGR projections.
Component Analysis
Hardware remains the largest revenue contributor in AI-based 3D vision. Buyers continue to invest in depth sensors, industrial cameras, optics, laser profilers, and embedded compute that capture and pre-process 3D data. Hardware intensity is not easing in 2025, given the shift to higher-resolution imagers and faster interfaces that feed AI models at line speed. Broader machine vision spend is set to expand at double-digit rates through 2030, keeping capital equipment at the center of budgets.
Software is scaling with model upgrades and toolchains that cut deployment time. You now see vendors shipping domain-specific AI for defect classification, 3D point-cloud analytics, and synthetic data pipelines. AI in computer vision is one of the fastest-growing layers, with market estimates pointing to high-twenties to low-thirties CAGR into the 2030s, which will raise software’s mix as subscriptions and runtime licenses compound.
Services are moving from one-off integration to lifecycle contracts. System design, dataset curation, validation, and MLOps support are recurring needs as factories refresh lines every 18 to 36 months. As total machine vision outlays rise into the 2030 horizon, services revenue tracks deployments across brownfield plants and multi-site rollouts.
Type Analysis
PC-based systems retain the installed base in complex 3D tasks. They offer high compute headroom, broad SDK support, and flexible I/O for multi-camera cells. Manufacturers favor PC architectures for demanding point-cloud fusion, metrology, and AI inference on larger models. With global machine vision revenue projected to grow at roughly 13 percent CAGR to 2030, PC-based platforms will stay embedded in high-throughput inspection cells and robotics workstations.
Smart-camera-based systems are gaining share in 2025 as on-sensor AI improves. New devices pair CMOS imagers with NPUs, shrinking footprint and install time while meeting IP65/67 needs on the line. Industry trackers project the broader smart-camera segment to expand at low-to-mid teens CAGR this decade. Niche forecasts for smart-camera 3D solutions also point to mid-teens growth to 2033 as vendors like Cognex and Keyence push integrated 3D offerings. Expect faster uptake in packaging, food and beverage, and logistics where single-unit installs reduce integration cost.
“Others” includes modular vision sensors, FPGA/SoC edge boxes, and hybrid architectures that split inference between camera, edge, and server. These builds support retrofits where PC cabinets are impractical but full smart-camera consolidation is not feasible. Growth will mirror overall machine vision expansion as integrators mix components to meet takt-time and accuracy targets.
Application Analysis
Quality assurance and inspection remains the anchor application. It held the largest share in 2024 and continues to lead in 2025, driven by tighter defect ppm targets, serialization, and regulatory compliance. AI-enabled 3D raises detection rates for surface flaws, assembly errors, and dimensional out-of-tolerance parts, cutting scrap and recall risk in automotive, electronics, and pharma.
Positioning and guidance is scaling with robot installs and autonomous material handling. 3D vision supports bin-picking, depalletizing, and path planning in warehouses and mixed-model assembly. As logistics and e-commerce invest in automation, guidance workloads are moving from pilot to production, supported by rising global machine vision spend through 2030.
Measurement and metrology benefit from higher-resolution sensors and improved point-cloud processing. Plants use 3D vision for inline gauging, body-in-white alignment, and blade or die wear checks. Better accuracy at line speed expands use from lab QA to shop-floor SPC, raising attach rates across metalworking and precision assembly.
Industry Vertical Analysis
Automotive remains a major buyer as EV platforms and mixed-model lines demand tighter tolerances and higher first-time-through rates. 3D vision underpins battery pack assembly, seam inspection, and robot guidance. Regional analyses show automotive as a leading user in Asia, with shares near half of industrial machine vision demand in some markets, underscoring its outsized pull on global roadmaps.
Electronics and semiconductor lines use 3D vision for board-level inspection, connector alignment, and advanced packaging. As component miniaturization continues, AI-assisted 3D detection reduces false rejects and rework. Machinery and equipment OEMs embed 3D vision into turnkey cells, creating pull-through for services and software.
Pharmaceuticals and healthcare deploy 3D for blister integrity, vial and syringe checks, and device assembly verification. Postal and logistics operations add 3D volumetric measurement, label reading, and damage detection to speed sortation and billing accuracy. These verticals expand the use cases beyond discrete manufacturing and stabilize demand across cycles.
Regional Analysis
Asia Pacific is the fastest-growing region in 2025. Multiple sources point to double-digit CAGRs, supported by electronics clustering in China, South Korea, and Taiwan; automotive capacity in China and Southeast Asia; and strong supplier bases in Japan. Some estimates placed APAC machine vision revenue near 9 to 10 billion dollars in 2024, with growth above 13 percent expected into the 2030s.
North America maintains a significant revenue base due to high automation intensity and ongoing AI investment cycles. The region benefits from strong integrator ecosystems and rapid adoption in logistics and consumer goods. Europe remains a core market with entrenched automotive and machinery OEMs and steady upgrades tied to quality and sustainability mandates. Global machine vision and 3D sub-segments are projected to expand at low-to-mid teens CAGRs through 2030, supporting broad regional growth.
Latin America and the Middle East & Africa are smaller today but show rising project counts in food processing, mining, and packaging. As component prices fall and smart-camera deployments simplify installs, these regions should post above-average growth from a smaller base. Your strategy in 2025 should prioritize APAC for volume, North America and Europe for high-value cells, and targeted wins in emerging regions with standardized, rapid-deploy solutions.
By Component, Hardware, Software, Services By Type, PC Based, Smart Camera Based, Others By Application, Quality Assurance & Inspection, Positioning & Guidance, Measurement, Others By Industry Vertical, Automotive, Electronics & Semiconductor, Machinery & Equipment, Pharmaceuticals & Healthcare, Postal & Logistics, Others
Research Methodology
Primary Research- 100 Interviews of Stakeholders
Secondary Research
Desk Research
Regional scope
North America (United States, Canada, Mexico)
Latin America (Brazil, Argentina, Columbia)
East Asia And Pacific (China, Japan, South Korea, Australia, Cambodia, Fiji, Indonesia)
Sea And South Asia (India, Singapore, Thailand, Taiwan, Malaysia)
Eastern Europe (Poland, Russia, Czech Republic, Romania)
Western Europe (Germany, U.K., France, Spain, Itlay)
Middle East & Africa (GCC Countries, Egypt, Nigeria, South Africa, Israel)
Competitive Landscape
SewerAI, Basler AG, Orbital Insight, Mashgin, Keyence Corporation, KITWARE, Skyrora, Cognex Corporation, Path Robotics, Proprio, THALES, New Frontier Aerospace, Inc., Other Key Players
Customization Scope
Customization for segments, region/country-level will be provided. Moreover, additional customization can be done based on the requirements.
Pricing and Purchase Options
Avail customized purchase options to meet your exact research needs. We have three licenses to opt for: Single User License, Multi-User License (Up to 5 Users), Corporate Use License (Unlimited User and Printable PDF).
TABLE OF CONTENTS
1. EXECUTIVE SUMMARY
1.1. MARKET SNAPSHOT
1.2. KEY FINDINGS & INSIGHTS
1.3. ANALYST RECOMMENDATIONS
1.4. FUTURE OUTLOOK
2. RESEARCH METHODOLOGY
2.1. MARKET DEFINITION & SCOPE
2.2. RESEARCH OBJECTIVES: PRIMARY & SECONDARY DATA SOURCES
2.3. DATA COLLECTION SOURCES
2.3.1. COVERAGE OF 100+ PRIMARY RESEARCH/CONSULTATION CALLS WITH INDUSTRY STAKEHOLDERS
FIGURE 17 NORTH AMERICA AI BASED 3D VISION SYSTEM CURRENT AND FUTURE TYPE ANALYSIS, 2025–2034, (USD MILLION)
FIGURE 18 NORTH AMERICA AI BASED 3D VISION SYSTEM CURRENT AND FUTURE END USER ANALYSIS, 2025–2034, (USD MILLION)
FIGURE 19 MARKET SHARE BY COUNTRY
FIGURE 20 LATIN AMERICA AI BASED 3D VISION SYSTEM CURRENT AND FUTURE TYPE ANALYSIS, 2025–2034, (USD MILLION)
FIGURE 21 LATIN AMERICA AI BASED 3D VISION SYSTEM CURRENT AND FUTURE END USER ANALYSIS, 2025–2034, (USD MILLION)
FIGURE 22 MARKET SHARE BY COUNTRY
FIGURE 23 EASTERN EUROPE AI BASED 3D VISION SYSTEM CURRENT AND FUTURE TYPE ANALYSIS, 2025–2034, (USD MILLION)
FIGURE 24 EASTERN EUROPE AI BASED 3D VISION SYSTEM CURRENT AND FUTURE END USER ANALYSIS, 2025–2034, (USD MILLION)
FIGURE 25 MARKET SHARE BY COUNTRY
FIGURE 26 WESTERN EUROPE AI BASED 3D VISION SYSTEM CURRENT AND FUTURE TYPE ANALYSIS, 2025–2034, (USD MILLION)
FIGURE 27 WESTERN EUROPE AI BASED 3D VISION SYSTEM CURRENT AND FUTURE END USER ANALYSIS, 2025–2034, (USD MILLION)
FIGURE 28 MARKET SHARE BY COUNTRY
FIGURE 29 EAST ASIA AND PACIFIC AI BASED 3D VISION SYSTEM CURRENT AND FUTURE TYPE ANALYSIS, 2025–2034, (USD MILLION)
FIGURE 30 EAST ASIA AND PACIFIC AI BASED 3D VISION SYSTEM CURRENT AND FUTURE END USER ANALYSIS, 2025–2034, (USD MILLION)
FIGURE 31 MARKET SHARE BY COUNTRY
FIGURE 32 SEA AND SOUTH ASIA AI BASED 3D VISION SYSTEM CURRENT AND FUTURE TYPE ANALYSIS, 2025–2034, (USD MILLION)
FIGURE 33 SEA AND SOUTH ASIA AI BASED 3D VISION SYSTEM CURRENT AND FUTURE END USER ANALYSIS, 2025–2034, (USD MILLION)
FIGURE 34 MARKET SHARE BY COUNTRY
FIGURE 35 MIDDLE EAST AND AFRICA AI BASED 3D VISION SYSTEM CURRENT AND FUTURE TYPE ANALYSIS, 2025–2034, (USD MILLION)
FIGURE 36 MIDDLE EAST AND AFRICA AI BASED 3D VISION SYSTEM CURRENT AND FUTURE END USER ANALYSIS, 2025–2034, (USD MILLION)
FIGURE 37 NORTH AMERICA AI BASED 3D VISION SYSTEM CURRENT AND FUTURE MARKET VOLUME SHARE REGIONAL ANALYSIS, 2025–2034, (USD MILLION)
FIGURE 38 U.S. AI BASED 3D VISION SYSTEM CURRENT AND FUTURE TYPE ANALYSIS, 2025–2034, (USD MILLION)
FIGURE 39 U.S. AI BASED 3D VISION SYSTEM CURRENT AND FUTURE END USER ANALYSIS, 2025–2034, (USD MILLION)
FIGURE 40 CANADA AI BASED 3D VISION SYSTEM CURRENT AND FUTURE TYPE ANALYSIS, 2025–2034, (USD MILLION)
FIGURE 41 CANADA AI BASED 3D VISION SYSTEM CURRENT AND FUTURE END USER ANALYSIS, 2025–2034, (USD MILLION)
FIGURE 42 LATIN AMERICA AI BASED 3D VISION SYSTEM CURRENT AND FUTURE MARKET VOLUME SHARE REGIONAL ANALYSIS, 2025–2034, (USD MILLION)
FIGURE 43 MEXICO AI BASED 3D VISION SYSTEM CURRENT AND FUTURE TYPE ANALYSIS, 2025–2034, (USD MILLION)
FIGURE 44 MEXICO AI BASED 3D VISION SYSTEM CURRENT AND FUTURE END USER ANALYSIS, 2025–2034, (USD MILLION)
FIGURE 45 BRAZIL AI BASED 3D VISION SYSTEM CURRENT AND FUTURE TYPE ANALYSIS, 2025–2034, (USD MILLION)
FIGURE 46 BRAZIL AI BASED 3D VISION SYSTEM CURRENT AND FUTURE END USER ANALYSIS, 2025–2034, (USD MILLION)
FIGURE 47 ARGENTINA AI BASED 3D VISION SYSTEM CURRENT AND FUTURE TYPE ANALYSIS, 2025–2034, (USD MILLION)
FIGURE 48 ARGENTINA AI BASED 3D VISION SYSTEM CURRENT AND FUTURE END USER ANALYSIS, 2025–2034, (USD MILLION)
FIGURE 49 COLUMBIA AI BASED 3D VISION SYSTEM CURRENT AND FUTURE TYPE ANALYSIS, 2025–2034, (USD MILLION)
FIGURE 50 COLUMBIA AI BASED 3D VISION SYSTEM CURRENT AND FUTURE END USER ANALYSIS, 2025–2034, (USD MILLION)
FIGURE 51 REST OF LATIN AMERICA AI BASED 3D VISION SYSTEM CURRENT AND FUTURE TYPE ANALYSIS, 2025–2034, (USD MILLION)
FIGURE 52 REST OF LATIN AMERICA AI BASED 3D VISION SYSTEM CURRENT AND FUTURE END USER ANALYSIS, 2025–2034, (USD MILLION)
FIGURE 53 EASTERN EUROPE AI BASED 3D VISION SYSTEM CURRENT AND FUTURE MARKET VOLUME SHARE REGIONAL ANALYSIS, 2025–2034, (USD MILLION)
FIGURE 54 POLAND AI BASED 3D VISION SYSTEM CURRENT AND FUTURE TYPE ANALYSIS, 2025–2034, (USD MILLION)
FIGURE 55 POLAND AI BASED 3D VISION SYSTEM CURRENT AND FUTURE END USER ANALYSIS, 2025–2034, (USD MILLION)
FIGURE 56 RUSSIA AI BASED 3D VISION SYSTEM CURRENT AND FUTURE TYPE ANALYSIS, 2025–2034, (USD MILLION)
FIGURE 57 RUSSIA AI BASED 3D VISION SYSTEM CURRENT AND FUTURE END USER ANALYSIS, 2025–2034, (USD MILLION)
FIGURE 58 CZECH REPUBLIC AI BASED 3D VISION SYSTEM CURRENT AND FUTURE TYPE ANALYSIS, 2025–2034, (USD MILLION)
FIGURE 59 CZECH REPUBLIC AI BASED 3D VISION SYSTEM CURRENT AND FUTURE END USER ANALYSIS, 2025–2034, (USD MILLION)
FIGURE 60 ROMANIA AI BASED 3D VISION SYSTEM CURRENT AND FUTURE TYPE ANALYSIS, 2025–2034, (USD MILLION)
FIGURE 61 ROMANIA AI BASED 3D VISION SYSTEM CURRENT AND FUTURE END USER ANALYSIS, 2025–2034, (USD MILLION)
FIGURE 62 REST OF EASTERN EUROPE AI BASED 3D VISION SYSTEM CURRENT AND FUTURE TYPE ANALYSIS, 2025–2034, (USD MILLION)
FIGURE 63 REST OF EASTERN EUROPE AI BASED 3D VISION SYSTEM CURRENT AND FUTURE END USER ANALYSIS, 2025–2034, (USD MILLION)
FIGURE 64 WESTERN EUROPE AI BASED 3D VISION SYSTEM CURRENT AND FUTURE MARKET VOLUME SHARE REGIONAL ANALYSIS, 2025–2034, (USD MILLION)
FIGURE 65 GERMANY AI BASED 3D VISION SYSTEM CURRENT AND FUTURE TYPE ANALYSIS, 2025–2034, (USD MILLION)
FIGURE 66 GERMANY AI BASED 3D VISION SYSTEM CURRENT AND FUTURE END USER ANALYSIS, 2025–2034, (USD MILLION)
FIGURE 67 FRANCE AI BASED 3D VISION SYSTEM CURRENT AND FUTURE TYPE ANALYSIS, 2025–2034, (USD MILLION)
FIGURE 68 FRANCE AI BASED 3D VISION SYSTEM CURRENT AND FUTURE END USER ANALYSIS, 2025–2034, (USD MILLION)
FIGURE 69 UK AI BASED 3D VISION SYSTEM CURRENT AND FUTURE TYPE ANALYSIS, 2025–2034, (USD MILLION)
FIGURE 70 UK AI BASED 3D VISION SYSTEM CURRENT AND FUTURE END USER ANALYSIS, 2025–2034, (USD MILLION)
FIGURE 71 SPAIN AI BASED 3D VISION SYSTEM CURRENT AND FUTURE TYPE ANALYSIS, 2025–2034, (USD MILLION)
FIGURE 72 SPAIN AI BASED 3D VISION SYSTEM CURRENT AND FUTURE END USER ANALYSIS, 2025–2034, (USD MILLION)
FIGURE 73 ITALY AI BASED 3D VISION SYSTEM CURRENT AND FUTURE TYPE ANALYSIS, 2025–2034, (USD MILLION)
FIGURE 74 ITALY AI BASED 3D VISION SYSTEM CURRENT AND FUTURE END USER ANALYSIS, 2025–2034, (USD MILLION)
FIGURE 75 REST OF WESTERN EUROPE AI BASED 3D VISION SYSTEM CURRENT AND FUTURE TYPE ANALYSIS, 2025–2034, (USD MILLION)
FIGURE 76 REST OF WESTERN EUROPE AI BASED 3D VISION SYSTEM CURRENT AND FUTURE END USER ANALYSIS, 2025–2034, (USD MILLION)
FIGURE 77 EAST ASIA AND PACIFIC AI BASED 3D VISION SYSTEM CURRENT AND FUTURE MARKET VOLUME SHARE REGIONAL ANALYSIS, 2025–2034, (USD MILLION)
FIGURE 78 CHINA AI BASED 3D VISION SYSTEM CURRENT AND FUTURE TYPE ANALYSIS, 2025–2034, (USD MILLION)
FIGURE 79 CHINA AI BASED 3D VISION SYSTEM CURRENT AND FUTURE END USER ANALYSIS, 2025–2034, (USD MILLION)
FIGURE 80 JAPAN AI BASED 3D VISION SYSTEM CURRENT AND FUTURE TYPE ANALYSIS, 2025–2034, (USD MILLION)
FIGURE 81 JAPAN AI BASED 3D VISION SYSTEM CURRENT AND FUTURE END USER ANALYSIS, 2025–2034, (USD MILLION)
FIGURE 82 AUSTRALIA AI BASED 3D VISION SYSTEM CURRENT AND FUTURE TYPE ANALYSIS, 2025–2034, (USD MILLION)
FIGURE 83 AUSTRALIA AI BASED 3D VISION SYSTEM CURRENT AND FUTURE END USER ANALYSIS, 2025–2034, (USD MILLION)
FIGURE 84 CAMBODIA AI BASED 3D VISION SYSTEM CURRENT AND FUTURE TYPE ANALYSIS, 2025–2034, (USD MILLION)
FIGURE 85 CAMBODIA AI BASED 3D VISION SYSTEM CURRENT AND FUTURE END USER ANALYSIS, 2025–2034, (USD MILLION)
FIGURE 86 FIJI AI BASED 3D VISION SYSTEM CURRENT AND FUTURE TYPE ANALYSIS, 2025–2034, (USD MILLION)
FIGURE 87 FIJI AI BASED 3D VISION SYSTEM CURRENT AND FUTURE END USER ANALYSIS, 2025–2034, (USD MILLION)
FIGURE 88 INDONESIA AI BASED 3D VISION SYSTEM CURRENT AND FUTURE TYPE ANALYSIS, 2025–2034, (USD MILLION)
FIGURE 89 INDONESIA AI BASED 3D VISION SYSTEM CURRENT AND FUTURE END USER ANALYSIS, 2025–2034, (USD MILLION)
FIGURE 90 SOUTH KOREA AI BASED 3D VISION SYSTEM CURRENT AND FUTURE TYPE ANALYSIS, 2025–2034, (USD MILLION)
FIGURE 91 SOUTH KOREA AI BASED 3D VISION SYSTEM CURRENT AND FUTURE END USER ANALYSIS, 2025–2034, (USD MILLION)
FIGURE 92 REST OF EAST ASIA AND PACIFIC AI BASED 3D VISION SYSTEM CURRENT AND FUTURE TYPE ANALYSIS, 2025–2034, (USD MILLION)
FIGURE 93 REST OF EAST ASIA AND PACIFIC AI BASED 3D VISION SYSTEM CURRENT AND FUTURE END USER ANALYSIS, 2025–2034, (USD MILLION)
FIGURE 94 SEA AND SOUTH ASIA AI BASED 3D VISION SYSTEM CURRENT AND FUTURE MARKET VOLUME SHARE REGIONAL ANALYSIS, 2025–2034, (USD MILLION)
FIGURE 95 BANGLADESH AI BASED 3D VISION SYSTEM CURRENT AND FUTURE TYPE ANALYSIS, 2025–2034, (USD MILLION)
FIGURE 96 BANGLADESH AI BASED 3D VISION SYSTEM CURRENT AND FUTURE END USER ANALYSIS, 2025–2034, (USD MILLION)
FIGURE 97 NEW ZEALAND AI BASED 3D VISION SYSTEM CURRENT AND FUTURE TYPE ANALYSIS, 2025–2034, (USD MILLION)
FIGURE 98 NEW ZEALAND AI BASED 3D VISION SYSTEM CURRENT AND FUTURE END USER ANALYSIS, 2025–2034, (USD MILLION)
FIGURE 99 INDIA AI BASED 3D VISION SYSTEM CURRENT AND FUTURE TYPE ANALYSIS, 2025–2034, (USD MILLION)
FIGURE 100 INDIA AI BASED 3D VISION SYSTEM CURRENT AND FUTURE END USER ANALYSIS, 2025–2034, (USD MILLION)
FIGURE 101 SINGAPORE AI BASED 3D VISION SYSTEM CURRENT AND FUTURE TYPE ANALYSIS, 2025–2034, (USD MILLION)
FIGURE 102 SINGAPORE AI BASED 3D VISION SYSTEM CURRENT AND FUTURE END USER ANALYSIS, 2025–2034, (USD MILLION)
FIGURE 103 THAILAND AI BASED 3D VISION SYSTEM CURRENT AND FUTURE TYPE ANALYSIS, 2025–2034, (USD MILLION)
FIGURE 104 THAILAND AI BASED 3D VISION SYSTEM CURRENT AND FUTURE END USER ANALYSIS, 2025–2034, (USD MILLION)
FIGURE 105 TAIWAN AI BASED 3D VISION SYSTEM CURRENT AND FUTURE TYPE ANALYSIS, 2025–2034, (USD MILLION)
FIGURE 106 TAIWAN AI BASED 3D VISION SYSTEM CURRENT AND FUTURE END USER ANALYSIS, 2025–2034, (USD MILLION)
FIGURE 107 MALAYSIA AI BASED 3D VISION SYSTEM CURRENT AND FUTURE TYPE ANALYSIS, 2025–2034, (USD MILLION)
FIGURE 108 MALAYSIA AI BASED 3D VISION SYSTEM CURRENT AND FUTURE END USER ANALYSIS, 2025–2034, (USD MILLION)
FIGURE 109 REST OF SEA AND SOUTH ASIA AI BASED 3D VISION SYSTEM CURRENT AND FUTURE TYPE ANALYSIS, 2025–2034, (USD MILLION)
FIGURE 110 REST OF SEA AND SOUTH ASIA AI BASED 3D VISION SYSTEM CURRENT AND FUTURE END USER ANALYSIS, 2025–2034, (USD MILLION)
FIGURE 111 MIDDLE EAST AND AFRICA AI BASED 3D VISION SYSTEM CURRENT AND FUTURE MARKET VOLUME SHARE REGIONAL ANALYSIS, 2025–2034, (USD MILLION)
FIGURE 112 GCC COUNTRIES AI BASED 3D VISION SYSTEM CURRENT AND FUTURE TYPE ANALYSIS, 2025–2034, (USD MILLION)
FIGURE 113 GCC COUNTRIES AI BASED 3D VISION SYSTEM CURRENT AND FUTURE END USER ANALYSIS, 2025–2034, (USD MILLION)
FIGURE 114 SAUDI ARABIA AI BASED 3D VISION SYSTEM CURRENT AND FUTURE TYPE ANALYSIS, 2025–2034, (USD MILLION)
FIGURE 115 SAUDI ARABIA AI BASED 3D VISION SYSTEM CURRENT AND FUTURE END USER ANALYSIS, 2025–2034, (USD MILLION)
FIGURE 116 UAE AI BASED 3D VISION SYSTEM CURRENT AND FUTURE TYPE ANALYSIS, 2025–2034, (USD MILLION)
FIGURE 117 UAE AI BASED 3D VISION SYSTEM CURRENT AND FUTURE END USER ANALYSIS, 2025–2034, (USD MILLION)
FIGURE 118 BAHRAIN AI BASED 3D VISION SYSTEM CURRENT AND FUTURE TYPE ANALYSIS, 2025–2034, (USD MILLION)
FIGURE 119 BAHRAIN AI BASED 3D VISION SYSTEM CURRENT AND FUTURE END USER ANALYSIS, 2025–2034, (USD MILLION)
FIGURE 120 KUWAIT AI BASED 3D VISION SYSTEM CURRENT AND FUTURE TYPE ANALYSIS, 2025–2034, (USD MILLION)
FIGURE 121 KUWAIT AI BASED 3D VISION SYSTEM CURRENT AND FUTURE END USER ANALYSIS, 2025–2034, (USD MILLION)
FIGURE 122 OMAN AI BASED 3D VISION SYSTEM CURRENT AND FUTURE TYPE ANALYSIS, 2025–2034, (USD MILLION)
FIGURE 123 OMAN AI BASED 3D VISION SYSTEM CURRENT AND FUTURE END USER ANALYSIS, 2025–2034, (USD MILLION)
FIGURE 124 QATAR AI BASED 3D VISION SYSTEM CURRENT AND FUTURE TYPE ANALYSIS, 2025–2034, (USD MILLION)
FIGURE 125 QATAR AI BASED 3D VISION SYSTEM CURRENT AND FUTURE END USER ANALYSIS, 2025–2034, (USD MILLION)
FIGURE 126 EGYPT AI BASED 3D VISION SYSTEM CURRENT AND FUTURE TYPE ANALYSIS, 2025–2034, (USD MILLION)
FIGURE 127 EGYPT AI BASED 3D VISION SYSTEM CURRENT AND FUTURE END USER ANALYSIS, 2025–2034, (USD MILLION)
FIGURE 128 NIGERIA AI BASED 3D VISION SYSTEM CURRENT AND FUTURE TYPE ANALYSIS, 2025–2034, (USD MILLION)
FIGURE 129 NIGERIA AI BASED 3D VISION SYSTEM CURRENT AND FUTURE END USER ANALYSIS, 2025–2034, (USD MILLION)
FIGURE 130 SOUTH AFRICA AI BASED 3D VISION SYSTEM CURRENT AND FUTURE TYPE ANALYSIS, 2025–2034, (USD MILLION)
FIGURE 131 SOUTH AFRICA AI BASED 3D VISION SYSTEM CURRENT AND FUTURE END USER ANALYSIS, 2025–2034, (USD MILLION)
FIGURE 132 ISRAEL AI BASED 3D VISION SYSTEM CURRENT AND FUTURE TYPE ANALYSIS, 2025–2034, (USD MILLION)
FIGURE 133 ISRAEL AI BASED 3D VISION SYSTEM CURRENT AND FUTURE END USER ANALYSIS, 2025–2034, (USD MILLION)
FIGURE 134 REST OF MEA AI BASED 3D VISION SYSTEM CURRENT AND FUTURE TYPE ANALYSIS, 2025–2034, (USD MILLION)
FIGURE 135 REST OF MEA AI BASED 3D VISION SYSTEM CURRENT AND FUTURE END USER ANALYSIS, 2025–2034, (USD MILLION)
FIGURE 136 U. S. MARKET SHARE ANALYSIS BY TYPE (2024)
FIGURE 137 U. S. MARKET SHARE ANALYSIS BY END USER (2024)
FIGURE 138 CANADA MARKET SHARE ANALYSIS BY TYPE (2024)
FIGURE 139 CANADA MARKET SHARE ANALYSIS BY END USER (2024)
FIGURE 140 MEXICO MARKET SHARE ANALYSIS BY TYPE (2024)
FIGURE 141 MEXICO MARKET SHARE ANALYSIS BY END USER (2024)
FIGURE 142 CHINA MARKET SHARE ANALYSIS BY TYPE (2024)
FIGURE 143 CHINA MARKET SHARE ANALYSIS BY END USER (2024)
FIGURE 144 JAPAN MARKET SHARE ANALYSIS BY TYPE (2024)
FIGURE 145 JAPAN MARKET SHARE ANALYSIS BY END USER (2024)
FIGURE 146 INDIA MARKET SHARE ANALYSIS BY TYPE (2024)
FIGURE 147 INDIA MARKET SHARE ANALYSIS BY END USER (2024)
FIGURE 148 SOUTH KOREA MARKET SHARE ANALYSIS BY TYPE (2024)
FIGURE 149 SOUTH KOREA MARKET SHARE ANALYSIS BY END USER (2024)
FIGURE 150 SAUDI ARABIA MARKET SHARE ANALYSIS BY TYPE (2024)
FIGURE 151 SAUDI ARABIA MARKET SHARE ANALYSIS BY END USER (2024)
FIGURE 152 UAE MARKET SHARE ANALYSIS BY TYPE (2024)
FIGURE 153 UAE MARKET SHARE ANALYSIS BY END USER (2024)
FIGURE 154 EGYPT MARKET SHARE ANALYSIS BY TYPE (2024)
FIGURE 155 EGYPT MARKET SHARE ANALYSIS BY END USER (2024)
FIGURE 156 NIGERIA MARKET SHARE ANALYSIS BY TYPE (2024)
FIGURE 157 NIGERIA MARKET SHARE ANALYSIS BY END USER (2024)
FIGURE 158 SOUTH AFRICA MARKET SHARE ANALYSIS BY TYPE (2024)
FIGURE 159 SOUTH AFRICA MARKET SHARE ANALYSIS BY END USER (2024)
FIGURE 160 GERMANY MARKET SHARE ANALYSIS BY TYPE (2024)
FIGURE 161 GERMANY MARKET SHARE ANALYSIS BY END USER (2024)
FIGURE 162 FRANCE MARKET SHARE ANALYSIS BY TYPE (2024)
FIGURE 163 FRANCE MARKET SHARE ANALYSIS BY END USER (2024)
FIGURE 164 UK MARKET SHARE ANALYSIS BY TYPE (2024)
FIGURE 165 UK MARKET SHARE ANALYSIS BY END USER (2024)
FIGURE 166 SPAIN MARKET SHARE ANALYSIS BY TYPE (2024)
FIGURE 167 SPAIN MARKET SHARE ANALYSIS BY END USER (2024)
FIGURE 168 ITALY MARKET SHARE ANALYSIS BY TYPE (2024)
FIGURE 169 ITALY MARKET SHARE ANALYSIS BY END USER (2024)
FIGURE 170 BRAZIL MARKET SHARE ANALYSIS BY TYPE (2024)
FIGURE 171 BRAZIL MARKET SHARE ANALYSIS BY END USER (2024)
FIGURE 172 ARGENTINA MARKET SHARE ANALYSIS BY TYPE (2024)
FIGURE 173 ARGENTINA MARKET SHARE ANALYSIS BY END USER (2024)
FIGURE 174 COLUMBIA MARKET SHARE ANALYSIS BY TYPE (2024)
FIGURE 175 COLUMBIA MARKET SHARE ANALYSIS BY END USER (2024)
FIGURE 176 GLOBAL AI BASED 3D VISION SYSTEM CURRENT AND FUTURE MARKET KEY COUNTRY LEVEL ANALYSIS, 2024–2034, (USD MILLION)
FIGURE 177 FINANCIAL OVERVIEW:
Key Player Analysis
Cognex Corporation: Cognex is positioned as a global leader in machine vision and AI-based 3D vision systems. The company’s portfolio includes industrial 3D cameras, deep-learning vision software, and smart vision sensors widely adopted in automotive, logistics, and electronics. In 2025, Cognex continues to capture significant market share through its In-Sight and VisionPro platforms, which integrate advanced 3D inspection and defect detection capabilities.
Strategically, Cognex has increased R&D spending on AI-powered vision models and real-time inspection solutions for EV battery assembly and logistics automation. Its acquisition-led expansion into logistics has strengthened its presence in high-growth e-commerce and parcel handling. A key differentiator is its global customer network and strong service footprint in North America, Europe, and Asia Pacific, enabling consistent revenue growth despite cyclical manufacturing demand.
Keyence Corporation: Keyence is regarded as a challenger with strong growth momentum, particularly in Asia Pacific. The company specializes in high-resolution 3D measurement systems, laser profilers, and vision sensors that cater to both precision manufacturing and high-speed inspection. Its extensive product line supports industries ranging from semiconductors to food processing.
By 2025, Keyence has invested heavily in edge AI integration, enabling its sensors and profilers to execute analytics without relying on external PCs. Its differentiator lies in direct sales and localized technical support, ensuring rapid deployment and adoption in customer facilities. With strong profitability metrics and double-digit revenue growth in Asia, Keyence is positioned to further expand its influence in Europe and North America through automation-driven investments.
Basler AG: Basler AG is recognized as an innovator in the global vision systems market, with a focus on industrial and embedded cameras. The company has built its reputation on delivering cost-effective, high-performance vision components tailored for 3D imaging, robotics, and smart factories. In 2025, Basler continues to benefit from partnerships with AI software providers that extend the value of its camera portfolio.
Strategic initiatives include expanding its embedded vision platforms and deepening its presence in Asia Pacific through joint ventures with automation integrators. Basler’s competitive edge lies in its ability to deliver standardized, modular camera solutions that integrate easily with AI-driven 3D software. Its pricing strategy positions it well against larger incumbents, making it a preferred vendor for SMEs pursuing cost-efficient automation upgrades.
Path Robotics: Path Robotics positions itself as a disruptor in AI-driven robotic welding and assembly. The company’s differentiator is its proprietary AI vision software that enables robots to learn complex 3D tasks such as weld seam detection and adaptive path planning. Unlike traditional vision vendors, Path Robotics integrates AI-based 3D vision directly into autonomous robotic systems, creating an end-to-end automation solution.
By 2025, Path Robotics has scaled its market presence through partnerships with automotive and heavy machinery OEMs. The company continues to attract venture and growth capital, fueling R&D in adaptive 3D perception and autonomous manufacturing cells. Its strong foothold in North America positions it to capture a growing share of industrial automation budgets as manufacturers look for turnkey systems that reduce labor dependency and improve throughput.
Market Key Players
SewerAI
Basler AG
Orbital Insight
Mashgin
Keyence Corporation
KITWARE
Skyrora
Cognex Corporation
Path Robotics
Proprio
THALES
New Frontier Aerospace, Inc.
Other Key Players
Driver
Automation and Zero-Defect Targets Accelerate 3D Vision Adoption
By 2025, automation and zero-defect targets are lifting demand for AI-based 3D vision across assembly, packaging, and logistics. The 3D machine vision segment is projected to grow at roughly 14 percent CAGR through 2030 as plants add vision-guided robotics and inline metrology to hit tighter ppm thresholds. You see the same push in warehouses as 3D sensors steer AMRs for picking and depalletizing. This sustained spend signals durable equipment and software budgets, not one-off pilots.
High-Throughput Analytics and Smart Cameras Drive Line Upgrades
The strategic impact is clear. Vendors with high-throughput inspection and accurate point-cloud analytics will win line upgrades and multi-site rollouts. Smart-camera systems are set to post the fastest growth inside machine vision through 2030, which shifts competitive focus to on-device AI and easier commissioning. Expect larger orders from automotive, electronics, and consumer goods as buyers standardize around proven 3D cells.
Restraint
Upfront Costs and Integration Complexity Slow Adoption
High upfront costs and integration complexity remain the main brake on adoption, especially for mid-market manufacturers. Implementations often require premium sensors, optics, lighting, and compute, plus custom integration with PLCs and MES. Analysts continue to flag initial investment and system complexity as top hurdles to machine-vision scale.
Skills Gaps and Workforce Constraints Extend Payback Cycles
Talent constraints compound the issue. In 2025, a large share of manufacturers cite workforce limitations as a barrier to faster AI deployment, which slows commissioning and model maintenance for 3D inspection. This skills gap stretches payback periods and pushes some buyers to defer upgrades or narrow scope to simpler 2D tasks.
Opportunity
Edge AI and Connected 3D Sensors Unlock New Revenue
Edge AI and connected 3D sensors open new profit pools in logistics measurement, EV battery assembly, and medical device QA. Market trackers project the 3D machine vision category to expand at about 14 percent CAGR from 2025, with absolute market value more than tripling by the mid-2030s under the most bullish scenarios. You can target retrofit kits and subscription analytics that compress time to value.
Smart Cameras and Domain Models Create Recurring Revenue Streams
Vendor momentum strengthens the case. Smart cameras are expected to post the highest growth rates within machine vision to 2030, while adjacent 3D camera shipments are set to grow near 17 percent CAGR from 2025 to 2030. Suppliers that pair compact hardware with domain models for defect classification and volumetric measurement can capture recurring software and services revenue.
Trend
Shift Toward Edge Inference and Integrated Depth Capabilities
The industry is shifting from PC-centric cells to on-device inference. Smart cameras with NPUs and integrated depth are moving decisions to the edge, cutting latency and install time. The competitive landscape is active; market leaders held double-digit global shares in 2024 and continue to invest in 3D portfolios, while RealSense’s 2025 spin-out underscores renewed capital formation around depth sensing for robotics. Expect faster release cycles and tighter camera-software stacks.
Interoperability and Standards Drive Scalable Deployment
Standards work is also gaining importance. Buyers seek interoperable components that reduce integration risk across cameras, lighting, robots, and PLCs. Industry bodies and research groups continue to push 3D measurement and interface standards, which should lower engineering hours per cell and accelerate multi-plant replication. Your roadmap should prioritize edge-capable products that speak common protocols and ship with validated application kits.
Recent Developments
Dec 2024 – Zivid: Announced immediate availability of the Zivid 2+ R-series industrial 3D cameras, targeting robot-mounted picking, parcel induction, and inspection cells. The launch expanded the company’s lineup with higher-throughput models positioned for logistics and mixed-model assembly. This broadens Zivid’s installed base entering 2025 and strengthens channel pull across North America and Europe.
Jan 2025 – Cognex: Introduced AI-powered DataMan 290 and 390 barcode readers for factory and logistics traceability, adding pretrained edge-learning to improve decode rates and lower setup time. The release aligns Cognex’s ID portfolio with AI inspection workflows and supports upsell into 3D vision cells in packaging and e-commerce.
May 2025 – Photoneo: Launched MotionCam-3D Color (Blue), citing 25 percent better reconstruction on reflective and transparent objects and higher dynamic range for high-speed automation. The upgrade reduces miss-reads in challenging materials and raises 3D inspection reliability for electronics and consumer goods lines.
Jun 2025 – Cognex: Announced OneVision, a cloud platform for building and scaling AI machine-vision applications across plants; the rollout targets faster model training and centralized deployment. The move shifts part of Cognex’s value to software and recurring services while reinforcing its leadership in multi-site 3D QA programs.
Jul 2025 – Basler: Introduced the Basler Stereo ace series, six active 3D stereo camera models calibrated at the factory for faster commissioning in robotics and metrology. The launch adds a price-performance play for OEMs and integrators and expands Basler’s 3D coverage in APAC and Europe.
Oct 2025 – RealSense: Completed spin-out from Intel with a USD 50 million Series A and a strategic collaboration with NVIDIA focused on humanoids and AMRs. The new structure positions RealSense to scale depth-camera roadmaps and compete more aggressively in AI-ready 3D perception for robotics.