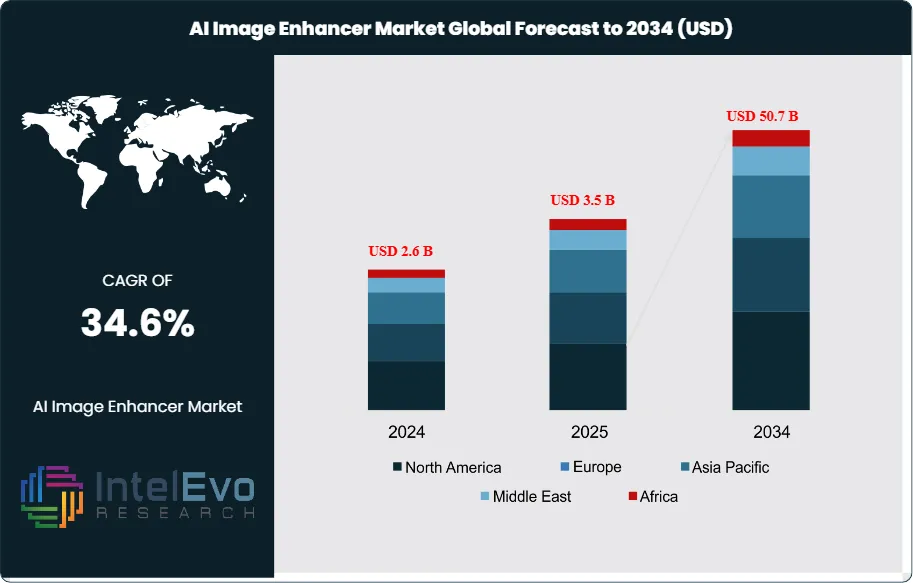
The AI Image Enhancer Market was valued at approximately USD 2.6 billion in 2024 and is projected to reach nearly USD 50.7 billion by 2034, reflecting strong long-term expansion. Based on the projected growth trajectory, the market size for 2025 is estimated at around USD 3.5 billion. Beginning in 2026, the market is expected to grow at a compound annual growth rate (CAGR) of about 34.6% from 2026 to 2034, ultimately achieving a valuation of approximately USD 50.7 billion by 2034.
Rapid advances in deep learning, computer vision, and cloud infrastructure drive this expansion as enterprises automate image optimization across digital channels. Vendors embed enhancement engines into content management, design, and workflow platforms, which raises processing throughput and lowers manual editing costs. As organizations scale digital assets for omnichannel engagement, demand rises for tools that deliver consistent quality, higher resolution, and improved visual clarity at speed and volume.
The market’s core value proposition lies in its ability to refine details, remove noise, correct exposure, and adapt images to diverse formats with minimal human intervention. Adoption is accelerating in e-commerce and advertising, where enhanced visuals improve click-through rates, conversion, and brand perception. Healthcare providers deploy AI-based enhancement to support diagnostic imaging workflows, while media and entertainment companies apply these tools to remaster content, upscale video, and streamline post-production. This demand side meets a supply base of software firms, cloud hyperscalers, and specialist start-ups that compete on model accuracy, processing latency, integration depth, and pricing flexibility. Data protection rules, AI governance frameworks, and content authenticity regulations shape product design, pushing vendors to incorporate auditability, watermarking, and responsible data practices.
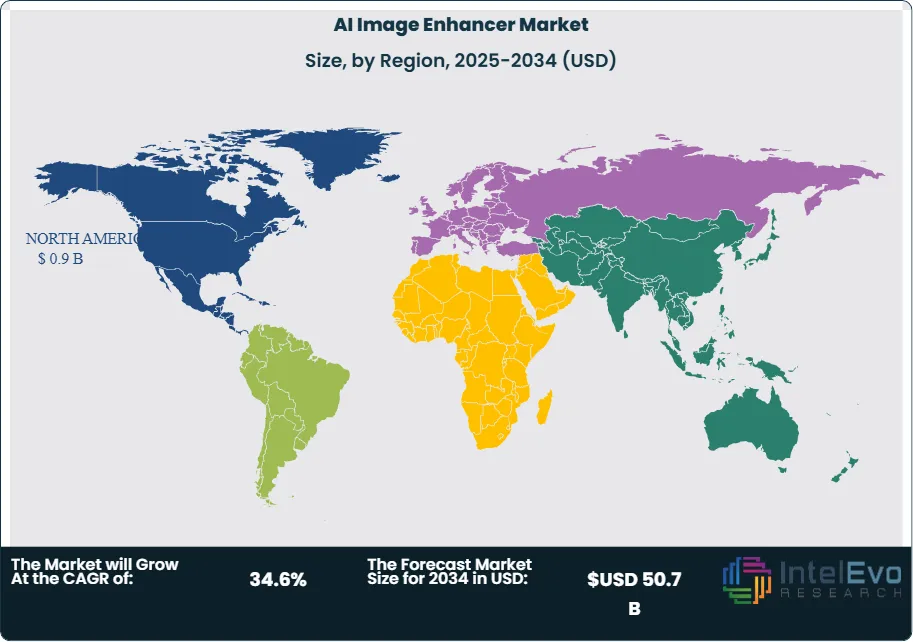
In 2024, North America accounts for about 35.3% of global revenue, or approximately USD 0.9 billion, supported by strong technology infrastructure, high digital ad spend, and early enterprise AI adoption. Europe follows with rising investment in compliant AI solutions, while Asia Pacific emerges as the fastest-growing region, driven by large online retail ecosystems and mobile-first consumers. Key risk factors include bias in training data, IP disputes over generated or altered content, and dependence on third-party cloud platforms. However, continuing advances in generative models, edge deployment, and real-time enhancement capabilities expand use cases across retail, fintech, automotive, and smart cities. Investment activity intensifies in platforms that combine enhancement with asset management, analytics, and workflow orchestration to capture value from end-to-end visual content lifecycles. As budgets shift toward automated content production and personalization, AI image enhancement becomes a foundational layer in the broader digital experience and visual computing stack.
Key Takeaways
Market Growth: The global AI image enhancer market grows from 2.6 billion USD, 2024 to 50.7 billion USD, 2034, reflecting a compound annual growth rate of 34.6%, 2024-2034. This expansion indicates strong monetization of AI-driven visual workflows across industries.
Segment Dominance : Software solutions lead the offering landscape with a 73.7% revenue share, 2024, as enterprises favor flexible, scalable enhancement tools over hardware-heavy deployments. This dominance supports recurring license and subscription models with estimated: 2.0 billion USD, 2026 in cumulative software billings.
Segment Dominance: Real-time image enhancement commands 80.5% share, 2024, as customers prioritize instant visual processing for streaming, capture, and in-app experiences. Batch processing solutions retain a smaller but relevant role with estimated: 19.5% share, 2024.
Driver: Deep learning-based technologies account for 38.8% of deployments, 2024, and drive automation of complex enhancement tasks at scale. Rising integration into consumer devices and platforms could lift deep learning-based penetration to estimated: 55.0%, 2030.
Restraint: High compute requirements and model deployment costs create barriers for smaller vendors, with an estimated: 0.5 billion USD, 2024 in incremental infrastructure spend across the ecosystem. These cost pressures may compress provider margins by estimated: 5.0%, 2024 in highly competitive segments.
Opportunity: Consumer electronics holds 28.5% market share, 2024, as smartphones and smart devices embed AI enhancement engines natively. Expansion into mid-range devices and emerging markets could raise this share to estimated: 40.0%, 2030, unlocking new licensing and chipset design opportunities.
Trend: Vendors shift toward integrated, real-time enhancement pipelines, leveraging 80.5% real-time adoption, 2024 to support live streaming, AR, and social content. Over 2024-2034, platform roadmaps increasingly bundle enhancement with analytics and creation tools, targeting estimated: 60.0% of digital content workflows, 2034.
Regional Analysis: North America leads with a 35.3% share and 0.9 billion USD revenue, 2024, underpinned by high AI and cloud adoption. Within this, the US contributes 0.78 billion USD, 2024 and advances at a 32.7% CAGR, 2024-2034, while other regions collectively account for an estimated: 1.8 billion USD, 2024 in revenue and catch-up growth potential.
By Solution
The solution landscape continues to tilt strongly toward software as you enter 2025. Software platforms accounted for about 73.7% of global AI image enhancer revenue in 2024 and are projected to retain well above a 70% share through 2030 as adoption deepens across marketing, media, healthcare, and retail workflows. Cloud-based deployment leads within this segment, often representing 60–65% of software revenue, as organizations prefer browser-based access, elastic compute, and rapid feature updates. On-premise software still plays a role in sectors such as healthcare, banking, and public safety, where data residency and latency remain critical; here you see more controlled rollouts and longer upgrade cycles.
Services form a smaller but faster-growing part of the market. Implementation and integration services expand at an estimated CAGR of 20–25% from 2025 to 2030 as enterprises tie AI image enhancement into content management, DAM platforms, and creative suites. Consulting and training services help your teams standardize workflows, manage change, and set governance rules for AI use, particularly in regulated industries. Support and maintenance contracts also gain importance as you scale models across regions and devices, with recurring service revenue increasingly bundled into multi-year software agreements.
By Type
Real-time image enhancement dominates the market as of 2024, with an estimated 80.5% share, and is expected to remain the primary growth engine through 2030. This type supports live streaming, social video, virtual events, and interactive commerce, where your customers expect sharp, well-lit visuals in milliseconds. As 5G and fiber broadband expand, more platforms embed live enhancement directly into cameras, conferencing tools, and streaming pipelines, driving double-digit growth in this segment.
Batch image enhancement continues to serve critical use cases, particularly in large-scale content libraries and archival processes. You see it applied in media restoration, bulk product catalog updates, insurance claims processing, and satellite imagery. While batch workloads grow more slowly, often in the high single digits annually, they remain important where you need consistent quality for high volumes of images processed overnight or in scheduled workflows. Many vendors now offer hybrid models that combine real-time processing at the edge with batch jobs in the cloud to align with your operational and cost priorities.
By Technology
Deep learning-based enhancers held around 38.8% share in 2024 and set the technical benchmark for image quality. Convolutional neural networks and transformer-based models now deliver strong gains in sharpness, noise reduction, and low-light performance with minimal manual tuning. As training datasets expand and model architectures improve, you can expect deep learning to approach or exceed 50% share by 2030, especially in high-value segments like healthcare imaging, premium consumer devices, and professional content production.
Traditional AI image enhancement, including rule-based and classical computer vision approaches, retains relevance in constrained environments. These methods often require less compute and suit lower-cost devices or applications with strict latency and reliability requirements. At the same time, Generative Adversarial Networks and related generative models grow quickly from a smaller base. They support advanced use cases such as super-resolution, smart inpainting, and style transfer for retail, entertainment, and design. By 2030, GAN-based solutions could account for 20–25% of technology share, particularly in your applications that focus on creative quality and personalization.
By End-User Industry
Consumer electronics remains the largest end-user segment, with about 28.5% share in 2024, and continues to set expectations for visual quality in 2025 and beyond. Smartphone makers, PC vendors, smart TV brands, and camera manufacturers embed AI image enhancers directly into devices to improve low-light shots, video calls, and real-time filters. As unit shipments of AI-capable smartphones and connected devices grow, you can expect this segment to maintain a strong mid-20s to low-30s percentage share over the next five years.
E-commerce and retail represent another core growth area as your product teams seek higher conversion rates and reduced content production costs. AI image enhancers support consistent product imagery, automated background cleaning, and rapid adaptation of visuals for different channels and regions. Automotive, including in-cabin monitoring and advanced driver assistance systems, adds further demand for robust, low-latency enhancement. Other industries, such as healthcare, security, and industrial inspection, contribute a growing share as you adapt AI imaging to specialized operational requirements.
By Region
North America led the market in 2024 with roughly 35.3% share and around 0.9 billion USD in revenue, supported by strong investment from technology companies and early enterprise adoption. The United States remains the anchor market, with large installed bases in cloud infrastructure, creative software, and digital media. As you plan for 2025–2030, North America is expected to sustain a high-teens CAGR, driven by expanded use across marketing, streaming, and healthcare imaging.
Europe follows with a sizeable share, supported by demand from media, automotive, and industrial firms, but it grows within a stricter regulatory environment focused on AI transparency and data protection. Asia Pacific emerges as the fastest-growing region, often projected to expand at above 20% CAGR through 2030, powered by large online marketplaces, social commerce platforms, and high smartphone penetration in China, India, and Southeast Asia. Latin America and the Middle East & Africa start from smaller bases but show rising adoption as connectivity improves and local content ecosystems mature, giving you a set of emerging markets with strong medium-term upside.
By Solution (Software, Services), By Type (Real-Time Image Enhancement, Batch Image Enhancement), By Technology (Deep Learning-Based Enhancers, Traditional AI Image Enhancement, Generative Adversarial Networks (GANs), Others), By End-User Industry (Consumer Electronics, Media and Entertainment, Healthcare, Automotive, E-Commerce and Retail, Others)
Research Methodology
Primary Research- 100 Interviews of Stakeholders
Secondary Research
Desk Research
Regional scope
North America (United States, Canada, Mexico)
Latin America (Brazil, Argentina, Columbia)
East Asia And Pacific (China, Japan, South Korea, Australia, Cambodia, Fiji, Indonesia)
Sea And South Asia (India, Singapore, Thailand, Taiwan, Malaysia)
Eastern Europe (Poland, Russia, Czech Republic, Romania)
Western Europe (Germany, U.K., France, Spain, Itlay)
Middle East & Africa (GCC Countries, Egypt, Nigeria, South Africa, Israel)
Customization for segments, region/country-level will be provided. Moreover, additional customization can be done based on the requirements.
Pricing and Purchase Options
Avail customized purchase options to meet your exact research needs. We have three licenses to opt for: Single User License, Multi-User License (Up to 5 Users), Corporate Use License (Unlimited User and Printable PDF).
TABLE OF CONTENTS
1. EXECUTIVE SUMMARY
1.1. MARKET SNAPSHOT
1.2. KEY FINDINGS & INSIGHTS
1.3. ANALYST RECOMMENDATIONS
1.4. FUTURE OUTLOOK
2. RESEARCH METHODOLOGY
2.1. MARKET DEFINITION & SCOPE
2.2. RESEARCH OBJECTIVES: PRIMARY & SECONDARY DATA SOURCES
2.3. DATA COLLECTION SOURCES
2.3.1. COVERAGE OF 100+ PRIMARY RESEARCH/CONSULTATION CALLS WITH INDUSTRY STAKEHOLDERS
FIGURE 17 NORTH AMERICA AI IMAGE ENHANCERCURRENT AND FUTURE TYPE ANALYSIS, 2025–2034, (USD MILLION)
FIGURE 18 NORTH AMERICA AI IMAGE ENHANCERCURRENT AND FUTURE END USER ANALYSIS, 2025–2034, (USD MILLION)
FIGURE 19 MARKET SHARE BY COUNTRY
FIGURE 20 LATIN AMERICA AI IMAGE ENHANCERCURRENT AND FUTURE TYPE ANALYSIS, 2025–2034, (USD MILLION)
FIGURE 21 LATIN AMERICA AI IMAGE ENHANCERCURRENT AND FUTURE END USER ANALYSIS, 2025–2034, (USD MILLION)
FIGURE 22 MARKET SHARE BY COUNTRY
FIGURE 23 EASTERN EUROPE AI IMAGE ENHANCERCURRENT AND FUTURE TYPE ANALYSIS, 2025–2034, (USD MILLION)
FIGURE 24 EASTERN EUROPE AI IMAGE ENHANCERCURRENT AND FUTURE END USER ANALYSIS, 2025–2034, (USD MILLION)
FIGURE 25 MARKET SHARE BY COUNTRY
FIGURE 26 WESTERN EUROPE AI IMAGE ENHANCERCURRENT AND FUTURE TYPE ANALYSIS, 2025–2034, (USD MILLION)
FIGURE 27 WESTERN EUROPE AI IMAGE ENHANCERCURRENT AND FUTURE END USER ANALYSIS, 2025–2034, (USD MILLION)
FIGURE 28 MARKET SHARE BY COUNTRY
FIGURE 29 EAST ASIA AND PACIFIC AI IMAGE ENHANCERCURRENT AND FUTURE TYPE ANALYSIS, 2025–2034, (USD MILLION)
FIGURE 30 EAST ASIA AND PACIFIC AI IMAGE ENHANCERCURRENT AND FUTURE END USER ANALYSIS, 2025–2034, (USD MILLION)
FIGURE 31 MARKET SHARE BY COUNTRY
FIGURE 32 SEA AND SOUTH ASIA AI IMAGE ENHANCERCURRENT AND FUTURE TYPE ANALYSIS, 2025–2034, (USD MILLION)
FIGURE 33 SEA AND SOUTH ASIA AI IMAGE ENHANCERCURRENT AND FUTURE END USER ANALYSIS, 2025–2034, (USD MILLION)
FIGURE 34 MARKET SHARE BY COUNTRY
FIGURE 35 MIDDLE EAST AND AFRICA AI IMAGE ENHANCERCURRENT AND FUTURE TYPE ANALYSIS, 2025–2034, (USD MILLION)
FIGURE 36 MIDDLE EAST AND AFRICA AI IMAGE ENHANCERCURRENT AND FUTURE END USER ANALYSIS, 2025–2034, (USD MILLION)
FIGURE 37 NORTH AMERICA AI IMAGE ENHANCERCURRENT AND FUTURE MARKET VOLUME SHARE REGIONAL ANALYSIS, 2025–2034, (USD MILLION)
FIGURE 38 U.S. AI IMAGE ENHANCERCURRENT AND FUTURE TYPE ANALYSIS, 2025–2034, (USD MILLION)
FIGURE 39 U.S. AI IMAGE ENHANCERCURRENT AND FUTURE END USER ANALYSIS, 2025–2034, (USD MILLION)
FIGURE 40 CANADA AI IMAGE ENHANCERCURRENT AND FUTURE TYPE ANALYSIS, 2025–2034, (USD MILLION)
FIGURE 41 CANADA AI IMAGE ENHANCERCURRENT AND FUTURE END USER ANALYSIS, 2025–2034, (USD MILLION)
FIGURE 42 LATIN AMERICA AI IMAGE ENHANCERCURRENT AND FUTURE MARKET VOLUME SHARE REGIONAL ANALYSIS, 2025–2034, (USD MILLION)
FIGURE 43 MEXICO AI IMAGE ENHANCERCURRENT AND FUTURE TYPE ANALYSIS, 2025–2034, (USD MILLION)
FIGURE 44 MEXICO AI IMAGE ENHANCERCURRENT AND FUTURE END USER ANALYSIS, 2025–2034, (USD MILLION)
FIGURE 45 BRAZIL AI IMAGE ENHANCERCURRENT AND FUTURE TYPE ANALYSIS, 2025–2034, (USD MILLION)
FIGURE 46 BRAZIL AI IMAGE ENHANCERCURRENT AND FUTURE END USER ANALYSIS, 2025–2034, (USD MILLION)
FIGURE 47 ARGENTINA AI IMAGE ENHANCERCURRENT AND FUTURE TYPE ANALYSIS, 2025–2034, (USD MILLION)
FIGURE 48 ARGENTINA AI IMAGE ENHANCERCURRENT AND FUTURE END USER ANALYSIS, 2025–2034, (USD MILLION)
FIGURE 49 COLUMBIA AI IMAGE ENHANCERCURRENT AND FUTURE TYPE ANALYSIS, 2025–2034, (USD MILLION)
FIGURE 50 COLUMBIA AI IMAGE ENHANCERCURRENT AND FUTURE END USER ANALYSIS, 2025–2034, (USD MILLION)
FIGURE 51 REST OF LATIN AMERICA AI IMAGE ENHANCERCURRENT AND FUTURE TYPE ANALYSIS, 2025–2034, (USD MILLION)
FIGURE 52 REST OF LATIN AMERICA AI IMAGE ENHANCERCURRENT AND FUTURE END USER ANALYSIS, 2025–2034, (USD MILLION)
FIGURE 53 EASTERN EUROPE AI IMAGE ENHANCERCURRENT AND FUTURE MARKET VOLUME SHARE REGIONAL ANALYSIS, 2025–2034, (USD MILLION)
FIGURE 54 POLAND AI IMAGE ENHANCERCURRENT AND FUTURE TYPE ANALYSIS, 2025–2034, (USD MILLION)
FIGURE 55 POLAND AI IMAGE ENHANCERCURRENT AND FUTURE END USER ANALYSIS, 2025–2034, (USD MILLION)
FIGURE 56 RUSSIA AI IMAGE ENHANCERCURRENT AND FUTURE TYPE ANALYSIS, 2025–2034, (USD MILLION)
FIGURE 57 RUSSIA AI IMAGE ENHANCERCURRENT AND FUTURE END USER ANALYSIS, 2025–2034, (USD MILLION)
FIGURE 58 CZECH REPUBLIC AI IMAGE ENHANCERCURRENT AND FUTURE TYPE ANALYSIS, 2025–2034, (USD MILLION)
FIGURE 59 CZECH REPUBLIC AI IMAGE ENHANCERCURRENT AND FUTURE END USER ANALYSIS, 2025–2034, (USD MILLION)
FIGURE 60 ROMANIA AI IMAGE ENHANCERCURRENT AND FUTURE TYPE ANALYSIS, 2025–2034, (USD MILLION)
FIGURE 61 ROMANIA AI IMAGE ENHANCERCURRENT AND FUTURE END USER ANALYSIS, 2025–2034, (USD MILLION)
FIGURE 62 REST OF EASTERN EUROPE AI IMAGE ENHANCERCURRENT AND FUTURE TYPE ANALYSIS, 2025–2034, (USD MILLION)
FIGURE 63 REST OF EASTERN EUROPE AI IMAGE ENHANCERCURRENT AND FUTURE END USER ANALYSIS, 2025–2034, (USD MILLION)
FIGURE 64 WESTERN EUROPE AI IMAGE ENHANCERCURRENT AND FUTURE MARKET VOLUME SHARE REGIONAL ANALYSIS, 2025–2034, (USD MILLION)
FIGURE 65 GERMANY AI IMAGE ENHANCERCURRENT AND FUTURE TYPE ANALYSIS, 2025–2034, (USD MILLION)
FIGURE 66 GERMANY AI IMAGE ENHANCERCURRENT AND FUTURE END USER ANALYSIS, 2025–2034, (USD MILLION)
FIGURE 67 FRANCE AI IMAGE ENHANCERCURRENT AND FUTURE TYPE ANALYSIS, 2025–2034, (USD MILLION)
FIGURE 68 FRANCE AI IMAGE ENHANCERCURRENT AND FUTURE END USER ANALYSIS, 2025–2034, (USD MILLION)
FIGURE 69 UK AI IMAGE ENHANCERCURRENT AND FUTURE TYPE ANALYSIS, 2025–2034, (USD MILLION)
FIGURE 70 UK AI IMAGE ENHANCERCURRENT AND FUTURE END USER ANALYSIS, 2025–2034, (USD MILLION)
FIGURE 71 SPAIN AI IMAGE ENHANCERCURRENT AND FUTURE TYPE ANALYSIS, 2025–2034, (USD MILLION)
FIGURE 72 SPAIN AI IMAGE ENHANCERCURRENT AND FUTURE END USER ANALYSIS, 2025–2034, (USD MILLION)
FIGURE 73 ITALY AI IMAGE ENHANCERCURRENT AND FUTURE TYPE ANALYSIS, 2025–2034, (USD MILLION)
FIGURE 74 ITALY AI IMAGE ENHANCERCURRENT AND FUTURE END USER ANALYSIS, 2025–2034, (USD MILLION)
FIGURE 75 REST OF WESTERN EUROPE AI IMAGE ENHANCERCURRENT AND FUTURE TYPE ANALYSIS, 2025–2034, (USD MILLION)
FIGURE 76 REST OF WESTERN EUROPE AI IMAGE ENHANCERCURRENT AND FUTURE END USER ANALYSIS, 2025–2034, (USD MILLION)
FIGURE 77 EAST ASIA AND PACIFIC AI IMAGE ENHANCERCURRENT AND FUTURE MARKET VOLUME SHARE REGIONAL ANALYSIS, 2025–2034, (USD MILLION)
FIGURE 78 CHINA AI IMAGE ENHANCERCURRENT AND FUTURE TYPE ANALYSIS, 2025–2034, (USD MILLION)
FIGURE 79 CHINA AI IMAGE ENHANCERCURRENT AND FUTURE END USER ANALYSIS, 2025–2034, (USD MILLION)
FIGURE 80 JAPAN AI IMAGE ENHANCERCURRENT AND FUTURE TYPE ANALYSIS, 2025–2034, (USD MILLION)
FIGURE 81 JAPAN AI IMAGE ENHANCERCURRENT AND FUTURE END USER ANALYSIS, 2025–2034, (USD MILLION)
FIGURE 82 AUSTRALIA AI IMAGE ENHANCERCURRENT AND FUTURE TYPE ANALYSIS, 2025–2034, (USD MILLION)
FIGURE 83 AUSTRALIA AI IMAGE ENHANCERCURRENT AND FUTURE END USER ANALYSIS, 2025–2034, (USD MILLION)
FIGURE 84 CAMBODIA AI IMAGE ENHANCERCURRENT AND FUTURE TYPE ANALYSIS, 2025–2034, (USD MILLION)
FIGURE 85 CAMBODIA AI IMAGE ENHANCERCURRENT AND FUTURE END USER ANALYSIS, 2025–2034, (USD MILLION)
FIGURE 86 FIJI AI IMAGE ENHANCERCURRENT AND FUTURE TYPE ANALYSIS, 2025–2034, (USD MILLION)
FIGURE 87 FIJI AI IMAGE ENHANCERCURRENT AND FUTURE END USER ANALYSIS, 2025–2034, (USD MILLION)
FIGURE 88 INDONESIA AI IMAGE ENHANCERCURRENT AND FUTURE TYPE ANALYSIS, 2025–2034, (USD MILLION)
FIGURE 89 INDONESIA AI IMAGE ENHANCERCURRENT AND FUTURE END USER ANALYSIS, 2025–2034, (USD MILLION)
FIGURE 90 SOUTH KOREA AI IMAGE ENHANCERCURRENT AND FUTURE TYPE ANALYSIS, 2025–2034, (USD MILLION)
FIGURE 91 SOUTH KOREA AI IMAGE ENHANCERCURRENT AND FUTURE END USER ANALYSIS, 2025–2034, (USD MILLION)
FIGURE 92 REST OF EAST ASIA AND PACIFIC AI IMAGE ENHANCERCURRENT AND FUTURE TYPE ANALYSIS, 2025–2034, (USD MILLION)
FIGURE 93 REST OF EAST ASIA AND PACIFIC AI IMAGE ENHANCERCURRENT AND FUTURE END USER ANALYSIS, 2025–2034, (USD MILLION)
FIGURE 94 SEA AND SOUTH ASIA AI IMAGE ENHANCERCURRENT AND FUTURE MARKET VOLUME SHARE REGIONAL ANALYSIS, 2025–2034, (USD MILLION)
FIGURE 95 BANGLADESH AI IMAGE ENHANCERCURRENT AND FUTURE TYPE ANALYSIS, 2025–2034, (USD MILLION)
FIGURE 96 BANGLADESH AI IMAGE ENHANCERCURRENT AND FUTURE END USER ANALYSIS, 2025–2034, (USD MILLION)
FIGURE 97 NEW ZEALAND AI IMAGE ENHANCERCURRENT AND FUTURE TYPE ANALYSIS, 2025–2034, (USD MILLION)
FIGURE 98 NEW ZEALAND AI IMAGE ENHANCERCURRENT AND FUTURE END USER ANALYSIS, 2025–2034, (USD MILLION)
FIGURE 99 INDIA AI IMAGE ENHANCERCURRENT AND FUTURE TYPE ANALYSIS, 2025–2034, (USD MILLION)
FIGURE 100 INDIA AI IMAGE ENHANCERCURRENT AND FUTURE END USER ANALYSIS, 2025–2034, (USD MILLION)
FIGURE 101 SINGAPORE AI IMAGE ENHANCERCURRENT AND FUTURE TYPE ANALYSIS, 2025–2034, (USD MILLION)
FIGURE 102 SINGAPORE AI IMAGE ENHANCERCURRENT AND FUTURE END USER ANALYSIS, 2025–2034, (USD MILLION)
FIGURE 103 THAILAND AI IMAGE ENHANCERCURRENT AND FUTURE TYPE ANALYSIS, 2025–2034, (USD MILLION)
FIGURE 104 THAILAND AI IMAGE ENHANCERCURRENT AND FUTURE END USER ANALYSIS, 2025–2034, (USD MILLION)
FIGURE 105 TAIWAN AI IMAGE ENHANCERCURRENT AND FUTURE TYPE ANALYSIS, 2025–2034, (USD MILLION)
FIGURE 106 TAIWAN AI IMAGE ENHANCERCURRENT AND FUTURE END USER ANALYSIS, 2025–2034, (USD MILLION)
FIGURE 107 MALAYSIA AI IMAGE ENHANCERCURRENT AND FUTURE TYPE ANALYSIS, 2025–2034, (USD MILLION)
FIGURE 108 MALAYSIA AI IMAGE ENHANCERCURRENT AND FUTURE END USER ANALYSIS, 2025–2034, (USD MILLION)
FIGURE 109 REST OF SEA AND SOUTH ASIA AI IMAGE ENHANCERCURRENT AND FUTURE TYPE ANALYSIS, 2025–2034, (USD MILLION)
FIGURE 110 REST OF SEA AND SOUTH ASIA AI IMAGE ENHANCERCURRENT AND FUTURE END USER ANALYSIS, 2025–2034, (USD MILLION)
FIGURE 111 MIDDLE EAST AND AFRICA AI IMAGE ENHANCERCURRENT AND FUTURE MARKET VOLUME SHARE REGIONAL ANALYSIS, 2025–2034, (USD MILLION)
FIGURE 112 GCC COUNTRIES AI IMAGE ENHANCERCURRENT AND FUTURE TYPE ANALYSIS, 2025–2034, (USD MILLION)
FIGURE 113 GCC COUNTRIES AI IMAGE ENHANCERCURRENT AND FUTURE END USER ANALYSIS, 2025–2034, (USD MILLION)
FIGURE 114 SAUDI ARABIA AI IMAGE ENHANCERCURRENT AND FUTURE TYPE ANALYSIS, 2025–2034, (USD MILLION)
FIGURE 115 SAUDI ARABIA AI IMAGE ENHANCERCURRENT AND FUTURE END USER ANALYSIS, 2025–2034, (USD MILLION)
FIGURE 116 UAE AI IMAGE ENHANCERCURRENT AND FUTURE TYPE ANALYSIS, 2025–2034, (USD MILLION)
FIGURE 117 UAE AI IMAGE ENHANCERCURRENT AND FUTURE END USER ANALYSIS, 2025–2034, (USD MILLION)
FIGURE 118 BAHRAIN AI IMAGE ENHANCERCURRENT AND FUTURE TYPE ANALYSIS, 2025–2034, (USD MILLION)
FIGURE 119 BAHRAIN AI IMAGE ENHANCERCURRENT AND FUTURE END USER ANALYSIS, 2025–2034, (USD MILLION)
FIGURE 120 KUWAIT AI IMAGE ENHANCERCURRENT AND FUTURE TYPE ANALYSIS, 2025–2034, (USD MILLION)
FIGURE 121 KUWAIT AI IMAGE ENHANCERCURRENT AND FUTURE END USER ANALYSIS, 2025–2034, (USD MILLION)
FIGURE 122 OMAN AI IMAGE ENHANCERCURRENT AND FUTURE TYPE ANALYSIS, 2025–2034, (USD MILLION)
FIGURE 123 OMAN AI IMAGE ENHANCERCURRENT AND FUTURE END USER ANALYSIS, 2025–2034, (USD MILLION)
FIGURE 124 QATAR AI IMAGE ENHANCERCURRENT AND FUTURE TYPE ANALYSIS, 2025–2034, (USD MILLION)
FIGURE 125 QATAR AI IMAGE ENHANCERCURRENT AND FUTURE END USER ANALYSIS, 2025–2034, (USD MILLION)
FIGURE 126 EGYPT AI IMAGE ENHANCERCURRENT AND FUTURE TYPE ANALYSIS, 2025–2034, (USD MILLION)
FIGURE 127 EGYPT AI IMAGE ENHANCERCURRENT AND FUTURE END USER ANALYSIS, 2025–2034, (USD MILLION)
FIGURE 128 NIGERIA AI IMAGE ENHANCERCURRENT AND FUTURE TYPE ANALYSIS, 2025–2034, (USD MILLION)
FIGURE 129 NIGERIA AI IMAGE ENHANCERCURRENT AND FUTURE END USER ANALYSIS, 2025–2034, (USD MILLION)
FIGURE 130 SOUTH AFRICA AI IMAGE ENHANCERCURRENT AND FUTURE TYPE ANALYSIS, 2025–2034, (USD MILLION)
FIGURE 131 SOUTH AFRICA AI IMAGE ENHANCERCURRENT AND FUTURE END USER ANALYSIS, 2025–2034, (USD MILLION)
FIGURE 132 ISRAEL AI IMAGE ENHANCERCURRENT AND FUTURE TYPE ANALYSIS, 2025–2034, (USD MILLION)
FIGURE 133 ISRAEL AI IMAGE ENHANCERCURRENT AND FUTURE END USER ANALYSIS, 2025–2034, (USD MILLION)
FIGURE 134 REST OF MEA AI IMAGE ENHANCERCURRENT AND FUTURE TYPE ANALYSIS, 2025–2034, (USD MILLION)
FIGURE 135 REST OF MEA AI IMAGE ENHANCERCURRENT AND FUTURE END USER ANALYSIS, 2025–2034, (USD MILLION)
FIGURE 136 U. S. MARKET SHARE ANALYSIS BY TYPE (2024)
FIGURE 137 U. S. MARKET SHARE ANALYSIS BY END USER (2024)
FIGURE 138 CANADA MARKET SHARE ANALYSIS BY TYPE (2024)
FIGURE 139 CANADA MARKET SHARE ANALYSIS BY END USER (2024)
FIGURE 140 MEXICO MARKET SHARE ANALYSIS BY TYPE (2024)
FIGURE 141 MEXICO MARKET SHARE ANALYSIS BY END USER (2024)
FIGURE 142 CHINA MARKET SHARE ANALYSIS BY TYPE (2024)
FIGURE 143 CHINA MARKET SHARE ANALYSIS BY END USER (2024)
FIGURE 144 JAPAN MARKET SHARE ANALYSIS BY TYPE (2024)
FIGURE 145 JAPAN MARKET SHARE ANALYSIS BY END USER (2024)
FIGURE 146 INDIA MARKET SHARE ANALYSIS BY TYPE (2024)
FIGURE 147 INDIA MARKET SHARE ANALYSIS BY END USER (2024)
FIGURE 148 SOUTH KOREA MARKET SHARE ANALYSIS BY TYPE (2024)
FIGURE 149 SOUTH KOREA MARKET SHARE ANALYSIS BY END USER (2024)
FIGURE 150 SAUDI ARABIA MARKET SHARE ANALYSIS BY TYPE (2024)
FIGURE 151 SAUDI ARABIA MARKET SHARE ANALYSIS BY END USER (2024)
FIGURE 152 UAE MARKET SHARE ANALYSIS BY TYPE (2024)
FIGURE 153 UAE MARKET SHARE ANALYSIS BY END USER (2024)
FIGURE 154 EGYPT MARKET SHARE ANALYSIS BY TYPE (2024)
FIGURE 155 EGYPT MARKET SHARE ANALYSIS BY END USER (2024)
FIGURE 156 NIGERIA MARKET SHARE ANALYSIS BY TYPE (2024)
FIGURE 157 NIGERIA MARKET SHARE ANALYSIS BY END USER (2024)
FIGURE 158 SOUTH AFRICA MARKET SHARE ANALYSIS BY TYPE (2024)
FIGURE 159 SOUTH AFRICA MARKET SHARE ANALYSIS BY END USER (2024)
FIGURE 160 GERMANY MARKET SHARE ANALYSIS BY TYPE (2024)
FIGURE 161 GERMANY MARKET SHARE ANALYSIS BY END USER (2024)
FIGURE 162 FRANCE MARKET SHARE ANALYSIS BY TYPE (2024)
FIGURE 163 FRANCE MARKET SHARE ANALYSIS BY END USER (2024)
FIGURE 164 UK MARKET SHARE ANALYSIS BY TYPE (2024)
FIGURE 165 UK MARKET SHARE ANALYSIS BY END USER (2024)
FIGURE 166 SPAIN MARKET SHARE ANALYSIS BY TYPE (2024)
FIGURE 167 SPAIN MARKET SHARE ANALYSIS BY END USER (2024)
FIGURE 168 ITALY MARKET SHARE ANALYSIS BY TYPE (2024)
FIGURE 169 ITALY MARKET SHARE ANALYSIS BY END USER (2024)
FIGURE 170 BRAZIL MARKET SHARE ANALYSIS BY TYPE (2024)
FIGURE 171 BRAZIL MARKET SHARE ANALYSIS BY END USER (2024)
FIGURE 172 ARGENTINA MARKET SHARE ANALYSIS BY TYPE (2024)
FIGURE 173 ARGENTINA MARKET SHARE ANALYSIS BY END USER (2024)
FIGURE 174 COLUMBIA MARKET SHARE ANALYSIS BY TYPE (2024)
FIGURE 175 COLUMBIA MARKET SHARE ANALYSIS BY END USER (2024)
FIGURE 176 GLOBAL AI IMAGE ENHANCERCURRENT AND FUTURE MARKET KEY COUNTRY LEVEL ANALYSIS, 2024–2034, (USD MILLION)
FIGURE 177 FINANCIAL OVERVIEW:
Key Player Analysis
Kapsch TrafficCom AG: Kapsch TrafficCom AG positions as a market leader at the intersection of intelligent traffic systems and AI-enabled image processing. The company generated around EUR 530 million in revenue in its 2024/25 financial year and operates in more than 25 countries, with tolling and traffic management as core segments. Its road-side and in-vehicle platforms rely on high-resolution imaging, automated number plate recognition, and incident detection, which create direct demand for advanced image enhancement software. The firm reports that the addressable ITS market for its portfolio is about EUR 6.9 billion, growing at roughly 8 percent per year to 2027/28, and invests around 5 percent of revenue in development activities, including AI, analytics, and cloud-based traffic platforms.
Strategically, Kapsch focuses on long-term projects in tolling and urban traffic management where stable service contracts provide visibility on cash flow. Recent projects in Europe and Latin America include large-scale MLFF toll systems and connected corridor deployments that require robust video analytics across thousands of lanes. The company differentiates through end-to-end capabilities that link camera hardware, AI-based image processing, and back-office software in a single stack. This position allows Kapsch to embed AI image enhancement modules directly into enforcement and monitoring solutions and to cross-sell analytics to transport agencies that seek higher read rates and lower false positives from their camera networks.
Sensys Gatso Group AB: Sensys Gatso Group AB acts as a challenger with a strong focus on traffic safety and enforcement-as-a-service. In 2024, the group reported total sales of about SEK 631 million, with recurring TRaaS managed services contributing SEK 371 million and representing more than half of total revenue in some quarters. Revenue is geographically balanced, with approximately 30 percent from the Americas, 43 percent from Europe, and 36 percent from APAC and MEA. In 2025, the company has continued to grow, with Q2 2025 revenue reaching SEK 204 million, up 22 percent year on year, driven by strong system sales and steady growth in recurring service contracts.
Sensys Gatso’s enforcement platforms combine roadside cameras, embedded processing, and cloud back-office systems that rely heavily on AI image enhancement and recognition to identify speeding, red-light violations, and other offences with high evidential quality. Strategic initiatives include long-term contracts in Sweden, the Netherlands, Saudi Arabia, Ghana, and multiple US cities, which secure multi-year visibility on managed services revenue. The company differentiates through its TRaaS model, which bundles hardware, software, and operations into outcome-based contracts; this structure aligns well with AI image enhancement use cases where you prefer service-based pricing and guaranteed performance rather than capital-heavy deployments.
Redflex Holdings: Redflex Holdings operates as a niche player within the broader Verra Mobility portfolio, following its acquisition in 2021. Verra Mobility acquired 100 percent of Redflex for around A$152.5 million, targeting cost synergies of 8 to 10 million USD and a stronger global footprint in automated enforcement. Before the transaction, Redflex reported approximately 71.8 million USD in revenue and 13.3 million USD in EBITDA for 2020, highlighting its scale as a focused traffic enforcement specialist. Redflex solutions span fixed and mobile speed cameras, red-light enforcement, and average-speed systems, all of which depend on accurate image capture and processing under challenging conditions such as low light, adverse weather, and high vehicle speeds.
Within the AI image enhancer market, Redflex contributes domain-specific algorithms tuned for traffic scenes, including plate recognition, vehicle classification, and violation validation workflows. Integration into Verra Mobility’s Government Solutions business broadens access to North American, European, and Middle Eastern cities while providing more capital for R&D in AI and imaging. The combined entity operates thousands of cameras and processes millions of violation images each year, which creates a large data pool to refine AI-based enhancement models. This scale helps improve evidential image quality, reduce manual review time, and strengthen Redflex’s position as a preferred partner for agencies that want proven, field-tested AI image processing within road safety programs.
Market Key Players
Movavi Software
Lets Enhance
Prisma Data
PixBim
Bigjpg
Meero
Icons8
Upscale.media
VanceAI Technology
NETFLAIRS TECHNOLOGY
Leawo Software
PIXLR (INMAGINE)
DEEP-IMAGE.AI
Topaz Labs
RADIUS5
HitPaw
Others
Driver: The Visual Clarity Standard
The Surge in High-Definition Expectations
By 2026, the need for high-quality digital visuals will be a basic requirement across retail, healthcare, streaming, and social platforms. As consumers spend more time on high-resolution smartphones, wearables, and immersive AR/VR applications, they expect a consistent level of clarity that traditional compression cannot provide. This change is pushing companies to use sharper product images and cleaner video feeds to keep users engaged. Your organization will need to invest in AI image enhancement tools that provide real visual improvements at scale.
Automation of High-Volume Visual Workflows
This driver is causing an annual growth rate of over 25 percent as companies automate complex workflows that large creative teams used to handle manually. By 2026, the ability to batch-process thousands of assets—from upscaling low-resolution content to reducing noise in live video streams—will be key to operational efficiency. This environment greatly boosts the competitive edge of vendors who offer reliable, real-time enhancement capabilities and smoothly integrate with existing content creation and distribution processes.
Restraint: Economic and Regulatory Friction
Computational Costs and Budgetary Barriers
A main challenge in the 2026 market is the high cost of developing and deploying advanced AI models, which limits access for many small and mid-sized buyers. Training and running these complex neural networks need high-end GPUs and significant cloud computing resources that often exceed the budgets of smaller firms. Additionally, rising subscription fees for enterprise-grade platforms widen the financial gap between large companies and newcomers, which could hinder innovation among smaller creative agencies.
The Rising Cost of Data Compliance
Data privacy regulations in key global markets have introduced another constraint, especially for sectors that handle sensitive imagery. By 2026, compliance spending is expected to rise by about 15 to 20 percent for companies processing visuals in healthcare, finance, or public safety. These regulatory challenges force organizations to invest in secure, localized processing and thorough data-handling audits. These limitations not only slow down the pace of adoption but also create a fragmented global landscape, with uneven progress across different regions and industries.
Opportunity: Beyond General Media
Critical Clarity in Specialized Verticals
AI image enhancement is quickly growing in specialized technical fields where visual clarity directly affects important outcomes, not just aesthetic appeal. Medical imaging, autonomous vehicle systems, and smart security networks increasingly depend on accurately interpreting complex, often low-light environments. These critical areas are expected to grow at rates above 30 percent through 2030, providing you with a significant chance to deliver the "visual truth" needed for life-saving diagnostics and safe autonomous navigation.
The Democratization of Pretrained Models
The increased availability of high-performance, pretrained models is creating another opportunity by lowering the technical requirements for smaller organizations. By 2026, "off-the-shelf" AI enhancement modules will enable hospitals and local surveillance providers to add real-time upscaling to their systems without needing to build their own infrastructure. Aligning your product plans with these regulated sectors, which require proven and verified performance, will open new markets that prioritize reliability over mere creative appeal.
Trend: Generative Integration and Edge Processing
The Convergence of Enhancement and Generation
Generative AI is transforming how organizations refine their visual assets by combining traditional enhancement with creative synthesis. Vendors now offer hybrid models that provide automated upscaling, artifact removal, and "contextual fill" at speeds suited for high-volume e-commerce and advertising workflows. This trend allows teams to create thousands of assets per week that are not just enhanced, but also intelligently modified to meet specific platform needs, steering the market toward a future of "smart asset creation" instead of just simple editing.
The Shift to On-Device Inference
Real-time enhancement on edge devices is gaining significant traction as smartphone manufacturers and AR platform developers include powerful processing chips on their devices. This shift reduces reliance on expensive cloud processing and improves privacy by keeping visual data on the user's device. By 2026, this trend is driving the market toward hybrid architectures that balance on-device processing for speed with cloud-based training for model depth. This dynamic is changing competition, favoring companies that can optimize their AI models for low-power mobile environments.
Recent Developments
Dec 2024 – Adobe: Adobe introduced an AI-driven image enhancement suite within its creative platform that automates background cleanup, upscaling, and color correction for up to 5,000 assets per batch, with early estimates pointing to more than USD 80 million in incremental annual recurring revenue potential. This move strengthens Adobe’s position as the primary workflow hub for agencies and brands that manage high-volume visual content.
Feb 2025 – NVIDIA: NVIDIA announced an upgraded AI image and video enhancement engine for its RTX GPU line, delivering up to 4K upscaling and noise reduction in real time while claiming performance gains of 30 percent per watt versus prior releases. The enhancement deepens NVIDIA’s control over the hardware-accelerated image processing stack and draws more developers into its AI ecosystem.
Apr 2025 – Google Cloud: Google Cloud launched new image enhancement APIs built on its vision and large-model stack, targeting e-commerce, social platforms, and media firms with per-image pricing and volume discounts that can cut editing costs by up to 40 percent for large customers. The release uses Google’s existing cloud footprint to capture incremental AI workloads from enterprises that seek integrated storage, compute, and imaging tools.
Jul 2025 – Samsung Electronics: Samsung announced system-level AI image enhancement pipelines across its 2025 flagship smartphones and premium TVs, estimating deployment in more than 35 million devices shipped in the year. This integration shifts a larger share of enhancement workloads to the edge and reinforces Samsung’s influence over how consumers experience AI-processed visuals.
Sep 2025 – Canva: Canva released an enterprise-grade AI image enhancement hub that standardizes sharpness, lighting, and brand presets across large design teams, reporting adoption by over 4,000 paying enterprise accounts within the first quarter of launch. The product broadens Canva’s role from self-serve design tool to strategic content platform for organizations that manage global digital campaigns at scale.