AI in Cancer Diagnostics Market Size, Forecast | 26.2% CAGR Growth
Global AI in Cancer Market Size, Share & Analysis By Product Type (Software Solutions, Services, Hardware), By Application (Breast Cancer, Brain Tumor, Colorectal Cancer, Lung Cancer, Others), By End-user (Hospital, Surgical Centers & Medical Institutes, Others), Clinical Accuracy Trends & Forecast 2025–2034
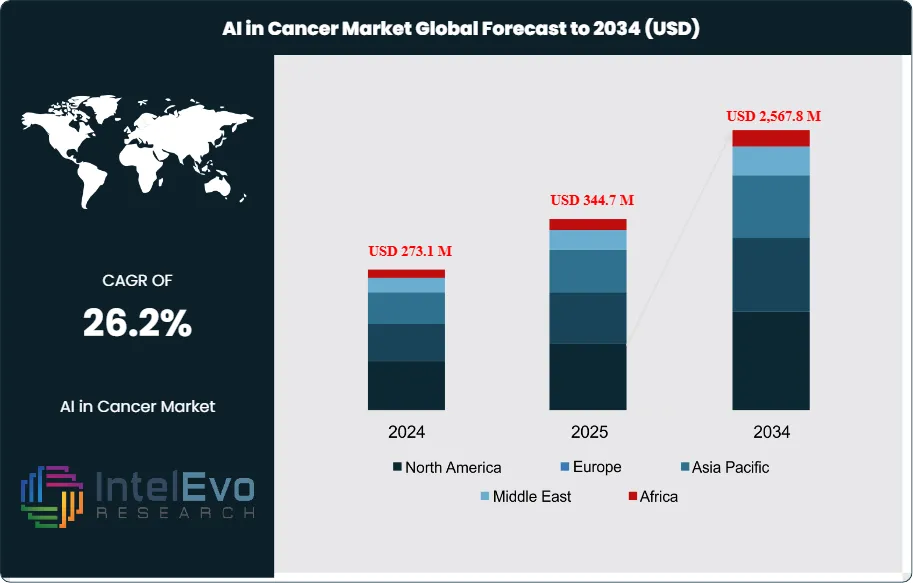
The AI in Cancer Diagnostics Market is estimated at US$ 273.1 million in 2024 and is on track to reach roughly US$ 2,567.8 million by 2034, implying a compound annual growth rate of 26.2% over 2025–2034. This remarkable expansion underscores the growing role of artificial intelligence in transforming oncology diagnostics. Historically, cancer detection relied heavily on manual interpretation of imaging and pathology reports, which often introduced delays and variability.
However, recent years have seen a dramatic shift toward AI-enabled solutions that enhance accuracy, reduce diagnostic turnaround times, and support oncologists in making better-informed clinical decisions. The anticipated surge in market value reflects both rising cancer prevalence—over 19 million new cases were reported globally in 2022—and the urgent need for scalable diagnostic solutions capable of addressing growing clinical complexity.
Several factors are driving this momentum. On the demand side, healthcare systems face mounting pressure to detect cancers earlier, when survival rates are significantly higher, and to deliver precision medicine tailored to individual patients. Supply-side advancements in machine learning, deep learning, and computer vision have enabled algorithms to detect subtle tumor patterns in medical imaging, analyze genomic profiles, and synthesize electronic health record data with unprecedented speed. At the same time, challenges remain, including regulatory scrutiny around AI-driven diagnostics, high implementation costs, data privacy concerns, and the need for extensive clinical validation to ensure safety and reliability.
Technological innovation is at the heart of this market’s expansion. Integrating AI with next-generation sequencing has unlocked new opportunities to identify genetic mutations linked to specific cancers, guiding personalized treatment strategies. Emerging platforms, such as Tempus AI+ launched in October 2022, illustrate how real-world data combined with AI analytics can refine precision oncology research and accelerate breakthroughs in diagnosis and therapy. Furthermore, AI-enabled automation is streamlining workflows by reducing repetitive tasks, freeing clinicians to focus on complex cases and improving overall healthcare efficiency.
Geographically, North America leads adoption due to robust healthcare infrastructure, significant R&D investments, and favorable regulatory frameworks. Europe follows closely, supported by strong precision medicine initiatives, while Asia-Pacific is emerging as a high-growth region fueled by rising cancer incidence and expanding healthcare digitization. For investors, opportunities are particularly strong in markets embracing early detection and precision oncology, where AI adoption is accelerating rapidly. Together, these dynamics position AI-driven cancer diagnostics as one of the most transformative growth frontiers in healthcare over the next decade.
Key Takeaways
Market Growth: The AI in Cancer Diagnostics Market generated US$ 273.1 million in 2024 and is projected to reach US$ 2,567.8 million by 2034, reflecting a robust CAGR of 26.2%. Growth is driven by rising cancer incidence worldwide, greater adoption of precision oncology, and the integration of AI into medical imaging and genomics.
Segment Dominance – Product Type: Software solutions accounted for 60.4% of the market in 2023, positioning them as the clear leader. Their dominance is attributed to scalable deployment, rapid algorithm upgrades, and integration with imaging and sequencing platforms, while hardware and services lag in adoption.
Segment Dominance – Application: Breast cancer diagnostics represented 35.0% of market revenue in 2023, underscoring the high global prevalence of breast cancer (over 2.3 million new cases annually) and strong demand for early detection tools. AI-powered imaging solutions are accelerating adoption in this category.
Segment Dominance – End User: Hospitals captured 52.8% of revenue in 2023, reflecting their central role in implementing AI-driven diagnostic platforms across radiology, pathology, and oncology departments. Their strong purchasing power and access to large patient datasets further reinforce dominance.
Driver: Advancements in machine learning, deep learning, and computer vision are improving early tumor detection accuracy rates by up to 15–20% compared with conventional methods, directly supporting better survival outcomes and reducing diagnostic errors.
Restraint: High implementation and integration costs, particularly in low- and middle-income countries, limit adoption. Establishing AI-enabled diagnostic infrastructure can increase oncology department operating costs by 12–18% in the short term, hindering wider penetration.
Opportunity: Integration of AI with next-generation sequencing (NGS) represents a high-growth area, enabling personalized oncology. This segment is projected to expand at an above-average CAGR, driven by precision medicine initiatives and demand for mutation-specific therapies.
Trend: Partnerships between AI developers and healthcare providers are accelerating innovation. For instance, Tempus AI+ (launched in October 2022) leverages real-world patient data and AI analytics to enhance precision oncology research and improve diagnostic accuracy.
Regional Analysis: North America led the market with a 48.3% revenue share in 2023, supported by strong R&D investment and advanced healthcare infrastructure. Asia-Pacific is expected to post the fastest growth over 2025–2034, driven by rising cancer prevalence, expanding healthcare access, and aggressive digital health initiatives.
Product Type Analysis
Software solutions remain the dominant segment in the AI in cancer diagnostics market, accounting for more than 60% of total revenue in 2024 and projected to maintain their lead through 2034. Their growth is supported by the rising integration of advanced AI algorithms—including deep learning, natural language processing, and computer vision—into diagnostic workflows. These solutions enable clinicians to analyze complex datasets such as genomic sequences, pathology slides, and radiology images with greater speed and precision than traditional methods, significantly reducing diagnostic errors.
The demand for software platforms is further fueled by their scalability and compatibility with existing hospital infrastructure, particularly electronic health records (EHR) and laboratory information systems (LIS). As healthcare providers manage growing patient volumes and increasingly complex cancer cases, AI-powered diagnostic software is expected to streamline workflows, reduce turnaround times by up to 30%, and enhance treatment decision-making. Services and hardware, though essential, are anticipated to grow at a slower pace as they primarily support the widespread adoption of software-led solutions.
Application Analysis
Breast cancer represents the largest application segment, capturing 35% of the AI in cancer diagnostics market in 2024, with demand driven by its status as the most prevalent cancer among women globally. AI technologies are particularly impactful in this space, where machine learning models applied to mammography, ultrasound, and MRI have demonstrated improvements in early detection accuracy rates by 10–20% compared with conventional screenings. This is expected to translate into earlier intervention and improved survival outcomes.
Beyond breast cancer, AI applications are expanding rapidly in lung and colorectal cancer diagnostics, where imaging complexity and high incidence rates create strong use cases for automation. For instance, AI-enhanced CT analysis in lung cancer can detect nodules with greater precision, reducing false negatives and enabling more targeted treatment planning. As awareness campaigns and screening programs expand globally, adoption of AI across all major cancer categories is expected to accelerate, with multi-modal diagnostic platforms playing a central role in comprehensive oncology care.
End-User Analysis
Hospitals accounted for 52.8% of global revenues in 2024 and are projected to retain dominance as the primary adopters of AI in cancer diagnostics. Large patient inflows, advanced oncology departments, and access to integrated IT infrastructure position hospitals as the central hubs for AI deployment. By leveraging AI-enabled platforms, hospitals are improving clinical workflows, accelerating diagnostic turnaround, and enhancing multidisciplinary treatment planning.
The widespread integration of AI into hospital radiology and pathology departments is also improving diagnostic yield and operational efficiency. AI solutions support oncologists in interpreting complex biopsy results, sequencing data, and imaging scans, which is vital for delivering precision medicine. Over the forecast period, hospitals are expected to expand adoption not only for clinical purposes but also for oncology research, clinical trials, and resource optimization, ensuring their position as the largest and fastest-evolving end-user segment.
Regional Analysis
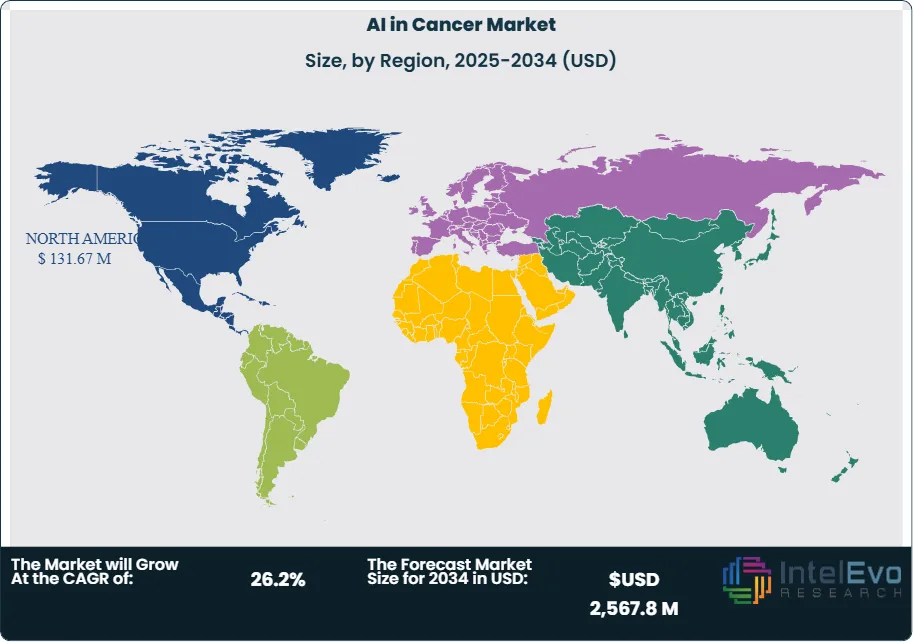
North America continues to lead the AI in cancer diagnostics market, representing 48.3% of global revenue in 2024. The region benefits from strong investment in precision medicine, widespread use of digital imaging, and a favorable regulatory environment. The U.S. Food and Drug Administration (FDA) has been instrumental in advancing adoption, with more than 50 AI/ML-enabled oncology devices cleared between 2022 and 2024. Major industry players, such as Siemens Healthineers and GE HealthCare, are actively deploying AI-driven diagnostic platforms across hospitals and cancer centers, further accelerating market growth.
In contrast, Asia Pacific is expected to record the highest CAGR between 2025 and 2034, propelled by rising cancer incidence, rapid healthcare digitalization, and strong government investment in AI-based healthcare infrastructure. China’s healthcare expenditure surpassed US$1.2 trillion in 2022, with significant allocations toward advanced diagnostic technologies, while Japan and South Korea are actively promoting AI adoption in oncology as part of broader aging population strategies. Global companies such as Philips and regional players are capitalizing on this momentum, with diagnostic imaging sales in Asia Pacific already contributing significantly to global revenues in 2024.
Europe maintains a solid position, driven by established healthcare systems and widespread adoption of digital pathology and genomics. Meanwhile, Latin America and the Middle East & Africa are emerging as promising frontiers, with increasing cancer awareness, expanding healthcare access, and early-stage investments in AI-enabled diagnostic platforms. Collectively, these dynamics underscore a geographically diverse growth trajectory, with North America leading today and Asia Pacific emerging as the key growth engine for the next decade.
By Product Type (Software Solutions, Services, Hardware), By Application (Breast Cancer, Brain Tumor, Colorectal Cancer, Lung Cancer, Others), By End-user (Hospital, Surgical Centers & Medical Institutes, Others)
Research Methodology
Primary Research- 100 Interviews of Stakeholders
Secondary Research
Desk Research
Regional scope
North America (United States, Canada, Mexico)
Latin America (Brazil, Argentina, Columbia)
East Asia And Pacific (China, Japan, South Korea, Australia, Cambodia, Fiji, Indonesia)
Sea And South Asia (India, Singapore, Thailand, Taiwan, Malaysia)
Eastern Europe (Poland, Russia, Czech Republic, Romania)
Western Europe (Germany, U.K., France, Spain, Itlay)
Middle East & Africa (GCC Countries, Egypt, Nigeria, South Africa, Israel)
Competitive Landscape
Paige AI Inc, EarlySign, Cancer Center.ai, PathAI, Inc, Tempus AI, Inc, SkinVision, Flatiron Health
Customization Scope
Customization for segments, region/country-level will be provided. Moreover, additional customization can be done based on the requirements.
Pricing and Purchase Options
Avail customized purchase options to meet your exact research needs. We have three licenses to opt for: Single User License, Multi-User License (Up to 5 Users), Corporate Use License (Unlimited User and Printable PDF).
TABLE OF CONTENTS
1. EXECUTIVE SUMMARY
1.1. MARKET SNAPSHOT
1.2. KEY FINDINGS & INSIGHTS
1.3. ANALYST RECOMMENDATIONS
1.4. FUTURE OUTLOOK
2. RESEARCH METHODOLOGY
2.1. MARKET DEFINITION & SCOPE
2.2. RESEARCH OBJECTIVES: PRIMARY & SECONDARY DATA SOURCES
2.3. DATA COLLECTION SOURCES
2.3.1. COVERAGE OF 100+ PRIMARY RESEARCH/CONSULTATION CALLS WITH INDUSTRY STAKEHOLDERS
FIGURE 17 NORTH AMERICA AI IN CANCER CURRENT AND FUTURE TYPE ANALYSIS, 2025–2034, (USD MILLION)
FIGURE 18 NORTH AMERICA AI IN CANCER CURRENT AND FUTURE END USER ANALYSIS, 2025–2034, (USD MILLION)
FIGURE 19 MARKET SHARE BY COUNTRY
FIGURE 20 LATIN AMERICA AI IN CANCER CURRENT AND FUTURE TYPE ANALYSIS, 2025–2034, (USD MILLION)
FIGURE 21 LATIN AMERICA AI IN CANCER CURRENT AND FUTURE END USER ANALYSIS, 2025–2034, (USD MILLION)
FIGURE 22 MARKET SHARE BY COUNTRY
FIGURE 23 EASTERN EUROPE AI IN CANCER CURRENT AND FUTURE TYPE ANALYSIS, 2025–2034, (USD MILLION)
FIGURE 24 EASTERN EUROPE AI IN CANCER CURRENT AND FUTURE END USER ANALYSIS, 2025–2034, (USD MILLION)
FIGURE 25 MARKET SHARE BY COUNTRY
FIGURE 26 WESTERN EUROPE AI IN CANCER CURRENT AND FUTURE TYPE ANALYSIS, 2025–2034, (USD MILLION)
FIGURE 27 WESTERN EUROPE AI IN CANCER CURRENT AND FUTURE END USER ANALYSIS, 2025–2034, (USD MILLION)
FIGURE 28 MARKET SHARE BY COUNTRY
FIGURE 29 EAST ASIA AND PACIFIC AI IN CANCER CURRENT AND FUTURE TYPE ANALYSIS, 2025–2034, (USD MILLION)
FIGURE 30 EAST ASIA AND PACIFIC AI IN CANCER CURRENT AND FUTURE END USER ANALYSIS, 2025–2034, (USD MILLION)
FIGURE 31 MARKET SHARE BY COUNTRY
FIGURE 32 SEA AND SOUTH ASIA AI IN CANCER CURRENT AND FUTURE TYPE ANALYSIS, 2025–2034, (USD MILLION)
FIGURE 33 SEA AND SOUTH ASIA AI IN CANCER CURRENT AND FUTURE END USER ANALYSIS, 2025–2034, (USD MILLION)
FIGURE 34 MARKET SHARE BY COUNTRY
FIGURE 35 MIDDLE EAST AND AFRICA AI IN CANCER CURRENT AND FUTURE TYPE ANALYSIS, 2025–2034, (USD MILLION)
FIGURE 36 MIDDLE EAST AND AFRICA AI IN CANCER CURRENT AND FUTURE END USER ANALYSIS, 2025–2034, (USD MILLION)
FIGURE 37 NORTH AMERICA AI IN CANCER CURRENT AND FUTURE MARKET VOLUME SHARE REGIONAL ANALYSIS, 2025–2034, (USD MILLION)
FIGURE 38 U.S. AI IN CANCER CURRENT AND FUTURE TYPE ANALYSIS, 2025–2034, (USD MILLION)
FIGURE 39 U.S. AI IN CANCER CURRENT AND FUTURE END USER ANALYSIS, 2025–2034, (USD MILLION)
FIGURE 40 CANADA AI IN CANCER CURRENT AND FUTURE TYPE ANALYSIS, 2025–2034, (USD MILLION)
FIGURE 41 CANADA AI IN CANCER CURRENT AND FUTURE END USER ANALYSIS, 2025–2034, (USD MILLION)
FIGURE 42 LATIN AMERICA AI IN CANCER CURRENT AND FUTURE MARKET VOLUME SHARE REGIONAL ANALYSIS, 2025–2034, (USD MILLION)
FIGURE 43 MEXICO AI IN CANCER CURRENT AND FUTURE TYPE ANALYSIS, 2025–2034, (USD MILLION)
FIGURE 44 MEXICO AI IN CANCER CURRENT AND FUTURE END USER ANALYSIS, 2025–2034, (USD MILLION)
FIGURE 45 BRAZIL AI IN CANCER CURRENT AND FUTURE TYPE ANALYSIS, 2025–2034, (USD MILLION)
FIGURE 46 BRAZIL AI IN CANCER CURRENT AND FUTURE END USER ANALYSIS, 2025–2034, (USD MILLION)
FIGURE 47 ARGENTINA AI IN CANCER CURRENT AND FUTURE TYPE ANALYSIS, 2025–2034, (USD MILLION)
FIGURE 48 ARGENTINA AI IN CANCER CURRENT AND FUTURE END USER ANALYSIS, 2025–2034, (USD MILLION)
FIGURE 49 COLUMBIA AI IN CANCER CURRENT AND FUTURE TYPE ANALYSIS, 2025–2034, (USD MILLION)
FIGURE 50 COLUMBIA AI IN CANCER CURRENT AND FUTURE END USER ANALYSIS, 2025–2034, (USD MILLION)
FIGURE 51 REST OF LATIN AMERICA AI IN CANCER CURRENT AND FUTURE TYPE ANALYSIS, 2025–2034, (USD MILLION)
FIGURE 52 REST OF LATIN AMERICA AI IN CANCER CURRENT AND FUTURE END USER ANALYSIS, 2025–2034, (USD MILLION)
FIGURE 53 EASTERN EUROPE AI IN CANCER CURRENT AND FUTURE MARKET VOLUME SHARE REGIONAL ANALYSIS, 2025–2034, (USD MILLION)
FIGURE 54 POLAND AI IN CANCER CURRENT AND FUTURE TYPE ANALYSIS, 2025–2034, (USD MILLION)
FIGURE 55 POLAND AI IN CANCER CURRENT AND FUTURE END USER ANALYSIS, 2025–2034, (USD MILLION)
FIGURE 56 RUSSIA AI IN CANCER CURRENT AND FUTURE TYPE ANALYSIS, 2025–2034, (USD MILLION)
FIGURE 57 RUSSIA AI IN CANCER CURRENT AND FUTURE END USER ANALYSIS, 2025–2034, (USD MILLION)
FIGURE 58 CZECH REPUBLIC AI IN CANCER CURRENT AND FUTURE TYPE ANALYSIS, 2025–2034, (USD MILLION)
FIGURE 59 CZECH REPUBLIC AI IN CANCER CURRENT AND FUTURE END USER ANALYSIS, 2025–2034, (USD MILLION)
FIGURE 60 ROMANIA AI IN CANCER CURRENT AND FUTURE TYPE ANALYSIS, 2025–2034, (USD MILLION)
FIGURE 61 ROMANIA AI IN CANCER CURRENT AND FUTURE END USER ANALYSIS, 2025–2034, (USD MILLION)
FIGURE 62 REST OF EASTERN EUROPE AI IN CANCER CURRENT AND FUTURE TYPE ANALYSIS, 2025–2034, (USD MILLION)
FIGURE 63 REST OF EASTERN EUROPE AI IN CANCER CURRENT AND FUTURE END USER ANALYSIS, 2025–2034, (USD MILLION)
FIGURE 64 WESTERN EUROPE AI IN CANCER CURRENT AND FUTURE MARKET VOLUME SHARE REGIONAL ANALYSIS, 2025–2034, (USD MILLION)
FIGURE 65 GERMANY AI IN CANCER CURRENT AND FUTURE TYPE ANALYSIS, 2025–2034, (USD MILLION)
FIGURE 66 GERMANY AI IN CANCER CURRENT AND FUTURE END USER ANALYSIS, 2025–2034, (USD MILLION)
FIGURE 67 FRANCE AI IN CANCER CURRENT AND FUTURE TYPE ANALYSIS, 2025–2034, (USD MILLION)
FIGURE 68 FRANCE AI IN CANCER CURRENT AND FUTURE END USER ANALYSIS, 2025–2034, (USD MILLION)
FIGURE 69 UK AI IN CANCER CURRENT AND FUTURE TYPE ANALYSIS, 2025–2034, (USD MILLION)
FIGURE 70 UK AI IN CANCER CURRENT AND FUTURE END USER ANALYSIS, 2025–2034, (USD MILLION)
FIGURE 71 SPAIN AI IN CANCER CURRENT AND FUTURE TYPE ANALYSIS, 2025–2034, (USD MILLION)
FIGURE 72 SPAIN AI IN CANCER CURRENT AND FUTURE END USER ANALYSIS, 2025–2034, (USD MILLION)
FIGURE 73 ITALY AI IN CANCER CURRENT AND FUTURE TYPE ANALYSIS, 2025–2034, (USD MILLION)
FIGURE 74 ITALY AI IN CANCER CURRENT AND FUTURE END USER ANALYSIS, 2025–2034, (USD MILLION)
FIGURE 75 REST OF WESTERN EUROPE AI IN CANCER CURRENT AND FUTURE TYPE ANALYSIS, 2025–2034, (USD MILLION)
FIGURE 76 REST OF WESTERN EUROPE AI IN CANCER CURRENT AND FUTURE END USER ANALYSIS, 2025–2034, (USD MILLION)
FIGURE 77 EAST ASIA AND PACIFIC AI IN CANCER CURRENT AND FUTURE MARKET VOLUME SHARE REGIONAL ANALYSIS, 2025–2034, (USD MILLION)
FIGURE 78 CHINA AI IN CANCER CURRENT AND FUTURE TYPE ANALYSIS, 2025–2034, (USD MILLION)
FIGURE 79 CHINA AI IN CANCER CURRENT AND FUTURE END USER ANALYSIS, 2025–2034, (USD MILLION)
FIGURE 80 JAPAN AI IN CANCER CURRENT AND FUTURE TYPE ANALYSIS, 2025–2034, (USD MILLION)
FIGURE 81 JAPAN AI IN CANCER CURRENT AND FUTURE END USER ANALYSIS, 2025–2034, (USD MILLION)
FIGURE 82 AUSTRALIA AI IN CANCER CURRENT AND FUTURE TYPE ANALYSIS, 2025–2034, (USD MILLION)
FIGURE 83 AUSTRALIA AI IN CANCER CURRENT AND FUTURE END USER ANALYSIS, 2025–2034, (USD MILLION)
FIGURE 84 CAMBODIA AI IN CANCER CURRENT AND FUTURE TYPE ANALYSIS, 2025–2034, (USD MILLION)
FIGURE 85 CAMBODIA AI IN CANCER CURRENT AND FUTURE END USER ANALYSIS, 2025–2034, (USD MILLION)
FIGURE 86 FIJI AI IN CANCER CURRENT AND FUTURE TYPE ANALYSIS, 2025–2034, (USD MILLION)
FIGURE 87 FIJI AI IN CANCER CURRENT AND FUTURE END USER ANALYSIS, 2025–2034, (USD MILLION)
FIGURE 88 INDONESIA AI IN CANCER CURRENT AND FUTURE TYPE ANALYSIS, 2025–2034, (USD MILLION)
FIGURE 89 INDONESIA AI IN CANCER CURRENT AND FUTURE END USER ANALYSIS, 2025–2034, (USD MILLION)
FIGURE 90 SOUTH KOREA AI IN CANCER CURRENT AND FUTURE TYPE ANALYSIS, 2025–2034, (USD MILLION)
FIGURE 91 SOUTH KOREA AI IN CANCER CURRENT AND FUTURE END USER ANALYSIS, 2025–2034, (USD MILLION)
FIGURE 92 REST OF EAST ASIA AND PACIFIC AI IN CANCER CURRENT AND FUTURE TYPE ANALYSIS, 2025–2034, (USD MILLION)
FIGURE 93 REST OF EAST ASIA AND PACIFIC AI IN CANCER CURRENT AND FUTURE END USER ANALYSIS, 2025–2034, (USD MILLION)
FIGURE 94 SEA AND SOUTH ASIA AI IN CANCER CURRENT AND FUTURE MARKET VOLUME SHARE REGIONAL ANALYSIS, 2025–2034, (USD MILLION)
FIGURE 95 BANGLADESH AI IN CANCER CURRENT AND FUTURE TYPE ANALYSIS, 2025–2034, (USD MILLION)
FIGURE 96 BANGLADESH AI IN CANCER CURRENT AND FUTURE END USER ANALYSIS, 2025–2034, (USD MILLION)
FIGURE 97 NEW ZEALAND AI IN CANCER CURRENT AND FUTURE TYPE ANALYSIS, 2025–2034, (USD MILLION)
FIGURE 98 NEW ZEALAND AI IN CANCER CURRENT AND FUTURE END USER ANALYSIS, 2025–2034, (USD MILLION)
FIGURE 99 INDIA AI IN CANCER CURRENT AND FUTURE TYPE ANALYSIS, 2025–2034, (USD MILLION)
FIGURE 100 INDIA AI IN CANCER CURRENT AND FUTURE END USER ANALYSIS, 2025–2034, (USD MILLION)
FIGURE 101 SINGAPORE AI IN CANCER CURRENT AND FUTURE TYPE ANALYSIS, 2025–2034, (USD MILLION)
FIGURE 102 SINGAPORE AI IN CANCER CURRENT AND FUTURE END USER ANALYSIS, 2025–2034, (USD MILLION)
FIGURE 103 THAILAND AI IN CANCER CURRENT AND FUTURE TYPE ANALYSIS, 2025–2034, (USD MILLION)
FIGURE 104 THAILAND AI IN CANCER CURRENT AND FUTURE END USER ANALYSIS, 2025–2034, (USD MILLION)
FIGURE 105 TAIWAN AI IN CANCER CURRENT AND FUTURE TYPE ANALYSIS, 2025–2034, (USD MILLION)
FIGURE 106 TAIWAN AI IN CANCER CURRENT AND FUTURE END USER ANALYSIS, 2025–2034, (USD MILLION)
FIGURE 107 MALAYSIA AI IN CANCER CURRENT AND FUTURE TYPE ANALYSIS, 2025–2034, (USD MILLION)
FIGURE 108 MALAYSIA AI IN CANCER CURRENT AND FUTURE END USER ANALYSIS, 2025–2034, (USD MILLION)
FIGURE 109 REST OF SEA AND SOUTH ASIA AI IN CANCER CURRENT AND FUTURE TYPE ANALYSIS, 2025–2034, (USD MILLION)
FIGURE 110 REST OF SEA AND SOUTH ASIA AI IN CANCER CURRENT AND FUTURE END USER ANALYSIS, 2025–2034, (USD MILLION)
FIGURE 111 MIDDLE EAST AND AFRICA AI IN CANCER CURRENT AND FUTURE MARKET VOLUME SHARE REGIONAL ANALYSIS, 2025–2034, (USD MILLION)
FIGURE 112 GCC COUNTRIES AI IN CANCER CURRENT AND FUTURE TYPE ANALYSIS, 2025–2034, (USD MILLION)
FIGURE 113 GCC COUNTRIES AI IN CANCER CURRENT AND FUTURE END USER ANALYSIS, 2025–2034, (USD MILLION)
FIGURE 114 SAUDI ARABIA AI IN CANCER CURRENT AND FUTURE TYPE ANALYSIS, 2025–2034, (USD MILLION)
FIGURE 115 SAUDI ARABIA AI IN CANCER CURRENT AND FUTURE END USER ANALYSIS, 2025–2034, (USD MILLION)
FIGURE 116 UAE AI IN CANCER CURRENT AND FUTURE TYPE ANALYSIS, 2025–2034, (USD MILLION)
FIGURE 117 UAE AI IN CANCER CURRENT AND FUTURE END USER ANALYSIS, 2025–2034, (USD MILLION)
FIGURE 118 BAHRAIN AI IN CANCER CURRENT AND FUTURE TYPE ANALYSIS, 2025–2034, (USD MILLION)
FIGURE 119 BAHRAIN AI IN CANCER CURRENT AND FUTURE END USER ANALYSIS, 2025–2034, (USD MILLION)
FIGURE 120 KUWAIT AI IN CANCER CURRENT AND FUTURE TYPE ANALYSIS, 2025–2034, (USD MILLION)
FIGURE 121 KUWAIT AI IN CANCER CURRENT AND FUTURE END USER ANALYSIS, 2025–2034, (USD MILLION)
FIGURE 122 OMAN AI IN CANCER CURRENT AND FUTURE TYPE ANALYSIS, 2025–2034, (USD MILLION)
FIGURE 123 OMAN AI IN CANCER CURRENT AND FUTURE END USER ANALYSIS, 2025–2034, (USD MILLION)
FIGURE 124 QATAR AI IN CANCER CURRENT AND FUTURE TYPE ANALYSIS, 2025–2034, (USD MILLION)
FIGURE 125 QATAR AI IN CANCER CURRENT AND FUTURE END USER ANALYSIS, 2025–2034, (USD MILLION)
FIGURE 126 EGYPT AI IN CANCER CURRENT AND FUTURE TYPE ANALYSIS, 2025–2034, (USD MILLION)
FIGURE 127 EGYPT AI IN CANCER CURRENT AND FUTURE END USER ANALYSIS, 2025–2034, (USD MILLION)
FIGURE 128 NIGERIA AI IN CANCER CURRENT AND FUTURE TYPE ANALYSIS, 2025–2034, (USD MILLION)
FIGURE 129 NIGERIA AI IN CANCER CURRENT AND FUTURE END USER ANALYSIS, 2025–2034, (USD MILLION)
FIGURE 130 SOUTH AFRICA AI IN CANCER CURRENT AND FUTURE TYPE ANALYSIS, 2025–2034, (USD MILLION)
FIGURE 131 SOUTH AFRICA AI IN CANCER CURRENT AND FUTURE END USER ANALYSIS, 2025–2034, (USD MILLION)
FIGURE 132 ISRAEL AI IN CANCER CURRENT AND FUTURE TYPE ANALYSIS, 2025–2034, (USD MILLION)
FIGURE 133 ISRAEL AI IN CANCER CURRENT AND FUTURE END USER ANALYSIS, 2025–2034, (USD MILLION)
FIGURE 134 REST OF MEA AI IN CANCER CURRENT AND FUTURE TYPE ANALYSIS, 2025–2034, (USD MILLION)
FIGURE 135 REST OF MEA AI IN CANCER CURRENT AND FUTURE END USER ANALYSIS, 2025–2034, (USD MILLION)
FIGURE 136 U. S. MARKET SHARE ANALYSIS BY TYPE (2024)
FIGURE 137 U. S. MARKET SHARE ANALYSIS BY END USER (2024)
FIGURE 138 CANADA MARKET SHARE ANALYSIS BY TYPE (2024)
FIGURE 139 CANADA MARKET SHARE ANALYSIS BY END USER (2024)
FIGURE 140 MEXICO MARKET SHARE ANALYSIS BY TYPE (2024)
FIGURE 141 MEXICO MARKET SHARE ANALYSIS BY END USER (2024)
FIGURE 142 CHINA MARKET SHARE ANALYSIS BY TYPE (2024)
FIGURE 143 CHINA MARKET SHARE ANALYSIS BY END USER (2024)
FIGURE 144 JAPAN MARKET SHARE ANALYSIS BY TYPE (2024)
FIGURE 145 JAPAN MARKET SHARE ANALYSIS BY END USER (2024)
FIGURE 146 INDIA MARKET SHARE ANALYSIS BY TYPE (2024)
FIGURE 147 INDIA MARKET SHARE ANALYSIS BY END USER (2024)
FIGURE 148 SOUTH KOREA MARKET SHARE ANALYSIS BY TYPE (2024)
FIGURE 149 SOUTH KOREA MARKET SHARE ANALYSIS BY END USER (2024)
FIGURE 150 SAUDI ARABIA MARKET SHARE ANALYSIS BY TYPE (2024)
FIGURE 151 SAUDI ARABIA MARKET SHARE ANALYSIS BY END USER (2024)
FIGURE 152 UAE MARKET SHARE ANALYSIS BY TYPE (2024)
FIGURE 153 UAE MARKET SHARE ANALYSIS BY END USER (2024)
FIGURE 154 EGYPT MARKET SHARE ANALYSIS BY TYPE (2024)
FIGURE 155 EGYPT MARKET SHARE ANALYSIS BY END USER (2024)
FIGURE 156 NIGERIA MARKET SHARE ANALYSIS BY TYPE (2024)
FIGURE 157 NIGERIA MARKET SHARE ANALYSIS BY END USER (2024)
FIGURE 158 SOUTH AFRICA MARKET SHARE ANALYSIS BY TYPE (2024)
FIGURE 159 SOUTH AFRICA MARKET SHARE ANALYSIS BY END USER (2024)
FIGURE 160 GERMANY MARKET SHARE ANALYSIS BY TYPE (2024)
FIGURE 161 GERMANY MARKET SHARE ANALYSIS BY END USER (2024)
FIGURE 162 FRANCE MARKET SHARE ANALYSIS BY TYPE (2024)
FIGURE 163 FRANCE MARKET SHARE ANALYSIS BY END USER (2024)
FIGURE 164 UK MARKET SHARE ANALYSIS BY TYPE (2024)
FIGURE 165 UK MARKET SHARE ANALYSIS BY END USER (2024)
FIGURE 166 SPAIN MARKET SHARE ANALYSIS BY TYPE (2024)
FIGURE 167 SPAIN MARKET SHARE ANALYSIS BY END USER (2024)
FIGURE 168 ITALY MARKET SHARE ANALYSIS BY TYPE (2024)
FIGURE 169 ITALY MARKET SHARE ANALYSIS BY END USER (2024)
FIGURE 170 BRAZIL MARKET SHARE ANALYSIS BY TYPE (2024)
FIGURE 171 BRAZIL MARKET SHARE ANALYSIS BY END USER (2024)
FIGURE 172 ARGENTINA MARKET SHARE ANALYSIS BY TYPE (2024)
FIGURE 173 ARGENTINA MARKET SHARE ANALYSIS BY END USER (2024)
FIGURE 174 COLUMBIA MARKET SHARE ANALYSIS BY TYPE (2024)
FIGURE 175 COLUMBIA MARKET SHARE ANALYSIS BY END USER (2024)
FIGURE 176 GLOBAL AI IN CANCER CURRENT AND FUTURE MARKET KEY COUNTRY LEVEL ANALYSIS, 2024–2034, (USD MILLION)
FIGURE 177 FINANCIAL OVERVIEW:
Key Player Analysis
Tempus AI, Inc:Positioning – Leader. Tempus has emerged as the scale player in AI-enabled oncology diagnostics, combining a high-throughput NGS lab business with a rapidly expanding data and AI platform. In 2025 the company raised full-year guidance to ~US$1.26 billion (+~82% YoY) and signaled a turn toward positive adjusted EBITDA, underscoring operating leverage from test volume and data monetization. Strategically, Tempus is broadening modality coverage—most recently adding an FDA-cleared RNA analysis device—to strengthen pharma partnerships and patient stratification across clinical trials. Its quarterly throughput (e.g., >200,000 NGS tests in Q2 2025) gives the firm a unique multimodal corpus to train and deploy clinical AI at scale.
Tempus’ August 2025 acquisition of Paige positions the company to converge digital pathology with genomics in a single workflow from biopsy to therapy selection. The combination adds FDA-cleared pathology AI to Tempus’ platform, accelerates hospital adoption by simplifying vendor stacks, and strengthens defensibility versus single-modality rivals. Net-net, Tempus is setting the bar on integrated precision oncology, with clear cross-sell and algorithm-performance advantages rooted in multimodal data density.
SkinVision:Positioning – Niche Player/Disruptor (D2C Screening). SkinVision focuses on consumer-led, AI-based skin-cancer risk assessment via smartphone images—an expanding front door to oncology diagnostics in Europe. The app holds EU MDR Class IIa certification and reports >5 million skin checks from >3 million users, giving it one of the largest dermatologic image datasets in mobile health. In 2025, renewed emphasis on medical-grade compliance and clinical validation has reinforced payer and provider interest in AI-assisted triage that can decongest dermatology pathways.
Differentiation stems from the combination of regulated AI risk scoring and broad consumer reach, which can lower time-to-consult and funnel higher-risk cases into specialist care. As health systems scale population screening and remote triage, SkinVision’s dataset and CE-certified workflow make it a pragmatic partner for integrated cancer-diagnostics programs seeking earlier detection and lower per-screen costs.
PathAI, Inc:Positioning – Innovator/Challenger (Digital Pathology). PathAI has advanced from research-use algorithms to regulated clinical software, with AISight® Dx receiving FDA 510(k) clearance and CE-IVD marking for primary diagnosis. In 2025, the company expanded AISight Dx compatibility to additional high-volume slide scanners, a device-agnostic move that eases hospital deployment and accelerates clinical workflow integration. The strategy centers on embedding AI into routine pathology—ROI hotspot for hospitals aiming to raise throughput and reduce diagnostic variability in prostate, breast, and GI cancers.
PathAI’s edge lies in its regulated image-management platform tightly coupled with oncology-focused algorithms, positioning it as a partner of choice for labs migrating from pilot AI use to enterprise-wide primary diagnosis. As budgets pivot to automation and quality metrics in 2025–2027, PathAI’s clearance footprint and interoperability can translate into faster deal cycles and higher software attach rates.
Paige AI Inc.:Positioning – Innovator (now part of Tempus). Paige is recognized for pioneering FDA-cleared pathology AI and, in 2025, secured FDA Breakthrough Device designation for its PanCancer Detect application aimed at multi-tissue cancer detection—an avenue with outsized clinical and commercial potential in screening and triage. The firm’s earlier prostate-focused portfolio established clinical utility benchmarks that catalyzed hospital interest in AI-assisted pathology.
Following its August 2025 acquisition by Tempus, Paige’s algorithms and digital pathology stack gain access to a larger distribution network and complementary genomic data—improving model performance and enabling end-to-end diagnostic pathways. For health systems, the combined offering reduces integration complexity; for investors, it signals consolidation toward full-stack oncology platforms capable of capturing more value across testing, decision support, and therapy selection.
Market Key Players
Paige AI Inc
EarlySign
Cancer Center.ai
PathAI, Inc
Tempus AI, Inc
SkinVision
Flatiron Health
Driver:
AI-Driven Precision Becomes Essential Amid Rising Cancer Burden
As of 2025, the accelerating global cancer burden has become a defining force behind the expansion of the AI in cancer diagnostics market. With nearly 20 million new cancer cases reported annually and projections suggesting this figure will approach 30 million by 2040, healthcare systems face mounting pressure to improve diagnostic accuracy and speed. Traditional diagnostic pathways often involve lengthy processes and can overlook subtle early-stage indicators. AI offers a transformative alternative—advanced algorithms now outperform conventional methods by processing vast datasets from radiology, pathology, and genomics with greater precision. This capability not only shortens turnaround times by up to 30% but also reduces human variability, positioning AI as a critical enabler in addressing the global diagnostic gap. Strategically, this creates a competitive advantage for companies delivering AI-powered platforms, while healthcare providers adopting such systems gain measurable improvements in clinical outcomes and efficiency.
Restraint:
Data Privacy Risks and High Costs Slow AI Diagnostic Adoption
Despite rapid adoption, the market is constrained by escalating data privacy concerns and high upfront investment requirements. AI models rely on extensive patient datasets, making compliance with strict regulations such as HIPAA and GDPR a central challenge. The healthcare sector continues to be a prime target for cyberattacks—over 130 million patient records were exposed globally in 2024, signaling persistent vulnerabilities. Financial barriers also weigh heavily: deploying deep-learning-based diagnostic platforms often requires US$100,000–500,000 in infrastructure and training costs, creating barriers for smaller hospitals and clinics. For investors and technology providers, these limitations mean that scalability hinges on both lowering integration costs and demonstrating secure, regulation-compliant data handling practices. Without addressing these challenges, AI penetration risks being uneven across regions and provider types.
Opportunity:
AI Adoption Accelerates as Oncology Workforce Shortages Deepen
A widening shortage of skilled pathologists and oncologists presents one of the strongest growth levers for AI adoption in cancer diagnostics. In the U.S., fewer than 2% of medical graduates enter pathology, and nearly half of the current workforce is approaching retirement age. Meanwhile, cancer case volumes are rising sharply, amplifying diagnostic bottlenecks. AI-driven platforms offer a scalable solution by automating preliminary screenings, quantifying biomarkers, and triaging cases to support human specialists. Markets that embrace AI augmentation stand to reduce diagnostic backlogs significantly while improving patient throughput. With the global AI in cancer diagnostics sector projected to surpass US$2.3 billion by 2034 at a CAGR of 24.2%, solutions aimed at workforce supplementation and workflow optimization are expected to capture a disproportionate share of this expansion. This presents a high-potential avenue for both established technology leaders and emerging startups focused on precision oncology.
Trend:
Early Detection Revolution: AI-Powered Screening Sets New Standards
In 2025, a defining trend is the surge of AI applications in early detection and population-scale cancer screening programs. Regulatory agencies are increasingly validating these tools, with the FDA clearing dozens of AI-enabled diagnostic devices in the first half of 2025 alone. Newer algorithms integrated into mammography, lung CT, and dermatology platforms have demonstrated 10–20% improvements in early-stage detection accuracy compared to conventional methods. Beyond imaging, AI is now advancing in immuno-oncology, where real-time monitoring systems are being tested to predict immune-related adverse events during cancer therapy. This convergence of early detection and personalized treatment strategies is reshaping oncology practices globally. For investors and stakeholders, the rapid adoption of AI-based screening tools signals a fundamental shift: early detection is transitioning from a resource-intensive specialty function into a scalable, AI-driven standard of care, unlocking new growth opportunities across both developed and emerging healthcare markets.
Recent Developments
Dec 2024 – iCAD, Inc.: Unveiled next-generation ProFound® AI for breast imaging at RSNA 2024 and announced a ProFound Health partnership with Cascaid Health; the Version 4.0 release reports a 22% overall improvement in detecting challenging cancer subtypes vs. the prior version, including a 50% gain in dense tissue and 60% in invasive lobular cancers.
Feb 2025 – Tempus AI, Inc.: Closed the acquisition of Ambry Genetics for US$375 million in cash plus US$225 million in shares, expanding into hereditary and germline testing at national scale; financing support from Ares Management accompanied the transaction.
Apr 2025 – Paige: Secured FDA Breakthrough Device designation for PanCancer Detect, an AI intended to assist pathologists in identifying malignancy across multiple tissues—an early step toward multi-tissue screening and triage.
Jul 2025 – PathAI: Received FDA 510(k) clearance for AISight® Dx, a digital pathology image management system authorized for primary diagnosis in clinical settings; the clearance covers interoperability with a range of scanners and displays.
Aug 2025 – Tempus AI, Inc.: Announced the acquisition of Paige for ~US$81–81.25 million, bringing FDA-cleared pathology AI and ~7 million digitized slides into Tempus’ platform.
Sep 2025 – GE HealthCare: Debuted an AI-supported solution at ASTRO 2025 designed to shorten and standardize radiation therapy workflows across planning and delivery.