AI in Event Management Market Size, Share & Growth | CAGR 19.8%
Global AI in Event Management Market Size, Share, and Industry Analysis by Component (Software, Services), by Deployment Mode (Cloud-Based, On-Premise), by Application (Event Planning & Scheduling, Attendee Engagement, Marketing & Promotion, Ticketing & Registration, Analytics & Reporting), by Event Type (Corporate Events, Entertainment & Sports, Conferences & Exhibitions, Virtual & Hybrid Events), by End User (Enterprises, Event Organizers, Venues), Regional Insights, Competitive Landscape, Technology Trends, Market Dynamics, and Forecast 2025–2034
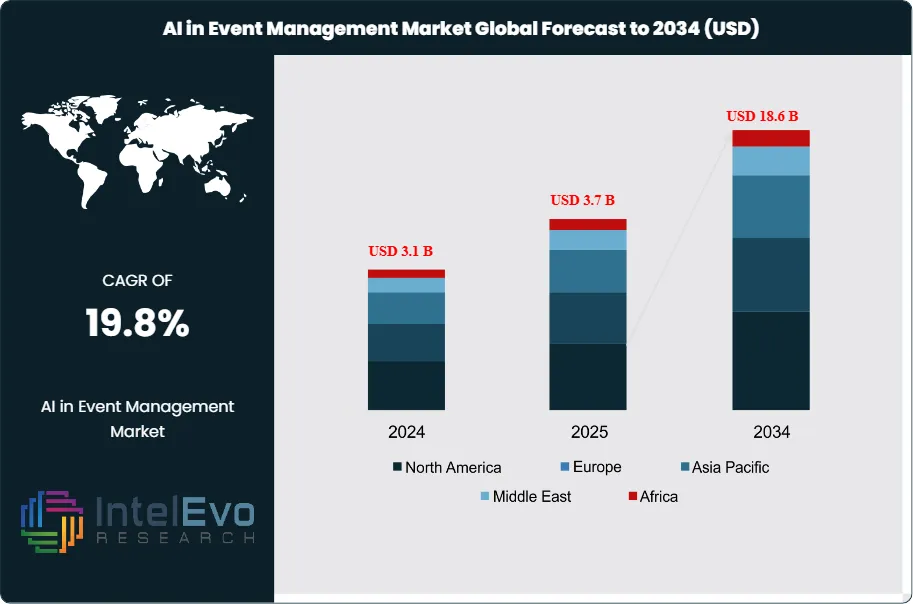
The AI in Event Management Market is estimated at USD 3.1 billion in 2024 and is projected to reach approximately USD 18.6 billion by 2034, registering a compound annual growth rate (CAGR) of 19.8% during 2025–2034. This strong expansion is driven by the rapid adoption of AI-powered tools for event planning, audience engagement, and real-time analytics across corporate, entertainment, and large-scale public events. Event organizers are increasingly leveraging AI for personalized attendee experiences, predictive demand forecasting, automated scheduling, and dynamic pricing. In parallel, the rise of hybrid and virtual events, coupled with growing demand for data-driven decision-making and cost optimization, is accelerating AI integration and positioning the market for sustained long-term growth across global event ecosystems.
This expansion reflects a structural shift in how organizations plan, execute, and evaluate events, with artificial intelligence moving from experimental use cases to core operational infrastructure. Over the past five years, the market has transitioned from pilot deployments to scaled adoption, supported by rising corporate event volumes and the need to manage increasingly complex attendee data.
Demand-side momentum is strong. Approximately 70% of event planners now deploy AI tools to streamline registration, ticketing, and attendee engagement. These solutions reduce planning costs by up to 30% through automated scheduling, budgeting, and resource allocation. On the attendee side, AI-driven personalization strategies are improving satisfaction by 20%, as platforms tailor agendas, networking opportunities, and content recommendations to individual preferences. Supply-side factors are equally important. Cloud providers and AI vendors are expanding infrastructure to support real-time analytics and predictive modeling. Amazon Web Services, for example, has committed USD 15.24 billion in Japan by 2027 to expand cloud capacity, underscoring the scale of investment flowing into AI-enabled services.
The funding environment reinforces this trajectory. In 2023, average funding for AI startups rose by 66%, signaling investor confidence in the commercial viability of AI-driven event solutions. These capital inflows are accelerating product development in areas such as conversational AI, predictive analytics, and automated customer support. The ability of AI to process large data volumes in real time is also enhancing adaptability, with event managers reporting a 25% improvement in their capacity to adjust agendas, logistics, and resource allocation on short notice.
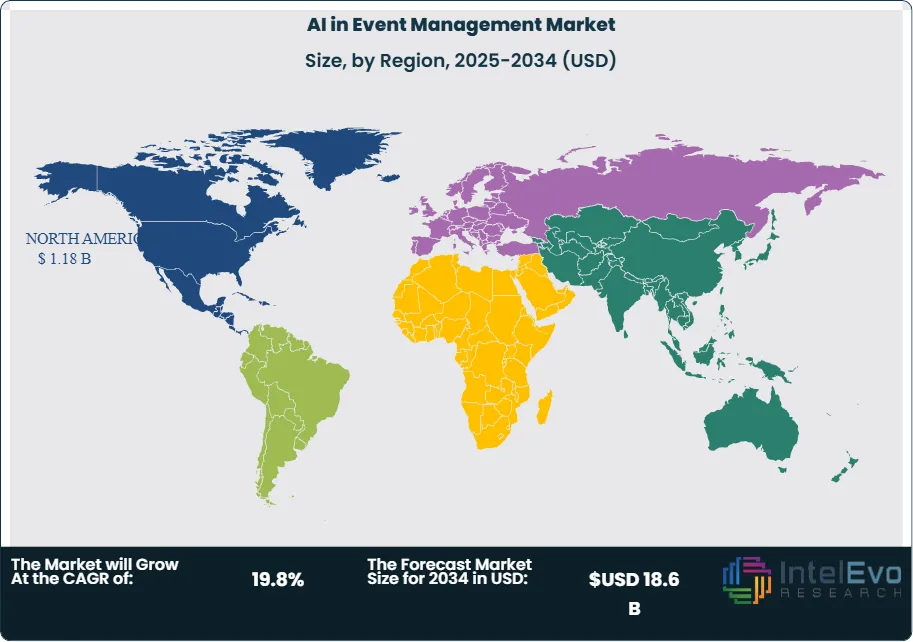
Regional adoption patterns highlight both maturity and opportunity. North America and Western Europe remain the largest markets, driven by high corporate event density and advanced digital infrastructure. Asia-Pacific is emerging as the fastest-growing region, supported by large-scale investments in cloud and AI ecosystems, particularly in Japan, China, and India. For investors, these markets represent near-term growth hotspots, while Latin America and the Middle East are expected to gain traction as digital infrastructure strengthens.
The market outlook is clear. AI in event management is no longer a peripheral tool but a strategic enabler of efficiency, personalization, and scalability. For stakeholders, the next decade will be defined by the ability to integrate AI into core event operations, capture cost savings, and deliver measurable improvements in attendee engagement.
Key Takeaways
Market Growth: The global AI in event management market was valued at USD 3.1 billion in 2024 and is projected to reach USD 18.6 billion by 2034, expanding at a CAGR of 19.8%. Growth is driven by rising demand for automation, real-time analytics, and personalized attendee engagement.
Component: Software accounted for 68.5% of total revenue in 2023, reflecting strong adoption of AI-powered platforms for registration, ticketing, and predictive analytics. Hardware and services remain secondary contributors but are expected to gain traction as integration complexity increases.
Deployment Mode: Cloud-based solutions captured 69.1% of the market in 2023, supported by scalability, lower upfront costs, and rapid deployment. On-premise deployments continue to serve regulated industries but are losing share as enterprises migrate to cloud ecosystems.
Application: Event planning represented 34.8% of market share in 2023, making it the largest application area. AI tools are increasingly used for scheduling, budgeting, and resource allocation, reducing operational costs by up to 30%.
End User: Event organizers and planners held 42.3% of the market in 2023, reflecting their reliance on AI to manage large-scale conferences and exhibitions. Corporate enterprises and hospitality providers are emerging as secondary adopters.
Driver: Rising corporate event volumes and the need for real-time decision-making are accelerating adoption. AI-driven personalization has improved attendee satisfaction by 20%, while automation has cut planning time by up to 25%.
Restraint: High implementation costs and integration challenges limit adoption among small and mid-sized event firms. These barriers slow penetration in emerging markets where budgets remain constrained.
Opportunity: Asia-Pacific is expected to record the fastest CAGR through 2033, supported by large-scale investments in AI infrastructure in Japan, China, and India. This region offers significant upside for vendors targeting high-growth corporate and entertainment event segments.
Trend: AI-powered chatbots, recommendation engines, and predictive analytics are becoming standard features. In 2023, funding for AI startups rose 66%, signaling strong investor confidence in expanding AI applications for event management.
Regional Analysis: North America led with 38.8% share and USD 0.69 billion in revenue in 2023, driven by advanced digital infrastructure and high corporate event density. Asia-Pacific is the fastest-growing region, while Europe remains a stable market with strong adoption in corporate and trade events.
Component Analysis
By 2025, software continues to dominate the AI in event management market, accounting for more than two-thirds of total revenue. Its strength lies in automating critical functions such as registration, scheduling, and resource allocation, which collectively reduce planning costs by up to 30%. AI-enabled platforms now integrate predictive analytics and personalization engines, allowing organizers to tailor agendas and networking opportunities to individual participants. This capability has driven adoption among large-scale conferences and exhibitions, where attendee satisfaction is a key performance metric.
Services, while smaller in share, are becoming increasingly important as enterprises seek customized deployments. Consulting, integration, and ongoing support services are essential for organizations with complex event portfolios or compliance requirements. As AI applications expand into multilingual support, accessibility, and security, service providers are expected to capture a growing share of incremental spending. The combined strength of software and services ensures that AI adoption is not only about automation but also about adaptability to diverse event formats and organizational needs.
Deployment Mode Analysis
Cloud-based platforms represent the clear preference in 2025, holding more than 70% of the market. Their appeal lies in scalability, cost efficiency, and real-time data integration, which are critical for managing hybrid and global events. Cloud solutions enable instant updates across devices, support large attendee volumes, and provide advanced analytics dashboards that improve decision-making during live events. The rise of subscription-based models has further reduced barriers to entry, making cloud adoption accessible to mid-sized event firms.
On-premise deployments remain relevant for organizations handling sensitive data or high-profile events where security and compliance are paramount. Governments, defense-related conferences, and financial institutions continue to rely on locally managed systems. However, the overall market trajectory favors cloud adoption, with hybrid models emerging as a middle ground. Vendors offering flexible deployment options are best positioned to capture demand across both segments.
Application Analysis
Event planning remains the largest application area, contributing over one-third of total market revenue in 2025. AI tools are now widely used for venue selection, budgeting, and logistics optimization, reducing manual errors and improving efficiency. Predictive scheduling algorithms have become standard, enabling organizers to anticipate attendance peaks and allocate resources accordingly.
Event marketing and attendee management are expanding rapidly. AI-driven marketing platforms analyze behavioral data to deliver targeted campaigns, while attendee management systems automate registration, feedback collection, and engagement tracking. These applications have demonstrated measurable impact, with AI-driven personalization improving attendee satisfaction by 20% and retention rates by 15%.
Other applications, including security monitoring, accessibility services, and post-event analytics, are gaining traction. For example, AI-powered surveillance tools are being deployed at large venues to enhance safety, while real-time translation services are improving inclusivity at international events. Though smaller in current share, these applications represent high-growth niches with strong long-term potential.
End-User Analysis
Professional event organizers and planners remain the largest end-user group, accounting for more than 40% of the market in 2025. Their reliance on AI stems from the need to manage complex, multi-day events with thousands of participants. Automation of logistics, scheduling, and attendee engagement has become essential to maintaining efficiency and profitability.
Corporate users are expanding their adoption of AI for product launches, investor meetings, and internal conferences. The ability to deliver personalized experiences at scale is driving adoption among Fortune 500 companies, particularly in technology and financial services. Governments are also increasing their use of AI for high-security events, policy summits, and public gatherings, where compliance and precision are critical.
Other end-users, including universities, non-profits, and hospitality providers, are beginning to integrate AI into workshops, fundraising events, and guest experiences. While smaller in share, this segment is expected to grow steadily as AI solutions become more affordable and accessible.
Regional Analysis
North America remains the largest regional market in 2025, holding nearly 38% of global revenue. The region benefits from advanced digital infrastructure, high corporate event density, and the presence of leading AI vendors. The United States continues to lead adoption, with strong demand from technology, healthcare, and financial services sectors.
Europe follows closely, supported by strong adoption in Germany, the UK, and France. The region’s emphasis on compliance and data privacy has driven demand for secure AI solutions, particularly in government and corporate events. Asia Pacific, however, is the fastest-growing region, projected to expand at a CAGR above 25% through 2033. Investments in AI infrastructure in China, Japan, and India are fueling adoption, with large-scale exhibitions and entertainment events driving demand.
Latin America and the Middle East & Africa remain smaller markets but are showing steady growth. Brazil, the UAE, and Saudi Arabia are emerging as regional hubs, supported by investments in tourism and large-scale international events. As digital infrastructure improves, these regions are expected to play a more prominent role in the global market over the next decade.
Component, (Software, Services), Deployment Mode, (Cloud-Based, On-Premise), Application, (Event Planning, Event Marketing, Attendee Management, Other Applications), End-User, (Event Organizers and Planners, Corporate, Government, Other End-Users)
Research Methodology
Primary Research- 100 Interviews of Stakeholders
Secondary Research
Desk Research
Regional scope
North America (United States, Canada, Mexico)
Latin America (Brazil, Argentina, Columbia)
East Asia And Pacific (China, Japan, South Korea, Australia, Cambodia, Fiji, Indonesia)
Sea And South Asia (India, Singapore, Thailand, Taiwan, Malaysia)
Eastern Europe (Poland, Russia, Czech Republic, Romania)
Western Europe (Germany, U.K., France, Spain, Itlay)
Middle East & Africa (GCC Countries, Egypt, Nigeria, South Africa, Israel)
Competitive Landscape
RainFocus, Grip, Zoho Corporation, Hubilo, Cvent Inc., Taskade, Eventbrite, OpenAI, Community Brands Intermediate, LLC, ClickUp, Other Key Players
Customization Scope
Customization for segments, region/country-level will be provided. Moreover, additional customization can be done based on the requirements.
Pricing and Purchase Options
Avail customized purchase options to meet your exact research needs. We have three licenses to opt for: Single User License, Multi-User License (Up to 5 Users), Corporate Use License (Unlimited User and Printable PDF).
TABLE OF CONTENTS
1. EXECUTIVE SUMMARY
1.1. MARKET SNAPSHOT
1.2. KEY FINDINGS & INSIGHTS
1.3. ANALYST RECOMMENDATIONS
1.4. FUTURE OUTLOOK
2. RESEARCH METHODOLOGY
2.1. MARKET DEFINITION & SCOPE
2.2. RESEARCH OBJECTIVES: PRIMARY & SECONDARY DATA SOURCES
2.3. DATA COLLECTION SOURCES
2.3.1. COVERAGE OF 100+ PRIMARY RESEARCH/CONSULTATION CALLS WITH INDUSTRY STAKEHOLDERS
FIGURE 17 NORTH AMERICA AI IN EVENT MANAGEMENT CURRENT AND FUTURE TYPE ANALYSIS, 2025–2034, (USD MILLION)
FIGURE 18 NORTH AMERICA AI IN EVENT MANAGEMENT CURRENT AND FUTURE END USER ANALYSIS, 2025–2034, (USD MILLION)
FIGURE 19 MARKET SHARE BY COUNTRY
FIGURE 20 LATIN AMERICA AI IN EVENT MANAGEMENT CURRENT AND FUTURE TYPE ANALYSIS, 2025–2034, (USD MILLION)
FIGURE 21 LATIN AMERICA AI IN EVENT MANAGEMENT CURRENT AND FUTURE END USER ANALYSIS, 2025–2034, (USD MILLION)
FIGURE 22 MARKET SHARE BY COUNTRY
FIGURE 23 EASTERN EUROPE AI IN EVENT MANAGEMENT CURRENT AND FUTURE TYPE ANALYSIS, 2025–2034, (USD MILLION)
FIGURE 24 EASTERN EUROPE AI IN EVENT MANAGEMENT CURRENT AND FUTURE END USER ANALYSIS, 2025–2034, (USD MILLION)
FIGURE 25 MARKET SHARE BY COUNTRY
FIGURE 26 WESTERN EUROPE AI IN EVENT MANAGEMENT CURRENT AND FUTURE TYPE ANALYSIS, 2025–2034, (USD MILLION)
FIGURE 27 WESTERN EUROPE AI IN EVENT MANAGEMENT CURRENT AND FUTURE END USER ANALYSIS, 2025–2034, (USD MILLION)
FIGURE 28 MARKET SHARE BY COUNTRY
FIGURE 29 EAST ASIA AND PACIFIC AI IN EVENT MANAGEMENT CURRENT AND FUTURE TYPE ANALYSIS, 2025–2034, (USD MILLION)
FIGURE 30 EAST ASIA AND PACIFIC AI IN EVENT MANAGEMENT CURRENT AND FUTURE END USER ANALYSIS, 2025–2034, (USD MILLION)
FIGURE 31 MARKET SHARE BY COUNTRY
FIGURE 32 SEA AND SOUTH ASIA AI IN EVENT MANAGEMENT CURRENT AND FUTURE TYPE ANALYSIS, 2025–2034, (USD MILLION)
FIGURE 33 SEA AND SOUTH ASIA AI IN EVENT MANAGEMENT CURRENT AND FUTURE END USER ANALYSIS, 2025–2034, (USD MILLION)
FIGURE 34 MARKET SHARE BY COUNTRY
FIGURE 35 MIDDLE EAST AND AFRICA AI IN EVENT MANAGEMENT CURRENT AND FUTURE TYPE ANALYSIS, 2025–2034, (USD MILLION)
FIGURE 36 MIDDLE EAST AND AFRICA AI IN EVENT MANAGEMENT CURRENT AND FUTURE END USER ANALYSIS, 2025–2034, (USD MILLION)
FIGURE 37 NORTH AMERICA AI IN EVENT MANAGEMENT CURRENT AND FUTURE MARKET VOLUME SHARE REGIONAL ANALYSIS, 2025–2034, (USD MILLION)
FIGURE 38 U.S. AI IN EVENT MANAGEMENT CURRENT AND FUTURE TYPE ANALYSIS, 2025–2034, (USD MILLION)
FIGURE 39 U.S. AI IN EVENT MANAGEMENT CURRENT AND FUTURE END USER ANALYSIS, 2025–2034, (USD MILLION)
FIGURE 40 CANADA AI IN EVENT MANAGEMENT CURRENT AND FUTURE TYPE ANALYSIS, 2025–2034, (USD MILLION)
FIGURE 41 CANADA AI IN EVENT MANAGEMENT CURRENT AND FUTURE END USER ANALYSIS, 2025–2034, (USD MILLION)
FIGURE 42 LATIN AMERICA AI IN EVENT MANAGEMENT CURRENT AND FUTURE MARKET VOLUME SHARE REGIONAL ANALYSIS, 2025–2034, (USD MILLION)
FIGURE 43 MEXICO AI IN EVENT MANAGEMENT CURRENT AND FUTURE TYPE ANALYSIS, 2025–2034, (USD MILLION)
FIGURE 44 MEXICO AI IN EVENT MANAGEMENT CURRENT AND FUTURE END USER ANALYSIS, 2025–2034, (USD MILLION)
FIGURE 45 BRAZIL AI IN EVENT MANAGEMENT CURRENT AND FUTURE TYPE ANALYSIS, 2025–2034, (USD MILLION)
FIGURE 46 BRAZIL AI IN EVENT MANAGEMENT CURRENT AND FUTURE END USER ANALYSIS, 2025–2034, (USD MILLION)
FIGURE 47 ARGENTINA AI IN EVENT MANAGEMENT CURRENT AND FUTURE TYPE ANALYSIS, 2025–2034, (USD MILLION)
FIGURE 48 ARGENTINA AI IN EVENT MANAGEMENT CURRENT AND FUTURE END USER ANALYSIS, 2025–2034, (USD MILLION)
FIGURE 49 COLUMBIA AI IN EVENT MANAGEMENT CURRENT AND FUTURE TYPE ANALYSIS, 2025–2034, (USD MILLION)
FIGURE 50 COLUMBIA AI IN EVENT MANAGEMENT CURRENT AND FUTURE END USER ANALYSIS, 2025–2034, (USD MILLION)
FIGURE 51 REST OF LATIN AMERICA AI IN EVENT MANAGEMENT CURRENT AND FUTURE TYPE ANALYSIS, 2025–2034, (USD MILLION)
FIGURE 52 REST OF LATIN AMERICA AI IN EVENT MANAGEMENT CURRENT AND FUTURE END USER ANALYSIS, 2025–2034, (USD MILLION)
FIGURE 53 EASTERN EUROPE AI IN EVENT MANAGEMENT CURRENT AND FUTURE MARKET VOLUME SHARE REGIONAL ANALYSIS, 2025–2034, (USD MILLION)
FIGURE 54 POLAND AI IN EVENT MANAGEMENT CURRENT AND FUTURE TYPE ANALYSIS, 2025–2034, (USD MILLION)
FIGURE 55 POLAND AI IN EVENT MANAGEMENT CURRENT AND FUTURE END USER ANALYSIS, 2025–2034, (USD MILLION)
FIGURE 56 RUSSIA AI IN EVENT MANAGEMENT CURRENT AND FUTURE TYPE ANALYSIS, 2025–2034, (USD MILLION)
FIGURE 57 RUSSIA AI IN EVENT MANAGEMENT CURRENT AND FUTURE END USER ANALYSIS, 2025–2034, (USD MILLION)
FIGURE 58 CZECH REPUBLIC AI IN EVENT MANAGEMENT CURRENT AND FUTURE TYPE ANALYSIS, 2025–2034, (USD MILLION)
FIGURE 59 CZECH REPUBLIC AI IN EVENT MANAGEMENT CURRENT AND FUTURE END USER ANALYSIS, 2025–2034, (USD MILLION)
FIGURE 60 ROMANIA AI IN EVENT MANAGEMENT CURRENT AND FUTURE TYPE ANALYSIS, 2025–2034, (USD MILLION)
FIGURE 61 ROMANIA AI IN EVENT MANAGEMENT CURRENT AND FUTURE END USER ANALYSIS, 2025–2034, (USD MILLION)
FIGURE 62 REST OF EASTERN EUROPE AI IN EVENT MANAGEMENT CURRENT AND FUTURE TYPE ANALYSIS, 2025–2034, (USD MILLION)
FIGURE 63 REST OF EASTERN EUROPE AI IN EVENT MANAGEMENT CURRENT AND FUTURE END USER ANALYSIS, 2025–2034, (USD MILLION)
FIGURE 64 WESTERN EUROPE AI IN EVENT MANAGEMENT CURRENT AND FUTURE MARKET VOLUME SHARE REGIONAL ANALYSIS, 2025–2034, (USD MILLION)
FIGURE 65 GERMANY AI IN EVENT MANAGEMENT CURRENT AND FUTURE TYPE ANALYSIS, 2025–2034, (USD MILLION)
FIGURE 66 GERMANY AI IN EVENT MANAGEMENT CURRENT AND FUTURE END USER ANALYSIS, 2025–2034, (USD MILLION)
FIGURE 67 FRANCE AI IN EVENT MANAGEMENT CURRENT AND FUTURE TYPE ANALYSIS, 2025–2034, (USD MILLION)
FIGURE 68 FRANCE AI IN EVENT MANAGEMENT CURRENT AND FUTURE END USER ANALYSIS, 2025–2034, (USD MILLION)
FIGURE 69 UK AI IN EVENT MANAGEMENT CURRENT AND FUTURE TYPE ANALYSIS, 2025–2034, (USD MILLION)
FIGURE 70 UK AI IN EVENT MANAGEMENT CURRENT AND FUTURE END USER ANALYSIS, 2025–2034, (USD MILLION)
FIGURE 71 SPAIN AI IN EVENT MANAGEMENT CURRENT AND FUTURE TYPE ANALYSIS, 2025–2034, (USD MILLION)
FIGURE 72 SPAIN AI IN EVENT MANAGEMENT CURRENT AND FUTURE END USER ANALYSIS, 2025–2034, (USD MILLION)
FIGURE 73 ITALY AI IN EVENT MANAGEMENT CURRENT AND FUTURE TYPE ANALYSIS, 2025–2034, (USD MILLION)
FIGURE 74 ITALY AI IN EVENT MANAGEMENT CURRENT AND FUTURE END USER ANALYSIS, 2025–2034, (USD MILLION)
FIGURE 75 REST OF WESTERN EUROPE AI IN EVENT MANAGEMENT CURRENT AND FUTURE TYPE ANALYSIS, 2025–2034, (USD MILLION)
FIGURE 76 REST OF WESTERN EUROPE AI IN EVENT MANAGEMENT CURRENT AND FUTURE END USER ANALYSIS, 2025–2034, (USD MILLION)
FIGURE 77 EAST ASIA AND PACIFIC AI IN EVENT MANAGEMENT CURRENT AND FUTURE MARKET VOLUME SHARE REGIONAL ANALYSIS, 2025–2034, (USD MILLION)
FIGURE 78 CHINA AI IN EVENT MANAGEMENT CURRENT AND FUTURE TYPE ANALYSIS, 2025–2034, (USD MILLION)
FIGURE 79 CHINA AI IN EVENT MANAGEMENT CURRENT AND FUTURE END USER ANALYSIS, 2025–2034, (USD MILLION)
FIGURE 80 JAPAN AI IN EVENT MANAGEMENT CURRENT AND FUTURE TYPE ANALYSIS, 2025–2034, (USD MILLION)
FIGURE 81 JAPAN AI IN EVENT MANAGEMENT CURRENT AND FUTURE END USER ANALYSIS, 2025–2034, (USD MILLION)
FIGURE 82 AUSTRALIA AI IN EVENT MANAGEMENT CURRENT AND FUTURE TYPE ANALYSIS, 2025–2034, (USD MILLION)
FIGURE 83 AUSTRALIA AI IN EVENT MANAGEMENT CURRENT AND FUTURE END USER ANALYSIS, 2025–2034, (USD MILLION)
FIGURE 84 CAMBODIA AI IN EVENT MANAGEMENT CURRENT AND FUTURE TYPE ANALYSIS, 2025–2034, (USD MILLION)
FIGURE 85 CAMBODIA AI IN EVENT MANAGEMENT CURRENT AND FUTURE END USER ANALYSIS, 2025–2034, (USD MILLION)
FIGURE 86 FIJI AI IN EVENT MANAGEMENT CURRENT AND FUTURE TYPE ANALYSIS, 2025–2034, (USD MILLION)
FIGURE 87 FIJI AI IN EVENT MANAGEMENT CURRENT AND FUTURE END USER ANALYSIS, 2025–2034, (USD MILLION)
FIGURE 88 INDONESIA AI IN EVENT MANAGEMENT CURRENT AND FUTURE TYPE ANALYSIS, 2025–2034, (USD MILLION)
FIGURE 89 INDONESIA AI IN EVENT MANAGEMENT CURRENT AND FUTURE END USER ANALYSIS, 2025–2034, (USD MILLION)
FIGURE 90 SOUTH KOREA AI IN EVENT MANAGEMENT CURRENT AND FUTURE TYPE ANALYSIS, 2025–2034, (USD MILLION)
FIGURE 91 SOUTH KOREA AI IN EVENT MANAGEMENT CURRENT AND FUTURE END USER ANALYSIS, 2025–2034, (USD MILLION)
FIGURE 92 REST OF EAST ASIA AND PACIFIC AI IN EVENT MANAGEMENT CURRENT AND FUTURE TYPE ANALYSIS, 2025–2034, (USD MILLION)
FIGURE 93 REST OF EAST ASIA AND PACIFIC AI IN EVENT MANAGEMENT CURRENT AND FUTURE END USER ANALYSIS, 2025–2034, (USD MILLION)
FIGURE 94 SEA AND SOUTH ASIA AI IN EVENT MANAGEMENT CURRENT AND FUTURE MARKET VOLUME SHARE REGIONAL ANALYSIS, 2025–2034, (USD MILLION)
FIGURE 95 BANGLADESH AI IN EVENT MANAGEMENT CURRENT AND FUTURE TYPE ANALYSIS, 2025–2034, (USD MILLION)
FIGURE 96 BANGLADESH AI IN EVENT MANAGEMENT CURRENT AND FUTURE END USER ANALYSIS, 2025–2034, (USD MILLION)
FIGURE 97 NEW ZEALAND AI IN EVENT MANAGEMENT CURRENT AND FUTURE TYPE ANALYSIS, 2025–2034, (USD MILLION)
FIGURE 98 NEW ZEALAND AI IN EVENT MANAGEMENT CURRENT AND FUTURE END USER ANALYSIS, 2025–2034, (USD MILLION)
FIGURE 99 INDIA AI IN EVENT MANAGEMENT CURRENT AND FUTURE TYPE ANALYSIS, 2025–2034, (USD MILLION)
FIGURE 100 INDIA AI IN EVENT MANAGEMENT CURRENT AND FUTURE END USER ANALYSIS, 2025–2034, (USD MILLION)
FIGURE 101 SINGAPORE AI IN EVENT MANAGEMENT CURRENT AND FUTURE TYPE ANALYSIS, 2025–2034, (USD MILLION)
FIGURE 102 SINGAPORE AI IN EVENT MANAGEMENT CURRENT AND FUTURE END USER ANALYSIS, 2025–2034, (USD MILLION)
FIGURE 103 THAILAND AI IN EVENT MANAGEMENT CURRENT AND FUTURE TYPE ANALYSIS, 2025–2034, (USD MILLION)
FIGURE 104 THAILAND AI IN EVENT MANAGEMENT CURRENT AND FUTURE END USER ANALYSIS, 2025–2034, (USD MILLION)
FIGURE 105 TAIWAN AI IN EVENT MANAGEMENT CURRENT AND FUTURE TYPE ANALYSIS, 2025–2034, (USD MILLION)
FIGURE 106 TAIWAN AI IN EVENT MANAGEMENT CURRENT AND FUTURE END USER ANALYSIS, 2025–2034, (USD MILLION)
FIGURE 107 MALAYSIA AI IN EVENT MANAGEMENT CURRENT AND FUTURE TYPE ANALYSIS, 2025–2034, (USD MILLION)
FIGURE 108 MALAYSIA AI IN EVENT MANAGEMENT CURRENT AND FUTURE END USER ANALYSIS, 2025–2034, (USD MILLION)
FIGURE 109 REST OF SEA AND SOUTH ASIA AI IN EVENT MANAGEMENT CURRENT AND FUTURE TYPE ANALYSIS, 2025–2034, (USD MILLION)
FIGURE 110 REST OF SEA AND SOUTH ASIA AI IN EVENT MANAGEMENT CURRENT AND FUTURE END USER ANALYSIS, 2025–2034, (USD MILLION)
FIGURE 111 MIDDLE EAST AND AFRICA AI IN EVENT MANAGEMENT CURRENT AND FUTURE MARKET VOLUME SHARE REGIONAL ANALYSIS, 2025–2034, (USD MILLION)
FIGURE 112 GCC COUNTRIES AI IN EVENT MANAGEMENT CURRENT AND FUTURE TYPE ANALYSIS, 2025–2034, (USD MILLION)
FIGURE 113 GCC COUNTRIES AI IN EVENT MANAGEMENT CURRENT AND FUTURE END USER ANALYSIS, 2025–2034, (USD MILLION)
FIGURE 114 SAUDI ARABIA AI IN EVENT MANAGEMENT CURRENT AND FUTURE TYPE ANALYSIS, 2025–2034, (USD MILLION)
FIGURE 115 SAUDI ARABIA AI IN EVENT MANAGEMENT CURRENT AND FUTURE END USER ANALYSIS, 2025–2034, (USD MILLION)
FIGURE 116 UAE AI IN EVENT MANAGEMENT CURRENT AND FUTURE TYPE ANALYSIS, 2025–2034, (USD MILLION)
FIGURE 117 UAE AI IN EVENT MANAGEMENT CURRENT AND FUTURE END USER ANALYSIS, 2025–2034, (USD MILLION)
FIGURE 118 BAHRAIN AI IN EVENT MANAGEMENT CURRENT AND FUTURE TYPE ANALYSIS, 2025–2034, (USD MILLION)
FIGURE 119 BAHRAIN AI IN EVENT MANAGEMENT CURRENT AND FUTURE END USER ANALYSIS, 2025–2034, (USD MILLION)
FIGURE 120 KUWAIT AI IN EVENT MANAGEMENT CURRENT AND FUTURE TYPE ANALYSIS, 2025–2034, (USD MILLION)
FIGURE 121 KUWAIT AI IN EVENT MANAGEMENT CURRENT AND FUTURE END USER ANALYSIS, 2025–2034, (USD MILLION)
FIGURE 122 OMAN AI IN EVENT MANAGEMENT CURRENT AND FUTURE TYPE ANALYSIS, 2025–2034, (USD MILLION)
FIGURE 123 OMAN AI IN EVENT MANAGEMENT CURRENT AND FUTURE END USER ANALYSIS, 2025–2034, (USD MILLION)
FIGURE 124 QATAR AI IN EVENT MANAGEMENT CURRENT AND FUTURE TYPE ANALYSIS, 2025–2034, (USD MILLION)
FIGURE 125 QATAR AI IN EVENT MANAGEMENT CURRENT AND FUTURE END USER ANALYSIS, 2025–2034, (USD MILLION)
FIGURE 126 EGYPT AI IN EVENT MANAGEMENT CURRENT AND FUTURE TYPE ANALYSIS, 2025–2034, (USD MILLION)
FIGURE 127 EGYPT AI IN EVENT MANAGEMENT CURRENT AND FUTURE END USER ANALYSIS, 2025–2034, (USD MILLION)
FIGURE 128 NIGERIA AI IN EVENT MANAGEMENT CURRENT AND FUTURE TYPE ANALYSIS, 2025–2034, (USD MILLION)
FIGURE 129 NIGERIA AI IN EVENT MANAGEMENT CURRENT AND FUTURE END USER ANALYSIS, 2025–2034, (USD MILLION)
FIGURE 130 SOUTH AFRICA AI IN EVENT MANAGEMENT CURRENT AND FUTURE TYPE ANALYSIS, 2025–2034, (USD MILLION)
FIGURE 131 SOUTH AFRICA AI IN EVENT MANAGEMENT CURRENT AND FUTURE END USER ANALYSIS, 2025–2034, (USD MILLION)
FIGURE 132 ISRAEL AI IN EVENT MANAGEMENT CURRENT AND FUTURE TYPE ANALYSIS, 2025–2034, (USD MILLION)
FIGURE 133 ISRAEL AI IN EVENT MANAGEMENT CURRENT AND FUTURE END USER ANALYSIS, 2025–2034, (USD MILLION)
FIGURE 134 REST OF MEA AI IN EVENT MANAGEMENT CURRENT AND FUTURE TYPE ANALYSIS, 2025–2034, (USD MILLION)
FIGURE 135 REST OF MEA AI IN EVENT MANAGEMENT CURRENT AND FUTURE END USER ANALYSIS, 2025–2034, (USD MILLION)
FIGURE 136 U. S. MARKET SHARE ANALYSIS BY TYPE (2024)
FIGURE 137 U. S. MARKET SHARE ANALYSIS BY END USER (2024)
FIGURE 138 CANADA MARKET SHARE ANALYSIS BY TYPE (2024)
FIGURE 139 CANADA MARKET SHARE ANALYSIS BY END USER (2024)
FIGURE 140 MEXICO MARKET SHARE ANALYSIS BY TYPE (2024)
FIGURE 141 MEXICO MARKET SHARE ANALYSIS BY END USER (2024)
FIGURE 142 CHINA MARKET SHARE ANALYSIS BY TYPE (2024)
FIGURE 143 CHINA MARKET SHARE ANALYSIS BY END USER (2024)
FIGURE 144 JAPAN MARKET SHARE ANALYSIS BY TYPE (2024)
FIGURE 145 JAPAN MARKET SHARE ANALYSIS BY END USER (2024)
FIGURE 146 INDIA MARKET SHARE ANALYSIS BY TYPE (2024)
FIGURE 147 INDIA MARKET SHARE ANALYSIS BY END USER (2024)
FIGURE 148 SOUTH KOREA MARKET SHARE ANALYSIS BY TYPE (2024)
FIGURE 149 SOUTH KOREA MARKET SHARE ANALYSIS BY END USER (2024)
FIGURE 150 SAUDI ARABIA MARKET SHARE ANALYSIS BY TYPE (2024)
FIGURE 151 SAUDI ARABIA MARKET SHARE ANALYSIS BY END USER (2024)
FIGURE 152 UAE MARKET SHARE ANALYSIS BY TYPE (2024)
FIGURE 153 UAE MARKET SHARE ANALYSIS BY END USER (2024)
FIGURE 154 EGYPT MARKET SHARE ANALYSIS BY TYPE (2024)
FIGURE 155 EGYPT MARKET SHARE ANALYSIS BY END USER (2024)
FIGURE 156 NIGERIA MARKET SHARE ANALYSIS BY TYPE (2024)
FIGURE 157 NIGERIA MARKET SHARE ANALYSIS BY END USER (2024)
FIGURE 158 SOUTH AFRICA MARKET SHARE ANALYSIS BY TYPE (2024)
FIGURE 159 SOUTH AFRICA MARKET SHARE ANALYSIS BY END USER (2024)
FIGURE 160 GERMANY MARKET SHARE ANALYSIS BY TYPE (2024)
FIGURE 161 GERMANY MARKET SHARE ANALYSIS BY END USER (2024)
FIGURE 162 FRANCE MARKET SHARE ANALYSIS BY TYPE (2024)
FIGURE 163 FRANCE MARKET SHARE ANALYSIS BY END USER (2024)
FIGURE 164 UK MARKET SHARE ANALYSIS BY TYPE (2024)
FIGURE 165 UK MARKET SHARE ANALYSIS BY END USER (2024)
FIGURE 166 SPAIN MARKET SHARE ANALYSIS BY TYPE (2024)
FIGURE 167 SPAIN MARKET SHARE ANALYSIS BY END USER (2024)
FIGURE 168 ITALY MARKET SHARE ANALYSIS BY TYPE (2024)
FIGURE 169 ITALY MARKET SHARE ANALYSIS BY END USER (2024)
FIGURE 170 BRAZIL MARKET SHARE ANALYSIS BY TYPE (2024)
FIGURE 171 BRAZIL MARKET SHARE ANALYSIS BY END USER (2024)
FIGURE 172 ARGENTINA MARKET SHARE ANALYSIS BY TYPE (2024)
FIGURE 173 ARGENTINA MARKET SHARE ANALYSIS BY END USER (2024)
FIGURE 174 COLUMBIA MARKET SHARE ANALYSIS BY TYPE (2024)
FIGURE 175 COLUMBIA MARKET SHARE ANALYSIS BY END USER (2024)
FIGURE 176 GLOBAL AI IN EVENT MANAGEMENT CURRENT AND FUTURE MARKET KEY COUNTRY LEVEL ANALYSIS, 2024–2034, (USD MILLION)
FIGURE 177 FINANCIAL OVERVIEW:
Key Player Analysis
OpenAI: OpenAI positions as an innovator, supplying the core foundation models that power conversational assistants, recommendation engines, and real-time analytics in event platforms. Its products include GPT-4 class models, APIs for fine-tuning, and enterprise tools for data governance. In 2025, event technology providers increasingly embed OpenAI’s models to automate attendee support, content generation, and agenda recommendations. Customers report reductions of 20–30% in support tickets and faster campaign turnaround times by 2–3 days. Strategically, OpenAI expands enterprise partnerships and invests in safety and compliance features, making its stack viable for regulated event workflows. The differentiator is model performance at scale, enterprise-grade controls, and broad developer adoption, which gives you a faster path to AI features without building models from scratch.
RainFocus: RainFocus is a leader in event marketing and management platforms, with strong penetration among large enterprises and technology conferences. The platform integrates registration, content programming, engagement, and analytics in a unified data model. In 2025, RainFocus accelerates AI feature deployment across personalization, predictive session capacity, and sponsor ROI reporting. Reported outcomes include 10–15% higher attendee engagement and 8–12% uplift in qualified leads for exhibitors. Strategic initiatives center on ecosystem partnerships with CRM and MAP vendors, expanded data connectors, and regional go-to-market in Europe and Asia Pacific. RainFocus differentiates through analytics depth, enterprise security certifications, and multi-event portfolio management, positioning your team to run global programs on a single stack.
Hubilo: Hubilo is a challenger focused on hybrid and virtual-first formats, serving mid-market and fast-growing enterprises. The platform covers registration, engagement widgets, live streaming, and sponsor tools, with AI-driven personalization for session recommendations and networking matches. In 2025, Hubilo prioritizes feature velocity and cost efficiency, targeting conversion metrics like 20% higher session attendance and 15% longer dwell time across virtual tracks. The company pursues partnerships with streaming providers, expands integrations with CRM and webinar tools, and adds multilingual and accessibility capabilities. Hubilo’s differentiators are speed to deploy, competitive pricing, and engagement tooling tuned for digital events, giving your team a practical option when budget and time-to-market are critical.
Taskade: Taskade is a niche player supporting event teams with AI-powered collaboration, workflow automation, and real-time task management. While not a full event platform, Taskade’s AI agents help plan agendas, produce content, track logistics, and coordinate cross-functional teams. In 2025, event organizers use Taskade as an operations layer that reduces planning cycles by 15–20% and improves on-site issue resolution through shared checklists and automations. Strategic moves include building templates for event workflows, adding role-based permissions, and improving integrations with calendar, file storage, and ticketing systems. Taskade’s differentiators are usability, flexible AI automation, and attractive pricing for distributed teams, which lets your organization standardize planning routines without heavy platform migration.
Market Key Players
RainFocus
Grip
Zoho Corporation
Hubilo
Cvent Inc.
Taskade
Eventbrite
OpenAI
Community Brands Intermediate, LLC
ClickUp
Other Key Players
Driver
Automation-Driven Cost Efficiency Across Event Operations
By 2025, improving efficiency has become a key reason for using AI in event management. Event organizers face growing pressure to manage complex, multi-format events while keeping costs down. AI platforms now automate up to 40% of repetitive planning tasks, such as scheduling, ticketing, vendor coordination, and resource allocation. These functions lessen manual workloads, speed up planning cycles, and reduce staffing costs by as much as 25%. This makes AI a vital productivity tool rather than just a nice addition.
Personalized Attendee Experiences as a Competitive Differentiator
In addition to efficiency, AI allows for large-scale personalization that was previously impossible. Recommendation engines and behavioral insights help organizers create tailored agendas, suggest targeted networking opportunities, and provide real-time content customization. Corporate, government, and entertainment events increasingly depend on these features to enhance engagement and satisfaction. As attendee expectations rise, AI-driven personalization is becoming a key differentiator, speeding up adoption in premium and high-profile event formats.
Restraint
High Implementation Costs and Integration Complexity
Despite strong demand, adoption is still limited by the high startup costs of AI deployment. Besides software licensing, implementation often requires connecting with existing ticketing, CRM, and venue management systems, along with staff training and process changes. In 2025, over 40% of mid-sized event management firms report cost barriers as the main reason for delayed AI adoption, especially in budget-sensitive regional markets.
Data Privacy, Compliance, and Risk Exposure
Regulatory issues also restrict market growth. AI-driven event platforms handle large amounts of sensitive attendee data, including personal identifiers, behavioral insights, and sometimes biometric information. Meeting rules like GDPR and CCPA raises deployment costs and operational risks. For many organizers, especially smaller companies, the legal and reputational risks of data breaches create hesitation and slow down adoption outside large enterprises.
Opportunity
Rapid Expansion of Hybrid and Virtual Event Ecosystems
Hybrid and virtual events represent the most promising area for AI solutions. These formats are expected to grow at a compound annual growth rate above 25% through 2033, fueled by global audiences and cost-effective digital delivery. AI-enabled tools, such as real-time translation, automated session moderation, and virtual matchmaking, are becoming essential for managing scale and complexity. As hybrid formats evolve, AI adoption is predicted to become standard rather than optional.
High-Growth Potential in Asia-Pacific and Emerging Markets
Regionally, Asia-Pacific is becoming a significant opportunity. Investments in AI infrastructure across China, India, Japan, and Southeast Asia are speeding up adoption among event organizers and venue operators. Government-supported digital transformation efforts and rapid growth in corporate events, exhibitions, and technology conferences are generating scalable demand. For investors, these markets present high-margin growth potential with long-term importance as AI use increases.
Trend
Real-Time Analytics and Adaptive Event Management
In 2025, real-time intelligence is changing event management. More than 70% of large-scale organizers now use AI-driven analytics dashboards to track attendance flows, engagement levels, and operational performance during live events. These systems allow for quick adjustments to agendas, staffing, crowd control, and logistics, leading to better outcomes while lowering operational risk.
Convergence of AI with Security, IoT, and Smart Venues
Another key trend is the merging of AI with security systems and IoT-enabled venues. Facial recognition, crowd behavior monitoring, and AI-driven threat detection are increasingly used at high-profile events. At the same time, AI is improving venue operations through automated lighting, climate control, and energy management. This merging is transforming events into data-driven, adaptive environments where AI serves as a fundamental operational layer rather than just an add-on tool.
Recent Developments
December 2024 – TrueLink Capital: The private equity firm finalized its acquisition of global events provider GES in a transaction valued at approximately $535 million. This move provides GES with significant capital to invest in its core strengths, pursue strategic acquisitions, and expand its agency presence globally.
January 2025 – WiSA Technologies: WiSA, a company focused on wireless sound technology, announced its acquisition of event registration and data analytics provider CompuSystems. The merger integrates advanced audio technology with event management services, aiming to create more immersive and technically sophisticated on-site experiences.
May 2025 – Grip: Following its acquisition of Connectiv Holdings' Event Management System (EMS), the AI-powered platform Grip launched its "Manage" product suite to create a full end-to-end event solution. Grip reports that using an integrated EMS can increase meetings booked by over 600% and connections made by 252%. This expansion transforms Grip from a matchmaking tool into a comprehensive platform that manages the entire event lifecycle.
June 2025 – Cvent: At its annual conference, Cvent unveiled CventIQ, its new artificial intelligence engine designed to automate and improve event planning and reporting. New features include natural language report generation, predictive registration analytics, and a real-time "data bridge" for seamless integrations. The launch of CventIQ strengthens the company's analytics capabilities to meet client demand for data-driven insights and greater user efficiency.
August 2025 – EventMobi: In partnership with Event Industry News, EventMobi released a comprehensive report on the state of AI in the events sector, detailing its role in personalizing attendee journeys and streamlining operations. This initiative reinforces EventMobi's position as a key contributor to the industry's adoption of AI, showcasing its commitment to guiding professionals through the technological shift.
October 2025 – Cvent: The company announced its AI Agenda Assistant, a new tool powered by CventIQ that automates session and schedule creation for event planners. Cvent also introduced a beta program for an AI Live Transcript feature, designed to boost engagement by providing real-time transcriptions for attendees at in-person events. These new products further build out the CventIQ ecosystem, focusing on practical AI tools that save time and enhance the attendee experience.