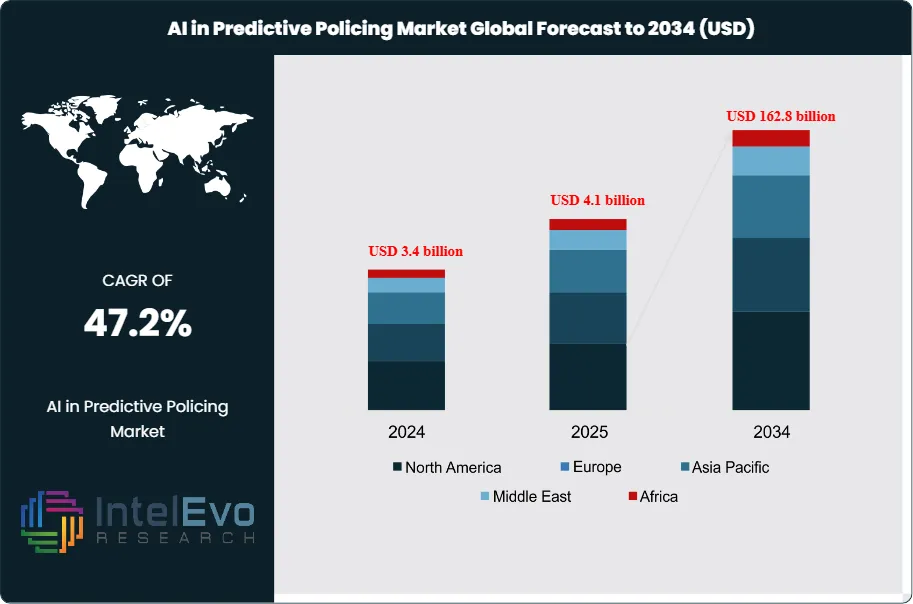
The AI in Predictive Policing Market is estimated to reach approximately USD 4.1 billion in 2025 and is projected to surge to around USD 162.8 billion by 2034, registering a very strong compound annual growth rate (CAGR) of about 47.2% during the forecast period from 2026 to 2034. This rapid expansion is driven by increasing adoption of AI-powered crime forecasting, real-time risk assessment, and data-driven patrol optimization across law enforcement agencies worldwide. Governments and public safety organizations are leveraging predictive analytics to reduce response times, allocate resources more efficiently, and improve crime prevention outcomes. Additionally, the integration of predictive policing platforms with smart city infrastructure, surveillance networks, and cloud-based analytics is accelerating deployment, positioning AI as a core pillar of next-generation public safety and security strategies.
AI in predictive policing uses machine learning and advanced analytics to forecast crime patterns and guide deployment decisions. Law enforcement agencies ingest structured and unstructured data, including incident reports, sensor feeds, and open-source intelligence, to detect spatial and temporal hotspots. This data-driven approach supports faster response, targeted patrols, and more efficient use of constrained public safety budgets, which strengthens the business case for investment.
Market expansion reflects a sharp rise in digital evidence volumes, maturing big data infrastructure, and accelerated adoption of cloud-based analytics platforms. Demand is strongest in dense urban environments where crime patterns are complex and traditional methods strain capacity. On the supply side, global technology providers, niche AI specialists, and system integrators compete on model accuracy, interpretability, integration with existing command-and-control systems, and lifecycle support. Vendors embed automation across workflows, from incident triage to real-time alerting, which lifts operational productivity for agencies facing staffing pressures.
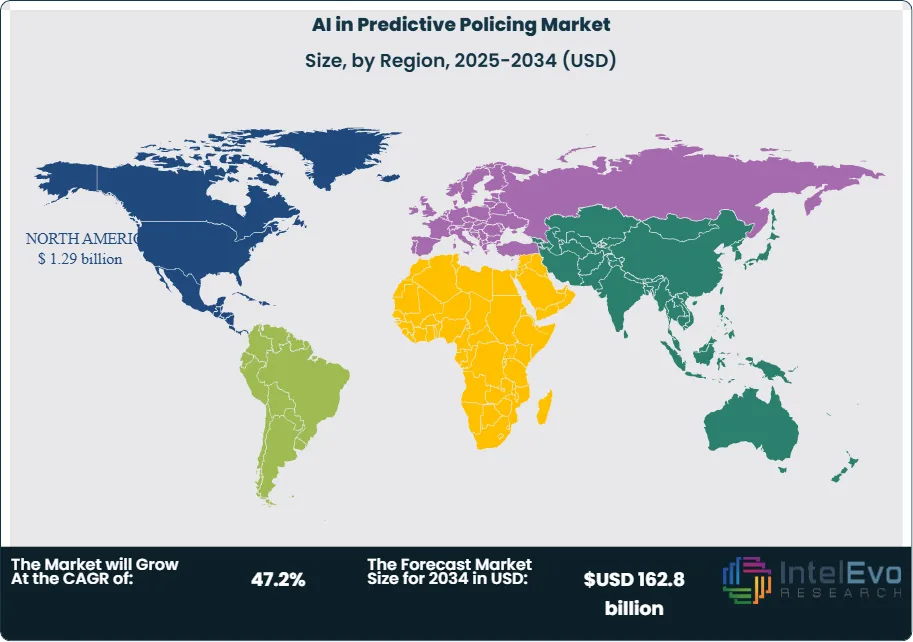
North America accounted for about 46.7% of global revenue in 2024, or roughly USD 1.6 billion, supported by early pilots, federal funding streams, and strong cloud and data-center ecosystems. Europe represents an important second pillar, with an estimated quarter of global spend as governments align public safety modernization programs with tightening algorithmic accountability and data protection rules. Asia Pacific is emerging as the fastest-growing region, driven by smart city initiatives in large metropolitan areas and investments in video analytics, IoT sensors, and edge computing. Investment activity is also rising in the Middle East and Latin America as governments scale national security and safe-city programs.
Regulation and risk management shape the trajectory of this market. Data protection frameworks, civil liberties oversight, and evolving guidelines on the use of biometrics and automated decision support impose strict governance requirements. Agencies and vendors must demonstrate that systems minimize bias, preserve due process, and keep humans in the loop for sensitive decisions. This imperative creates opportunity for transparent, auditable, and privacy-enhancing AI architectures that can deliver accurate predictions while sustaining public trust and meeting investor expectations for responsible growth.
Market Growth: The global market for AI in predictive policing grows from USD 4.1 billion in 2025 to USD 162.8 billion by 2034, reflecting a 47.2% CAGR, 2026-2034. This expansion signals rapid scaling of algorithmic tools across public safety and adjacent risk domains.
Segment Dominance: Solution offerings dominate with 78.5% share, 2024 and generate an estimated: 2.7 billion USD, 2024 in revenue as agencies prioritize integrated platforms over point tools. This dominance underscores preference for end-to-end analytics suites that unify ingestion, modeling, and operational deployment.
Segment Dominance: On-premises deployments account for 66.7% of spending, 2024, while large enterprises hold 70.7% share, 2024 as they scale AI-enabled risk management and investigative analytics. This structure indicates that data sovereignty, control, and established IT capacity still favor in-house environments.
Driver: Demand from Banking, Financial Services, and Insurance, which captures 34.6% share, 2024, and adoption of NLP technologies with 36.8% share, 2024 drive sustained investment in AI-based surveillance, fraud detection, and investigative workflows. These sectors require high-volume, real-time decisioning and thus anchor early large-scale deployments.
Restraint: High implementation and governance costs, including model validation and compliance, act as a brake on broader diffusion with investments in oversight and risk functions at estimated: 0.8 billion USD, 2024. Concerns about data privacy and ethical use further slow uptake among resource-constrained agencies.
Opportunity: Expanding adoption among mid-sized agencies, regulated industries, and cross-border intelligence-sharing programs offers incremental revenue potential of estimated: 25.0 billion USD, 2030. Vendors that package modular, lower-cost offerings around core analytics engines can unlock new addressable segments beyond current 3.4 billion USD, 2024 spend.
Trend: Vendors intensify focus on explainable NLP and multimodal models, with estimated: 55.0% of new deployments, 2030 incorporating advanced transparency and auditability features compared with a baseline of 36.8%, 2024 NLP share. This evolution aligns AI in policing with tightening governance expectations.
Regional Analysis: North America leads with 46.7% share, 2024 and 1.6 billion USD, 2024 in revenue, while the US alone contributes 1.29 billion USD, 2024 and is set to expand at 45.8% CAGR, 2024-2034. Other regions collectively contribute an estimated: 1.8 billion USD, 2024 as adoption broadens across Europe, Asia Pacific, and emerging markets.
By Type
High performance concrete continues to gain attention in 2025 as construction firms look for durable materials that support long service life and reduced maintenance. Demand rises in large infrastructure programs where strength and resistance to harsh environments influence procurement decisions. Countries investing in transportation, energy grids, and public facilities report a steady shift toward mixes engineered for higher compressive strength and better load distribution. Market estimates show high performance concrete accounting for a growing share of material specifications as budgets tighten and asset owners seek predictable lifecycle costs.
Self-consolidating concrete also expands its role across projects where improved flowability and uniform placement help reduce labor. Contractors in Asia Pacific and Europe report adoption rates rising above 20 percent in large urban builds, supported by productivity gains and fewer structural defects. Automated batching systems and quality-controlled admixtures improve consistency, which encourages wider use in high-density reinforcement applications.
Other concrete types remain relevant for specialized needs such as lightweight elements, architectural finishes, and rapid-setting works. These categories grow steadily as manufacturers broaden product portfolios to meet performance codes across residential, commercial, and industrial environments. Consistent investment in additives and material science indicates further diversification of this segment through 2030.
By Application
Pavers continue to drive significant demand as cities invest in streetscape upgrades and climate-resilient surfaces. Municipal budgets in North America and Europe allocate increasing shares to materials that support permeability targets and pedestrian-friendly designs. The market benefits from rising urban redevelopment projects, where engineered concrete pavers deliver durability and aesthetic uniformity.
Retaining walls maintain a strong position due to expanding hillside development and soil stabilization requirements. Adoption grows in transportation corridors where slope failures pose operational risks. Many governments prioritize resilient construction after recent flood events, and this shifts attention toward reinforced and modular wall systems that reduce long-term maintenance.
Other applications such as barriers, precast components, and utility structures also gain traction as contractors standardize on materials with predictable performance. The shift toward mechanized installation and digital design tools further pushes adoption across public and private projects.
By End-Use
Residential building activity remains a major contributor to concrete demand as urban expansion accelerates. Developers focus on multi-family units and mixed-use complexes that require consistent quality and shorter project timelines. Prefabricated concrete elements gain interest in 2025 as builders target cost control and reliable turnaround.
Commercial construction shows steady growth, supported by logistics hubs, office redevelopment, and data center expansion. These projects rely heavily on high-strength mixes and self-consolidating concrete for structural cores and large-span floors. Analysts expect sustained spending across retail, warehousing, and institutional assets through 2030.
Industrial facilities such as manufacturing plants and energy installations add another layer of demand. Many require specialized floors, containment areas, and high-load foundations. As global supply chains reposition, new industrial zones across Asia and parts of the Middle East continue to drive concrete consumption.
By Region
North America maintains a leading position in 2025 due to consistent infrastructure spending and strong regulatory compliance standards. The United States accelerates upgrades to highways, ports, and public buildings, reinforcing demand for advanced concrete mixes with higher strength and reliability. Canada follows similar investment patterns across transportation and utilities.
Europe posts stable growth as countries implement energy-efficiency targets and resilience mandates for buildings. Germany, France, and the Nordics invest heavily in retrofit programs and transit modernization, which increases procurement of specialized concrete materials.
Asia Pacific remains the fastest-expanding market, driven by urban population growth and large-scale industrialization. China, India, and Southeast Asian economies allocate significant budgets to transportation corridors, renewable energy facilities, and residential developments. This region is expected to capture the largest volume gains through 2030.
Latin America and the Middle East Africa display selective but rising demand. Infrastructure concessions, mining projects, and industrial expansion drive concrete requirements, while government programs focus on long-term structural resilience and improved construction standards.
By Offering (Solutions, Services, Managed Services), By Deployment Mode (Cloud, On-premises), By Organization Size (Large enterprises, Small and medium-sized enterprises (SMEs)), By Technology (Natural Language Processing (NLP), Computer Vision, Machine Learning, Deep Learning, Others (Reinforcement Learning, Neural Networks, etc.)), By Vertical (BFSI, Manufacturing, Retail and eCommerce, Government and Defense, Healthcare and Life Sciences, Energy and Utilities, Telecommunications and IT, Transportation and Logistics, Media and Entertainment, Travel and Hospitality, Other Verticals)
Research Methodology
Primary Research- 100 Interviews of Stakeholders
Secondary Research
Desk Research
Regional scope
North America (United States, Canada, Mexico)
Latin America (Brazil, Argentina, Columbia)
East Asia And Pacific (China, Japan, South Korea, Australia, Cambodia, Fiji, Indonesia)
Sea And South Asia (India, Singapore, Thailand, Taiwan, Malaysia)
Eastern Europe (Poland, Russia, Czech Republic, Romania)
Western Europe (Germany, U.K., France, Spain, Itlay)
Middle East & Africa (GCC Countries, Egypt, Nigeria, South Africa, Israel)
Competitive Landscape
Dataminr, ThirdEye Labs (acquired by Standard AI), SoundThinking Inc. (formerly ShotSpotter Inc.), Palantir Technologies Inc., Kaseware Inc., Microsoft Corporation, MIM.ai, International Business Machines Corporation (IBM), Others
Customization Scope
Customization for segments, region/country-level will be provided. Moreover, additional customization can be done based on the requirements.
Pricing and Purchase Options
Avail customized purchase options to meet your exact research needs. We have three licenses to opt for: Single User License, Multi-User License (Up to 5 Users), Corporate Use License (Unlimited User and Printable PDF).
TABLE OF CONTENTS
1. EXECUTIVE SUMMARY
1.1. MARKET SNAPSHOT
1.2. KEY FINDINGS & INSIGHTS
1.3. ANALYST RECOMMENDATIONS
1.4. FUTURE OUTLOOK
2. RESEARCH METHODOLOGY
2.1. MARKET DEFINITION & SCOPE
2.2. RESEARCH OBJECTIVES: PRIMARY & SECONDARY DATA SOURCES
2.3. DATA COLLECTION SOURCES
2.3.1. COVERAGE OF 100+ PRIMARY RESEARCH/CONSULTATION CALLS WITH INDUSTRY STAKEHOLDERS
FIGURE 17 NORTH AMERICA AI IN PREDICTIVE POLICING CURRENT AND FUTURE TYPE ANALYSIS, 2025–2034, (USD MILLION)
FIGURE 18 NORTH AMERICA AI IN PREDICTIVE POLICING CURRENT AND FUTURE END USER ANALYSIS, 2025–2034, (USD MILLION)
FIGURE 19 MARKET SHARE BY COUNTRY
FIGURE 20 LATIN AMERICA AI IN PREDICTIVE POLICING CURRENT AND FUTURE TYPE ANALYSIS, 2025–2034, (USD MILLION)
FIGURE 21 LATIN AMERICA AI IN PREDICTIVE POLICING CURRENT AND FUTURE END USER ANALYSIS, 2025–2034, (USD MILLION)
FIGURE 22 MARKET SHARE BY COUNTRY
FIGURE 23 EASTERN EUROPE AI IN PREDICTIVE POLICING CURRENT AND FUTURE TYPE ANALYSIS, 2025–2034, (USD MILLION)
FIGURE 24 EASTERN EUROPE AI IN PREDICTIVE POLICING CURRENT AND FUTURE END USER ANALYSIS, 2025–2034, (USD MILLION)
FIGURE 25 MARKET SHARE BY COUNTRY
FIGURE 26 WESTERN EUROPE AI IN PREDICTIVE POLICING CURRENT AND FUTURE TYPE ANALYSIS, 2025–2034, (USD MILLION)
FIGURE 27 WESTERN EUROPE AI IN PREDICTIVE POLICING CURRENT AND FUTURE END USER ANALYSIS, 2025–2034, (USD MILLION)
FIGURE 28 MARKET SHARE BY COUNTRY
FIGURE 29 EAST ASIA AND PACIFIC AI IN PREDICTIVE POLICING CURRENT AND FUTURE TYPE ANALYSIS, 2025–2034, (USD MILLION)
FIGURE 30 EAST ASIA AND PACIFIC AI IN PREDICTIVE POLICING CURRENT AND FUTURE END USER ANALYSIS, 2025–2034, (USD MILLION)
FIGURE 31 MARKET SHARE BY COUNTRY
FIGURE 32 SEA AND SOUTH ASIA AI IN PREDICTIVE POLICING CURRENT AND FUTURE TYPE ANALYSIS, 2025–2034, (USD MILLION)
FIGURE 33 SEA AND SOUTH ASIA AI IN PREDICTIVE POLICING CURRENT AND FUTURE END USER ANALYSIS, 2025–2034, (USD MILLION)
FIGURE 34 MARKET SHARE BY COUNTRY
FIGURE 35 MIDDLE EAST AND AFRICA AI IN PREDICTIVE POLICING CURRENT AND FUTURE TYPE ANALYSIS, 2025–2034, (USD MILLION)
FIGURE 36 MIDDLE EAST AND AFRICA AI IN PREDICTIVE POLICING CURRENT AND FUTURE END USER ANALYSIS, 2025–2034, (USD MILLION)
FIGURE 37 NORTH AMERICA AI IN PREDICTIVE POLICING CURRENT AND FUTURE MARKET VOLUME SHARE REGIONAL ANALYSIS, 2025–2034, (USD MILLION)
FIGURE 38 U.S. AI IN PREDICTIVE POLICING CURRENT AND FUTURE TYPE ANALYSIS, 2025–2034, (USD MILLION)
FIGURE 39 U.S. AI IN PREDICTIVE POLICING CURRENT AND FUTURE END USER ANALYSIS, 2025–2034, (USD MILLION)
FIGURE 40 CANADA AI IN PREDICTIVE POLICING CURRENT AND FUTURE TYPE ANALYSIS, 2025–2034, (USD MILLION)
FIGURE 41 CANADA AI IN PREDICTIVE POLICING CURRENT AND FUTURE END USER ANALYSIS, 2025–2034, (USD MILLION)
FIGURE 42 LATIN AMERICA AI IN PREDICTIVE POLICING CURRENT AND FUTURE MARKET VOLUME SHARE REGIONAL ANALYSIS, 2025–2034, (USD MILLION)
FIGURE 43 MEXICO AI IN PREDICTIVE POLICING CURRENT AND FUTURE TYPE ANALYSIS, 2025–2034, (USD MILLION)
FIGURE 44 MEXICO AI IN PREDICTIVE POLICING CURRENT AND FUTURE END USER ANALYSIS, 2025–2034, (USD MILLION)
FIGURE 45 BRAZIL AI IN PREDICTIVE POLICING CURRENT AND FUTURE TYPE ANALYSIS, 2025–2034, (USD MILLION)
FIGURE 46 BRAZIL AI IN PREDICTIVE POLICING CURRENT AND FUTURE END USER ANALYSIS, 2025–2034, (USD MILLION)
FIGURE 47 ARGENTINA AI IN PREDICTIVE POLICING CURRENT AND FUTURE TYPE ANALYSIS, 2025–2034, (USD MILLION)
FIGURE 48 ARGENTINA AI IN PREDICTIVE POLICING CURRENT AND FUTURE END USER ANALYSIS, 2025–2034, (USD MILLION)
FIGURE 49 COLUMBIA AI IN PREDICTIVE POLICING CURRENT AND FUTURE TYPE ANALYSIS, 2025–2034, (USD MILLION)
FIGURE 50 COLUMBIA AI IN PREDICTIVE POLICING CURRENT AND FUTURE END USER ANALYSIS, 2025–2034, (USD MILLION)
FIGURE 51 REST OF LATIN AMERICA AI IN PREDICTIVE POLICING CURRENT AND FUTURE TYPE ANALYSIS, 2025–2034, (USD MILLION)
FIGURE 52 REST OF LATIN AMERICA AI IN PREDICTIVE POLICING CURRENT AND FUTURE END USER ANALYSIS, 2025–2034, (USD MILLION)
FIGURE 53 EASTERN EUROPE AI IN PREDICTIVE POLICING CURRENT AND FUTURE MARKET VOLUME SHARE REGIONAL ANALYSIS, 2025–2034, (USD MILLION)
FIGURE 54 POLAND AI IN PREDICTIVE POLICING CURRENT AND FUTURE TYPE ANALYSIS, 2025–2034, (USD MILLION)
FIGURE 55 POLAND AI IN PREDICTIVE POLICING CURRENT AND FUTURE END USER ANALYSIS, 2025–2034, (USD MILLION)
FIGURE 56 RUSSIA AI IN PREDICTIVE POLICING CURRENT AND FUTURE TYPE ANALYSIS, 2025–2034, (USD MILLION)
FIGURE 57 RUSSIA AI IN PREDICTIVE POLICING CURRENT AND FUTURE END USER ANALYSIS, 2025–2034, (USD MILLION)
FIGURE 58 CZECH REPUBLIC AI IN PREDICTIVE POLICING CURRENT AND FUTURE TYPE ANALYSIS, 2025–2034, (USD MILLION)
FIGURE 59 CZECH REPUBLIC AI IN PREDICTIVE POLICING CURRENT AND FUTURE END USER ANALYSIS, 2025–2034, (USD MILLION)
FIGURE 60 ROMANIA AI IN PREDICTIVE POLICING CURRENT AND FUTURE TYPE ANALYSIS, 2025–2034, (USD MILLION)
FIGURE 61 ROMANIA AI IN PREDICTIVE POLICING CURRENT AND FUTURE END USER ANALYSIS, 2025–2034, (USD MILLION)
FIGURE 62 REST OF EASTERN EUROPE AI IN PREDICTIVE POLICING CURRENT AND FUTURE TYPE ANALYSIS, 2025–2034, (USD MILLION)
FIGURE 63 REST OF EASTERN EUROPE AI IN PREDICTIVE POLICING CURRENT AND FUTURE END USER ANALYSIS, 2025–2034, (USD MILLION)
FIGURE 64 WESTERN EUROPE AI IN PREDICTIVE POLICING CURRENT AND FUTURE MARKET VOLUME SHARE REGIONAL ANALYSIS, 2025–2034, (USD MILLION)
FIGURE 65 GERMANY AI IN PREDICTIVE POLICING CURRENT AND FUTURE TYPE ANALYSIS, 2025–2034, (USD MILLION)
FIGURE 66 GERMANY AI IN PREDICTIVE POLICING CURRENT AND FUTURE END USER ANALYSIS, 2025–2034, (USD MILLION)
FIGURE 67 FRANCE AI IN PREDICTIVE POLICING CURRENT AND FUTURE TYPE ANALYSIS, 2025–2034, (USD MILLION)
FIGURE 68 FRANCE AI IN PREDICTIVE POLICING CURRENT AND FUTURE END USER ANALYSIS, 2025–2034, (USD MILLION)
FIGURE 69 UK AI IN PREDICTIVE POLICING CURRENT AND FUTURE TYPE ANALYSIS, 2025–2034, (USD MILLION)
FIGURE 70 UK AI IN PREDICTIVE POLICING CURRENT AND FUTURE END USER ANALYSIS, 2025–2034, (USD MILLION)
FIGURE 71 SPAIN AI IN PREDICTIVE POLICING CURRENT AND FUTURE TYPE ANALYSIS, 2025–2034, (USD MILLION)
FIGURE 72 SPAIN AI IN PREDICTIVE POLICING CURRENT AND FUTURE END USER ANALYSIS, 2025–2034, (USD MILLION)
FIGURE 73 ITALY AI IN PREDICTIVE POLICING CURRENT AND FUTURE TYPE ANALYSIS, 2025–2034, (USD MILLION)
FIGURE 74 ITALY AI IN PREDICTIVE POLICING CURRENT AND FUTURE END USER ANALYSIS, 2025–2034, (USD MILLION)
FIGURE 75 REST OF WESTERN EUROPE AI IN PREDICTIVE POLICING CURRENT AND FUTURE TYPE ANALYSIS, 2025–2034, (USD MILLION)
FIGURE 76 REST OF WESTERN EUROPE AI IN PREDICTIVE POLICING CURRENT AND FUTURE END USER ANALYSIS, 2025–2034, (USD MILLION)
FIGURE 77 EAST ASIA AND PACIFIC AI IN PREDICTIVE POLICING CURRENT AND FUTURE MARKET VOLUME SHARE REGIONAL ANALYSIS, 2025–2034, (USD MILLION)
FIGURE 78 CHINA AI IN PREDICTIVE POLICING CURRENT AND FUTURE TYPE ANALYSIS, 2025–2034, (USD MILLION)
FIGURE 79 CHINA AI IN PREDICTIVE POLICING CURRENT AND FUTURE END USER ANALYSIS, 2025–2034, (USD MILLION)
FIGURE 80 JAPAN AI IN PREDICTIVE POLICING CURRENT AND FUTURE TYPE ANALYSIS, 2025–2034, (USD MILLION)
FIGURE 81 JAPAN AI IN PREDICTIVE POLICING CURRENT AND FUTURE END USER ANALYSIS, 2025–2034, (USD MILLION)
FIGURE 82 AUSTRALIA AI IN PREDICTIVE POLICING CURRENT AND FUTURE TYPE ANALYSIS, 2025–2034, (USD MILLION)
FIGURE 83 AUSTRALIA AI IN PREDICTIVE POLICING CURRENT AND FUTURE END USER ANALYSIS, 2025–2034, (USD MILLION)
FIGURE 84 CAMBODIA AI IN PREDICTIVE POLICING CURRENT AND FUTURE TYPE ANALYSIS, 2025–2034, (USD MILLION)
FIGURE 85 CAMBODIA AI IN PREDICTIVE POLICING CURRENT AND FUTURE END USER ANALYSIS, 2025–2034, (USD MILLION)
FIGURE 86 FIJI AI IN PREDICTIVE POLICING CURRENT AND FUTURE TYPE ANALYSIS, 2025–2034, (USD MILLION)
FIGURE 87 FIJI AI IN PREDICTIVE POLICING CURRENT AND FUTURE END USER ANALYSIS, 2025–2034, (USD MILLION)
FIGURE 88 INDONESIA AI IN PREDICTIVE POLICING CURRENT AND FUTURE TYPE ANALYSIS, 2025–2034, (USD MILLION)
FIGURE 89 INDONESIA AI IN PREDICTIVE POLICING CURRENT AND FUTURE END USER ANALYSIS, 2025–2034, (USD MILLION)
FIGURE 90 SOUTH KOREA AI IN PREDICTIVE POLICING CURRENT AND FUTURE TYPE ANALYSIS, 2025–2034, (USD MILLION)
FIGURE 91 SOUTH KOREA AI IN PREDICTIVE POLICING CURRENT AND FUTURE END USER ANALYSIS, 2025–2034, (USD MILLION)
FIGURE 92 REST OF EAST ASIA AND PACIFIC AI IN PREDICTIVE POLICING CURRENT AND FUTURE TYPE ANALYSIS, 2025–2034, (USD MILLION)
FIGURE 93 REST OF EAST ASIA AND PACIFIC AI IN PREDICTIVE POLICING CURRENT AND FUTURE END USER ANALYSIS, 2025–2034, (USD MILLION)
FIGURE 94 SEA AND SOUTH ASIA AI IN PREDICTIVE POLICING CURRENT AND FUTURE MARKET VOLUME SHARE REGIONAL ANALYSIS, 2025–2034, (USD MILLION)
FIGURE 95 BANGLADESH AI IN PREDICTIVE POLICING CURRENT AND FUTURE TYPE ANALYSIS, 2025–2034, (USD MILLION)
FIGURE 96 BANGLADESH AI IN PREDICTIVE POLICING CURRENT AND FUTURE END USER ANALYSIS, 2025–2034, (USD MILLION)
FIGURE 97 NEW ZEALAND AI IN PREDICTIVE POLICING CURRENT AND FUTURE TYPE ANALYSIS, 2025–2034, (USD MILLION)
FIGURE 98 NEW ZEALAND AI IN PREDICTIVE POLICING CURRENT AND FUTURE END USER ANALYSIS, 2025–2034, (USD MILLION)
FIGURE 99 INDIA AI IN PREDICTIVE POLICING CURRENT AND FUTURE TYPE ANALYSIS, 2025–2034, (USD MILLION)
FIGURE 100 INDIA AI IN PREDICTIVE POLICING CURRENT AND FUTURE END USER ANALYSIS, 2025–2034, (USD MILLION)
FIGURE 101 SINGAPORE AI IN PREDICTIVE POLICING CURRENT AND FUTURE TYPE ANALYSIS, 2025–2034, (USD MILLION)
FIGURE 102 SINGAPORE AI IN PREDICTIVE POLICING CURRENT AND FUTURE END USER ANALYSIS, 2025–2034, (USD MILLION)
FIGURE 103 THAILAND AI IN PREDICTIVE POLICING CURRENT AND FUTURE TYPE ANALYSIS, 2025–2034, (USD MILLION)
FIGURE 104 THAILAND AI IN PREDICTIVE POLICING CURRENT AND FUTURE END USER ANALYSIS, 2025–2034, (USD MILLION)
FIGURE 105 TAIWAN AI IN PREDICTIVE POLICING CURRENT AND FUTURE TYPE ANALYSIS, 2025–2034, (USD MILLION)
FIGURE 106 TAIWAN AI IN PREDICTIVE POLICING CURRENT AND FUTURE END USER ANALYSIS, 2025–2034, (USD MILLION)
FIGURE 107 MALAYSIA AI IN PREDICTIVE POLICING CURRENT AND FUTURE TYPE ANALYSIS, 2025–2034, (USD MILLION)
FIGURE 108 MALAYSIA AI IN PREDICTIVE POLICING CURRENT AND FUTURE END USER ANALYSIS, 2025–2034, (USD MILLION)
FIGURE 109 REST OF SEA AND SOUTH ASIA AI IN PREDICTIVE POLICING CURRENT AND FUTURE TYPE ANALYSIS, 2025–2034, (USD MILLION)
FIGURE 110 REST OF SEA AND SOUTH ASIA AI IN PREDICTIVE POLICING CURRENT AND FUTURE END USER ANALYSIS, 2025–2034, (USD MILLION)
FIGURE 111 MIDDLE EAST AND AFRICA AI IN PREDICTIVE POLICING CURRENT AND FUTURE MARKET VOLUME SHARE REGIONAL ANALYSIS, 2025–2034, (USD MILLION)
FIGURE 112 GCC COUNTRIES AI IN PREDICTIVE POLICING CURRENT AND FUTURE TYPE ANALYSIS, 2025–2034, (USD MILLION)
FIGURE 113 GCC COUNTRIES AI IN PREDICTIVE POLICING CURRENT AND FUTURE END USER ANALYSIS, 2025–2034, (USD MILLION)
FIGURE 114 SAUDI ARABIA AI IN PREDICTIVE POLICING CURRENT AND FUTURE TYPE ANALYSIS, 2025–2034, (USD MILLION)
FIGURE 115 SAUDI ARABIA AI IN PREDICTIVE POLICING CURRENT AND FUTURE END USER ANALYSIS, 2025–2034, (USD MILLION)
FIGURE 116 UAE AI IN PREDICTIVE POLICING CURRENT AND FUTURE TYPE ANALYSIS, 2025–2034, (USD MILLION)
FIGURE 117 UAE AI IN PREDICTIVE POLICING CURRENT AND FUTURE END USER ANALYSIS, 2025–2034, (USD MILLION)
FIGURE 118 BAHRAIN AI IN PREDICTIVE POLICING CURRENT AND FUTURE TYPE ANALYSIS, 2025–2034, (USD MILLION)
FIGURE 119 BAHRAIN AI IN PREDICTIVE POLICING CURRENT AND FUTURE END USER ANALYSIS, 2025–2034, (USD MILLION)
FIGURE 120 KUWAIT AI IN PREDICTIVE POLICING CURRENT AND FUTURE TYPE ANALYSIS, 2025–2034, (USD MILLION)
FIGURE 121 KUWAIT AI IN PREDICTIVE POLICING CURRENT AND FUTURE END USER ANALYSIS, 2025–2034, (USD MILLION)
FIGURE 122 OMAN AI IN PREDICTIVE POLICING CURRENT AND FUTURE TYPE ANALYSIS, 2025–2034, (USD MILLION)
FIGURE 123 OMAN AI IN PREDICTIVE POLICING CURRENT AND FUTURE END USER ANALYSIS, 2025–2034, (USD MILLION)
FIGURE 124 QATAR AI IN PREDICTIVE POLICING CURRENT AND FUTURE TYPE ANALYSIS, 2025–2034, (USD MILLION)
FIGURE 125 QATAR AI IN PREDICTIVE POLICING CURRENT AND FUTURE END USER ANALYSIS, 2025–2034, (USD MILLION)
FIGURE 126 EGYPT AI IN PREDICTIVE POLICING CURRENT AND FUTURE TYPE ANALYSIS, 2025–2034, (USD MILLION)
FIGURE 127 EGYPT AI IN PREDICTIVE POLICING CURRENT AND FUTURE END USER ANALYSIS, 2025–2034, (USD MILLION)
FIGURE 128 NIGERIA AI IN PREDICTIVE POLICING CURRENT AND FUTURE TYPE ANALYSIS, 2025–2034, (USD MILLION)
FIGURE 129 NIGERIA AI IN PREDICTIVE POLICING CURRENT AND FUTURE END USER ANALYSIS, 2025–2034, (USD MILLION)
FIGURE 130 SOUTH AFRICA AI IN PREDICTIVE POLICING CURRENT AND FUTURE TYPE ANALYSIS, 2025–2034, (USD MILLION)
FIGURE 131 SOUTH AFRICA AI IN PREDICTIVE POLICING CURRENT AND FUTURE END USER ANALYSIS, 2025–2034, (USD MILLION)
FIGURE 132 ISRAEL AI IN PREDICTIVE POLICING CURRENT AND FUTURE TYPE ANALYSIS, 2025–2034, (USD MILLION)
FIGURE 133 ISRAEL AI IN PREDICTIVE POLICING CURRENT AND FUTURE END USER ANALYSIS, 2025–2034, (USD MILLION)
FIGURE 134 REST OF MEA AI IN PREDICTIVE POLICING CURRENT AND FUTURE TYPE ANALYSIS, 2025–2034, (USD MILLION)
FIGURE 135 REST OF MEA AI IN PREDICTIVE POLICING CURRENT AND FUTURE END USER ANALYSIS, 2025–2034, (USD MILLION)
FIGURE 136 U. S. MARKET SHARE ANALYSIS BY TYPE (2024)
FIGURE 137 U. S. MARKET SHARE ANALYSIS BY END USER (2024)
FIGURE 138 CANADA MARKET SHARE ANALYSIS BY TYPE (2024)
FIGURE 139 CANADA MARKET SHARE ANALYSIS BY END USER (2024)
FIGURE 140 MEXICO MARKET SHARE ANALYSIS BY TYPE (2024)
FIGURE 141 MEXICO MARKET SHARE ANALYSIS BY END USER (2024)
FIGURE 142 CHINA MARKET SHARE ANALYSIS BY TYPE (2024)
FIGURE 143 CHINA MARKET SHARE ANALYSIS BY END USER (2024)
FIGURE 144 JAPAN MARKET SHARE ANALYSIS BY TYPE (2024)
FIGURE 145 JAPAN MARKET SHARE ANALYSIS BY END USER (2024)
FIGURE 146 INDIA MARKET SHARE ANALYSIS BY TYPE (2024)
FIGURE 147 INDIA MARKET SHARE ANALYSIS BY END USER (2024)
FIGURE 148 SOUTH KOREA MARKET SHARE ANALYSIS BY TYPE (2024)
FIGURE 149 SOUTH KOREA MARKET SHARE ANALYSIS BY END USER (2024)
FIGURE 150 SAUDI ARABIA MARKET SHARE ANALYSIS BY TYPE (2024)
FIGURE 151 SAUDI ARABIA MARKET SHARE ANALYSIS BY END USER (2024)
FIGURE 152 UAE MARKET SHARE ANALYSIS BY TYPE (2024)
FIGURE 153 UAE MARKET SHARE ANALYSIS BY END USER (2024)
FIGURE 154 EGYPT MARKET SHARE ANALYSIS BY TYPE (2024)
FIGURE 155 EGYPT MARKET SHARE ANALYSIS BY END USER (2024)
FIGURE 156 NIGERIA MARKET SHARE ANALYSIS BY TYPE (2024)
FIGURE 157 NIGERIA MARKET SHARE ANALYSIS BY END USER (2024)
FIGURE 158 SOUTH AFRICA MARKET SHARE ANALYSIS BY TYPE (2024)
FIGURE 159 SOUTH AFRICA MARKET SHARE ANALYSIS BY END USER (2024)
FIGURE 160 GERMANY MARKET SHARE ANALYSIS BY TYPE (2024)
FIGURE 161 GERMANY MARKET SHARE ANALYSIS BY END USER (2024)
FIGURE 162 FRANCE MARKET SHARE ANALYSIS BY TYPE (2024)
FIGURE 163 FRANCE MARKET SHARE ANALYSIS BY END USER (2024)
FIGURE 164 UK MARKET SHARE ANALYSIS BY TYPE (2024)
FIGURE 165 UK MARKET SHARE ANALYSIS BY END USER (2024)
FIGURE 166 SPAIN MARKET SHARE ANALYSIS BY TYPE (2024)
FIGURE 167 SPAIN MARKET SHARE ANALYSIS BY END USER (2024)
FIGURE 168 ITALY MARKET SHARE ANALYSIS BY TYPE (2024)
FIGURE 169 ITALY MARKET SHARE ANALYSIS BY END USER (2024)
FIGURE 170 BRAZIL MARKET SHARE ANALYSIS BY TYPE (2024)
FIGURE 171 BRAZIL MARKET SHARE ANALYSIS BY END USER (2024)
FIGURE 172 ARGENTINA MARKET SHARE ANALYSIS BY TYPE (2024)
FIGURE 173 ARGENTINA MARKET SHARE ANALYSIS BY END USER (2024)
FIGURE 174 COLUMBIA MARKET SHARE ANALYSIS BY TYPE (2024)
FIGURE 175 COLUMBIA MARKET SHARE ANALYSIS BY END USER (2024)
FIGURE 176 GLOBAL AI IN PREDICTIVE POLICING CURRENT AND FUTURE MARKET KEY COUNTRY LEVEL ANALYSIS, 2024–2034, (USD MILLION)
FIGURE 177 FINANCIAL OVERVIEW:
Key Player Analysis
Microsoft Corporation: Microsoft positions itself as a market leader in AI-enabled public safety and predictive analytics. The company extends its Azure AI suite into law enforcement applications through geospatial processing, real-time data ingestion, and model orchestration tools designed for intelligence units. Azure’s strong presence in North America and Europe supports rapid adoption among agencies that require secure cloud architectures aligned with regional compliance standards. Microsoft invests heavily in responsible AI frameworks, which strengthens its appeal in a sector sensitive to privacy and auditability. The firm expands its partner ecosystem in 2025 through agreements with public safety software providers and system integrators that use Azure Machine Learning to deploy hotspot forecasting and incident pattern models. With Azure holding more than 20 percent of global cloud market share, Microsoft remains in a strong position to influence analytics modernization programs over the next five years.
International Business Machines Corporation (IBM): IBM operates as a long-standing challenger with deep specialization in analytics, data governance, and high-compliance AI environments. The company’s Watson AI platform supports law enforcement agencies with tools for text mining, case triage, and behavioral risk scoring. IBM differentiates itself through its strong data ethics portfolio, offering audit toolkits and bias mitigation frameworks that appeal to government clients. The company expands R&D spending in 2025 to enhance multimodal analytics capable of linking structured and unstructured data streams, including digital communications and field reports. IBM’s footprint in federal and state-level contracts across the United States and Europe creates a stable revenue base, and its managed services teams provide end-to-end support for agencies transitioning from legacy systems to advanced predictive platforms. This positions IBM as a strategic partner for jurisdictions focused on accountable AI deployment.
Dataminr: Dataminr operates as an innovator with strong real-time analytics capabilities. The company uses AI models to scan millions of public data points per day from digital platforms, sensor networks, and open-source intelligence. These alerts support early threat detection for public safety organizations and emergency response teams. Dataminr’s AI platform gains adoption in 2025 as agencies seek faster situational awareness and earlier visibility into emerging incidents. The company reports strong growth in government contracts as agencies integrate Dataminr alerts into command centers and field operations. Its differentiator lies in real-time signal detection and rapid classification accuracy, supported by large-scale event datasets and continuous model updates. With expanding operations in Europe and Asia Pacific, Dataminr strengthens its position as a key supplier of real-time intelligence in the broader predictive policing ecosystem.
Market Key Players
Dataminr
ThirdEye Labs (acquired by Standard AI)
SoundThinking Inc. (formerly ShotSpotter Inc.)
Palantir Technologies Inc.
Kaseware Inc.
Microsoft Corporation
MIM.ai
International Business Machines Corporation (IBM)
Others
Driver
Expanding Data Integration Accelerates Predictive AI Adoption
AI adoption speeds up in 2025 as law enforcement agencies combine larger and more varied data streams into their systems. Machine learning models increasingly analyze crime reports, mobility patterns, weather data, and public online activity, allowing for better identification of new risk areas. Early-adopting cities experience faster deployment and improved prediction accuracy as analytics shift from trial projects to essential operational tools.
Institutionalization of Analytics Drives Sustained Market Growth
As agencies create official analytics teams, spending on predictive AI platforms grows at double-digit rates. Vendors gain from longer contracts as these tools become crucial for public safety planning and patrol improvements. This factor supports a market projected to grow by more than 40 percent CAGR through 2034, making data integration and real-time information top investment priorities for public safety leaders.
Restraint
Algorithmic Bias Raises Adoption and Governance Concerns
Bias remains a major issue as predictive systems depend heavily on historical data shaped by uneven reporting and outdated enforcement practices. Without strong audit controls and frameworks to reduce bias, these inputs can lead to misleading alerts that disproportionately impact certain neighborhoods or demographic groups, raising concerns among oversight bodies and community stakeholders.
Privacy Regulation Increases Compliance Costs and Delays
Privacy scrutiny tightens in 2025 as regulators set stricter controls on systems that monitor online activity or collect citizen data. Agencies face rising costs for compliance, independent model checks, and legal reviews, causing delays in deployment. These challenges lengthen procurement cycles and raise the total cost of ownership for AI-based predictive policing platforms.
Opportunity
Transparent AI Models Strengthen Community Trust
Demand grows for AI platforms that provide predictive accuracy along with transparency and accountability. Agencies that use clear governance frameworks and explainable models report noticeable gains in response speed and incident prevention, helping them gain acceptance from communities and policymakers.
Fairness-Focused Solutions Unlock New Procurement Programs
With global spending on AI public safety tools expected to surpass USD 20 billion by 2030, vendors that offer traceable outputs and low-bias designs gain a competitive advantage. New procurement efforts increasingly emphasize fairness, accountability, and predictive accuracy, creating chances for suppliers committed to ethical AI standards in North America and Europe.
In 2025, agencies begin using advanced analytics such as social network mapping, sentiment analysis, and behavioral modeling to spot online threats before they turn into real incidents. These tools enhance situational awareness beyond typical incident reports and allow for earlier interventions.
Multimodal AI Platforms Redefine Predictive Policing Systems
Vendors are launching multimodal AI platforms that combine text, video, and geospatial data into cohesive risk-detection systems. Real-time monitoring of communication patterns and coordinated activities aids in identifying organized crime and group violence. This trend indicates a move toward integrated, real-time intelligence platforms across major areas.
Recent Developments
Dec 2024 – Nokia & Motorola Solutions: Nokia and Motorola Solutions announced an integrated 4G/5G drone-in-a-box solution for public safety and mission-critical users, combining AI-enhanced video analytics, remote flight control, and automated launch to support first responders in high-risk operations. The platform targets faster incident assessment and wider aerial coverage for police and emergency units worldwide. This move strengthens Motorola Solutions’ position in AI-enabled situational awareness and expands Nokia’s role in mission-critical networks for law enforcement and public safety clients.
Feb 2025 – Dataminr & Esri: Dataminr and Esri expanded their partnership to integrate Dataminr’s multimodal AI event detection, which processes over one million public data sources across 150+ languages and 220+ countries, directly into Esri’s ArcGIS-based mapping environment for public safety users. The combined solution gives law enforcement and emergency agencies real-time alerts overlaid on operational geospatial views for planning and response. This development deepens Dataminr’s footprint in predictive risk detection while reinforcing Esri’s position as a core geospatial layer for intelligence-led policing.
Apr 2025 – Axon: Axon introduced new fixed automated license plate recognition (ALPR) camera solutions and expanded its AI feature set with Unlimited Smart Detection, Policy Chat, and Axon Assistant, a voice-enabled AI companion embedded in Axon Body 4 cameras. The upgrades aim to reduce manual review time, improve search across large video archives, and give officers quicker access to policy guidance in the field. This launch broadens Axon’s role from hardware supplier to full AI workflow provider across patrol, evidence, and policy compliance in predictive and proactive policing.
Apr 2025 – Motorola Solutions: Motorola Solutions introduced Assist, an interactive AI platform designed for public safety workflows, integrating insights from voice, video, and structured data from initial call through case closure. Early agency deployments report meaningful reductions in administrative burden as Assist automates summarization and retrieval of case information. This release positions Motorola Solutions as a key AI orchestration layer across command centers and frontline users, directly supporting data-driven predictive policing programs.
Jul 2025 – Motorola Solutions: Motorola Solutions announced that it will apply explicit AI labels across its safety and security portfolio to indicate where and how AI features operate in video analytics, command center software, and related products. The initiative targets transparency requirements emerging from regulators and procurement bodies in North America and Europe. This step supports Motorola’s access to regulated tenders and sets a reference point for governance practices in AI-enabled public safety technologies.
Sep 2025 – Microsoft: Microsoft published its “Transforming Emergency Response” public sector report and highlighted deployments where Azure AI and Power Platform support predictive analytics for crime hotspots, traffic incidents, and emergency events, including a San Francisco Police Department solution that cut stolen-vehicle reporting time from two hours to around two minutes and saved roughly 500 officer hours per month. The report anchors Microsoft’s narrative around integrated AI data platforms for law enforcement and emergency services. This reinforces Microsoft’s role as a strategic cloud and AI partner for agencies that plan to scale predictive policing and real-time intelligence solutions over the next decade.