AI in Predictive Toxicology Market Size, Growth | CAGR 32.6%
Global AI in Predictive Toxicology Market Size, Share & Growth Analysis By Technology (Machine Learning, Deep Learning, NLP), By Application (Drug Safety, Chemical Risk Assessment, Environmental Toxicology, Cosmetics Testing), By End User (Pharma & Biotech, CROs, Regulatory Agencies, Chemical Manufacturers), Regional Outlook, Competitive Landscape, Key Players, Emerging Trends & Forecast 2025–2034
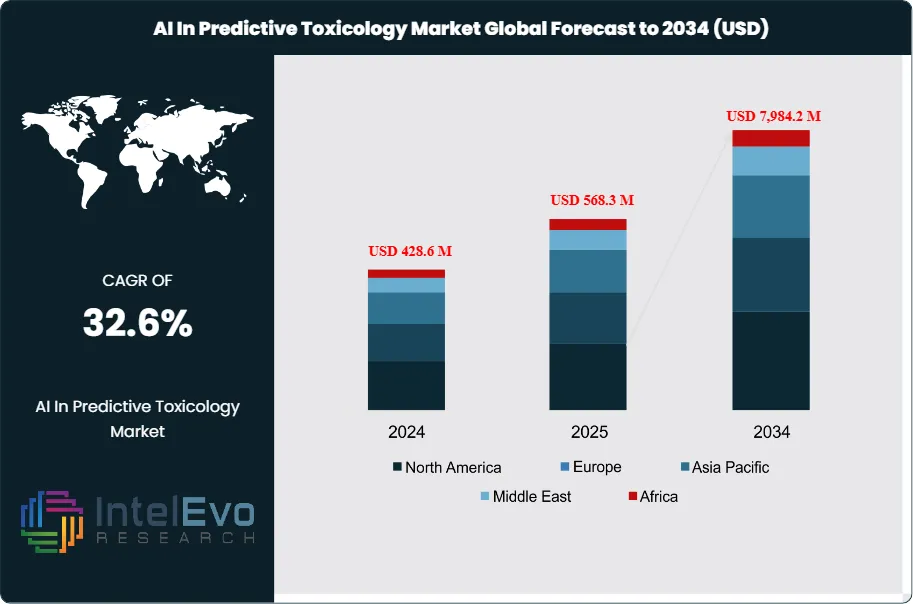
The AI in Predictive Toxicology Market is estimated at USD 428.6 million in 2024 and is projected to reach USD 7,984.2 million by 2034, reflecting a powerful CAGR of approximately 32.6% from 2025–2034. This trajectory highlights the rapid institutionalization of AI-driven safety assessment tools across drug discovery, chemical innovation, and consumer product testing. By 2025, the market has transitioned from small-scale pilot experiments to fully scaled programs across pharmaceuticals, chemicals, and cosmetics. Sponsors increasingly deploy AI platforms to triage expansive compound libraries, prioritize candidates ahead of wet-lab testing, and meet rising safety expectations. Adoption surged as regulators intensified pressure to reduce animal testing and accelerate early-stage toxicology workflows. AI-enabled models are now embedded earlier in discovery pipelines, helping identify risks related to genotoxicity, cardiotoxicity, hepatotoxicity, and endocrine disruption—ultimately reducing late-stage attrition and shortening timelines for IND-enabling studies.
Vendors report a significant uptick in software subscription bookings and validation-services revenue, driven by enterprise-level standardization of model governance and auditability. Efficiency remains the primary catalyst for adoption: in silico toxicology assessments reduce dependence on animal studies, cut per-compound evaluation costs, and decrease wet-lab assay volume. Many organizations cite double-digit reductions in cycle times and testing expenses, underscoring the ROI of AI-enhanced screening frameworks.
On the supply side, maturing AI toolchains have strengthened model fidelity, throughput, and workflow compatibility. Modern architectures—such as graph neural networks, transformers, and multi-task learning—now integrate chemistry, omics, and imaging data within unified pipelines. These advancements, combined with uncertainty quantification and conformal prediction techniques, improve trust in predictions, particularly in edge-case scenarios. Seamless integration with LIMS, ELN, and enterprise data lakes enables continuous model retraining and real-world performance monitoring, further reinforcing adoption.
Despite strong momentum, significant challenges remain. Data heterogeneity, sparse labels, and inconsistent metadata still constrain model generalization, requiring ongoing investment in data cleaning, ontology mapping, and bias oversight. Validation requirements differ across regulatory jurisdictions, adding operational complexity for global R&D workflows. Intellectual property considerations and transparency expectations influence vendor selection, with enterprises prioritizing explainable AI, provenance tracking, and defensible model documentation.
Regionally, North America maintains its leadership position in 2025 spending due to a dense biotech ecosystem and strong CRO capacity. Europe follows closely, supported by proactive regulatory bodies and public–private innovation initiatives, while Asia Pacific demonstrates the fastest expansion as domestic pharma pipelines grow and governments support AI-enabled safety testing. Investment hotspots include model-as-a-service platforms, multimodal data partnerships, and solutions linking toxicology predictions with ADME and exposure modeling. Over the next decade, market winners will be those who combine validated algorithms, high-quality datasets, and seamless workflow integration to transform predictive accuracy into fewer animal studies, lower per-asset development costs, and faster go/no-go decisions.
Key Takeaways
Market Growth: The Global AI in Predictive Toxicology market was USD 428.6 million in 2024 and is projected to reach USD 7,984.2 million by 2034, a 32.6% CAGR. Growth is driven by animal-reduction mandates, earlier safety triage in discovery, and faster IND decision cycles.
Technology:Machine learning led in 2023 with 41% share, or about USD 147.6 million of revenue. Adoption reflects broad availability of QSAR, graph networks, and transformer-based classifiers that scale across endpoints.
Component:Solutions accounted for 61% of 2023 spend, or roughly USD 219.7 million. Buyers prefer licensed platforms with audit trails, model governance, and LIMS/ELN integrations over standalone services.
Driver: Regulatory pressure to reduce animal testing and compress timelines is shifting budgets to in silico screening. Sponsors report double-digit cuts in wet-lab assays and earlier attrition of unsafe candidates, which lowers per-compound evaluation cost.
Restraint: Data heterogeneity and sparse labels limit external validity. Enterprises incur material costs for curation, ontology mapping, and validation, which can delay deployment by multiple quarters and cap near-term ROI.
Opportunity: Asia Pacific is set to outgrow the global average on the back of expanding domestic pipelines and government-backed AI programs. A sustained high-20s to low-30s CAGR in the region would add several hundred million dollars to 2033 demand.
Trend: Multimodal pipelines that combine chemistry, omics, and high-content imaging are moving into production. Vendors now bundle uncertainty quantification and conformal prediction, improving decision confidence and model acceptance in QA workflows.
Regional Analysis: North America led with ~44% share in 2023, or about USD 158.4 million, supported by a dense biotech base and CRO capacity. Europe follows with strong regulatory engagement, while Asia Pacific shows the fastest adoption as local pharma scales discovery and preclinical testing.
Type Analysis
Machine learning remains the core technology in 2025, accounting for 41% of 2023 spend and expanding with wider use of graph neural networks, transformers, and multi-task QSAR. These models fuse chemical structures, bioassay outputs, and omics signals to predict class-specific liabilities with higher recall, which improves early triage and reduces late-stage failures. Natural language processing scales evidence synthesis by extracting signals from millions of abstracts, reports, and adverse event records; you gain faster literature surveillance and better priors for model training. Computer vision supports automated readouts from histopathology and cell imaging, cutting manual review time and standardizing scoring; adoption rises as labs embed imaging pipelines into LIMS and ELN systems.
Application Analysis
Genotoxicity remains the largest endpoint, representing 35% of 2023 demand as sponsors screen early for mutation and carcinogenicity risk. AI models flag structural alerts and dose–response patterns before animal studies, which trims repeat assays and rework. Hepatotoxicity, cardiotoxicity, and neurotoxicity form the next tier of spend. Computer vision and time-series analytics improve liver and cardiac signal detection from high-content imaging and MEA data, while NLP surfaces mechanistic evidence that supports regulatory submissions. You should expect multi-endpoint models that link exposure, ADME, and toxicity to gain share because they reduce handoffs between discovery and safety teams.
End-Use Analysis
Pharmaceutical and biotech companies account for the largest buyer group at roughly 53% of 2023 revenue, driven by the need to compress preclinical timelines and cut wet-lab costs per compound. Typical programs report double-digit reductions in screening assays when in silico triage is embedded before GLP studies. Chemicals and cosmetics firms expand usage to meet animal-reduction mandates and to accelerate ingredient safety reviews; portfolio-level screening helps you prioritize reformulation decisions. Research institutes and CROs act as capability multipliers, offering validation datasets, assay standardization, and fee-for-service model tuning for sponsors that lack in-house teams. Agriculture and food safety add incremental demand as residue and exposure modeling integrates with toxicity prediction.
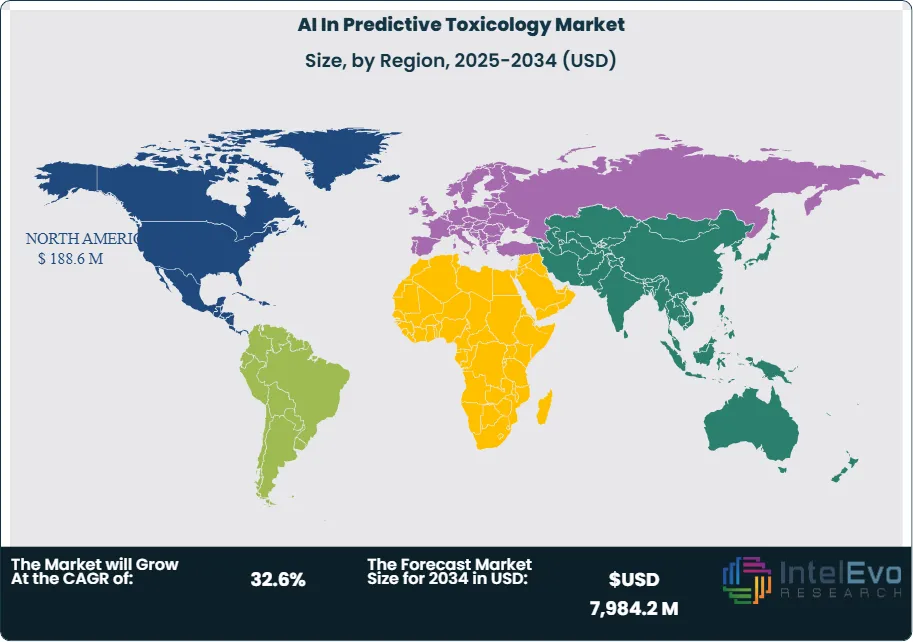
Regional Analysis
North America led with about 44% of global revenue in 2023, supported by a dense biotech base, active CRO ecosystem, and high software spend per program. Europe follows with strong regulatory engagement and public–private consortia that fund method validation and data sharing. Asia Pacific posts the fastest growth as domestic pharma increases discovery pipelines and governments back AI adoption in preclinical safety; you should watch China, India, and Singapore for new data partnerships and local cloud deployments. Latin America and the Middle East & Africa remain smaller but expand through reference deployments at national labs and universities; targeted grants and cloud-first tools lower entry barriers and support gradual scale-up through 2030 and beyond.
By Technology, Machine Learning, Natural Language Processing, Computer Vision, By Toxicity Endpoints, Genotoxicity, Hepatotoxicity, Neurotoxicity, Cardiotoxicity, By Component, Solution, Services, By End User, Pharma and Biotechnology Companies, Chemical and Cosmetics, Research Organization, Others
Research Methodology
Primary Research- 100 Interviews of Stakeholders
Secondary Research
Desk Research
Regional scope
North America (United States, Canada, Mexico)
Latin America (Brazil, Argentina, Columbia)
East Asia And Pacific (China, Japan, South Korea, Australia, Cambodia, Fiji, Indonesia)
Sea And South Asia (India, Singapore, Thailand, Taiwan, Malaysia)
Eastern Europe (Poland, Russia, Czech Republic, Romania)
Western Europe (Germany, U.K., France, Spain, Itlay)
Middle East & Africa (GCC Countries, Egypt, Nigeria, South Africa, Israel)
Customization for segments, region/country-level will be provided. Moreover, additional customization can be done based on the requirements.
Pricing and Purchase Options
Avail customized purchase options to meet your exact research needs. We have three licenses to opt for: Single User License, Multi-User License (Up to 5 Users), Corporate Use License (Unlimited User and Printable PDF).
TABLE OF CONTENTS
1. EXECUTIVE SUMMARY
1.1. MARKET SNAPSHOT
1.2. KEY FINDINGS & INSIGHTS
1.3. ANALYST RECOMMENDATIONS
1.4. FUTURE OUTLOOK
2. RESEARCH METHODOLOGY
2.1. MARKET DEFINITION & SCOPE
2.2. RESEARCH OBJECTIVES: PRIMARY & SECONDARY DATA SOURCES
2.3. DATA COLLECTION SOURCES
2.3.1. COVERAGE OF 100+ PRIMARY RESEARCH/CONSULTATION CALLS WITH INDUSTRY STAKEHOLDERS
FIGURE 17 NORTH AMERICA AI IN PREDICTIVE TOXICOLOGY CURRENT AND FUTURE TYPE ANALYSIS, 2025–2034, (USD MILLION)
FIGURE 18 NORTH AMERICA AI IN PREDICTIVE TOXICOLOGY CURRENT AND FUTURE END USER ANALYSIS, 2025–2034, (USD MILLION)
FIGURE 19 MARKET SHARE BY COUNTRY
FIGURE 20 LATIN AMERICA AI IN PREDICTIVE TOXICOLOGY CURRENT AND FUTURE TYPE ANALYSIS, 2025–2034, (USD MILLION)
FIGURE 21 LATIN AMERICA AI IN PREDICTIVE TOXICOLOGY CURRENT AND FUTURE END USER ANALYSIS, 2025–2034, (USD MILLION)
FIGURE 22 MARKET SHARE BY COUNTRY
FIGURE 23 EASTERN EUROPE AI IN PREDICTIVE TOXICOLOGY CURRENT AND FUTURE TYPE ANALYSIS, 2025–2034, (USD MILLION)
FIGURE 24 EASTERN EUROPE AI IN PREDICTIVE TOXICOLOGY CURRENT AND FUTURE END USER ANALYSIS, 2025–2034, (USD MILLION)
FIGURE 25 MARKET SHARE BY COUNTRY
FIGURE 26 WESTERN EUROPE AI IN PREDICTIVE TOXICOLOGY CURRENT AND FUTURE TYPE ANALYSIS, 2025–2034, (USD MILLION)
FIGURE 27 WESTERN EUROPE AI IN PREDICTIVE TOXICOLOGY CURRENT AND FUTURE END USER ANALYSIS, 2025–2034, (USD MILLION)
FIGURE 28 MARKET SHARE BY COUNTRY
FIGURE 29 EAST ASIA AND PACIFIC AI IN PREDICTIVE TOXICOLOGY CURRENT AND FUTURE TYPE ANALYSIS, 2025–2034, (USD MILLION)
FIGURE 30 EAST ASIA AND PACIFIC AI IN PREDICTIVE TOXICOLOGY CURRENT AND FUTURE END USER ANALYSIS, 2025–2034, (USD MILLION)
FIGURE 31 MARKET SHARE BY COUNTRY
FIGURE 32 SEA AND SOUTH ASIA AI IN PREDICTIVE TOXICOLOGY CURRENT AND FUTURE TYPE ANALYSIS, 2025–2034, (USD MILLION)
FIGURE 33 SEA AND SOUTH ASIA AI IN PREDICTIVE TOXICOLOGY CURRENT AND FUTURE END USER ANALYSIS, 2025–2034, (USD MILLION)
FIGURE 34 MARKET SHARE BY COUNTRY
FIGURE 35 MIDDLE EAST AND AFRICA AI IN PREDICTIVE TOXICOLOGY CURRENT AND FUTURE TYPE ANALYSIS, 2025–2034, (USD MILLION)
FIGURE 36 MIDDLE EAST AND AFRICA AI IN PREDICTIVE TOXICOLOGY CURRENT AND FUTURE END USER ANALYSIS, 2025–2034, (USD MILLION)
FIGURE 37 NORTH AMERICA AI IN PREDICTIVE TOXICOLOGY CURRENT AND FUTURE MARKET VOLUME SHARE REGIONAL ANALYSIS, 2025–2034, (USD MILLION)
FIGURE 38 U.S. AI IN PREDICTIVE TOXICOLOGY CURRENT AND FUTURE TYPE ANALYSIS, 2025–2034, (USD MILLION)
FIGURE 39 U.S. AI IN PREDICTIVE TOXICOLOGY CURRENT AND FUTURE END USER ANALYSIS, 2025–2034, (USD MILLION)
FIGURE 40 CANADA AI IN PREDICTIVE TOXICOLOGY CURRENT AND FUTURE TYPE ANALYSIS, 2025–2034, (USD MILLION)
FIGURE 41 CANADA AI IN PREDICTIVE TOXICOLOGY CURRENT AND FUTURE END USER ANALYSIS, 2025–2034, (USD MILLION)
FIGURE 42 LATIN AMERICA AI IN PREDICTIVE TOXICOLOGY CURRENT AND FUTURE MARKET VOLUME SHARE REGIONAL ANALYSIS, 2025–2034, (USD MILLION)
FIGURE 43 MEXICO AI IN PREDICTIVE TOXICOLOGY CURRENT AND FUTURE TYPE ANALYSIS, 2025–2034, (USD MILLION)
FIGURE 44 MEXICO AI IN PREDICTIVE TOXICOLOGY CURRENT AND FUTURE END USER ANALYSIS, 2025–2034, (USD MILLION)
FIGURE 45 BRAZIL AI IN PREDICTIVE TOXICOLOGY CURRENT AND FUTURE TYPE ANALYSIS, 2025–2034, (USD MILLION)
FIGURE 46 BRAZIL AI IN PREDICTIVE TOXICOLOGY CURRENT AND FUTURE END USER ANALYSIS, 2025–2034, (USD MILLION)
FIGURE 47 ARGENTINA AI IN PREDICTIVE TOXICOLOGY CURRENT AND FUTURE TYPE ANALYSIS, 2025–2034, (USD MILLION)
FIGURE 48 ARGENTINA AI IN PREDICTIVE TOXICOLOGY CURRENT AND FUTURE END USER ANALYSIS, 2025–2034, (USD MILLION)
FIGURE 49 COLUMBIA AI IN PREDICTIVE TOXICOLOGY CURRENT AND FUTURE TYPE ANALYSIS, 2025–2034, (USD MILLION)
FIGURE 50 COLUMBIA AI IN PREDICTIVE TOXICOLOGY CURRENT AND FUTURE END USER ANALYSIS, 2025–2034, (USD MILLION)
FIGURE 51 REST OF LATIN AMERICA AI IN PREDICTIVE TOXICOLOGY CURRENT AND FUTURE TYPE ANALYSIS, 2025–2034, (USD MILLION)
FIGURE 52 REST OF LATIN AMERICA AI IN PREDICTIVE TOXICOLOGY CURRENT AND FUTURE END USER ANALYSIS, 2025–2034, (USD MILLION)
FIGURE 53 EASTERN EUROPE AI IN PREDICTIVE TOXICOLOGY CURRENT AND FUTURE MARKET VOLUME SHARE REGIONAL ANALYSIS, 2025–2034, (USD MILLION)
FIGURE 54 POLAND AI IN PREDICTIVE TOXICOLOGY CURRENT AND FUTURE TYPE ANALYSIS, 2025–2034, (USD MILLION)
FIGURE 55 POLAND AI IN PREDICTIVE TOXICOLOGY CURRENT AND FUTURE END USER ANALYSIS, 2025–2034, (USD MILLION)
FIGURE 56 RUSSIA AI IN PREDICTIVE TOXICOLOGY CURRENT AND FUTURE TYPE ANALYSIS, 2025–2034, (USD MILLION)
FIGURE 57 RUSSIA AI IN PREDICTIVE TOXICOLOGY CURRENT AND FUTURE END USER ANALYSIS, 2025–2034, (USD MILLION)
FIGURE 58 CZECH REPUBLIC AI IN PREDICTIVE TOXICOLOGY CURRENT AND FUTURE TYPE ANALYSIS, 2025–2034, (USD MILLION)
FIGURE 59 CZECH REPUBLIC AI IN PREDICTIVE TOXICOLOGY CURRENT AND FUTURE END USER ANALYSIS, 2025–2034, (USD MILLION)
FIGURE 60 ROMANIA AI IN PREDICTIVE TOXICOLOGY CURRENT AND FUTURE TYPE ANALYSIS, 2025–2034, (USD MILLION)
FIGURE 61 ROMANIA AI IN PREDICTIVE TOXICOLOGY CURRENT AND FUTURE END USER ANALYSIS, 2025–2034, (USD MILLION)
FIGURE 62 REST OF EASTERN EUROPE AI IN PREDICTIVE TOXICOLOGY CURRENT AND FUTURE TYPE ANALYSIS, 2025–2034, (USD MILLION)
FIGURE 63 REST OF EASTERN EUROPE AI IN PREDICTIVE TOXICOLOGY CURRENT AND FUTURE END USER ANALYSIS, 2025–2034, (USD MILLION)
FIGURE 64 WESTERN EUROPE AI IN PREDICTIVE TOXICOLOGY CURRENT AND FUTURE MARKET VOLUME SHARE REGIONAL ANALYSIS, 2025–2034, (USD MILLION)
FIGURE 65 GERMANY AI IN PREDICTIVE TOXICOLOGY CURRENT AND FUTURE TYPE ANALYSIS, 2025–2034, (USD MILLION)
FIGURE 66 GERMANY AI IN PREDICTIVE TOXICOLOGY CURRENT AND FUTURE END USER ANALYSIS, 2025–2034, (USD MILLION)
FIGURE 67 FRANCE AI IN PREDICTIVE TOXICOLOGY CURRENT AND FUTURE TYPE ANALYSIS, 2025–2034, (USD MILLION)
FIGURE 68 FRANCE AI IN PREDICTIVE TOXICOLOGY CURRENT AND FUTURE END USER ANALYSIS, 2025–2034, (USD MILLION)
FIGURE 69 UK AI IN PREDICTIVE TOXICOLOGY CURRENT AND FUTURE TYPE ANALYSIS, 2025–2034, (USD MILLION)
FIGURE 70 UK AI IN PREDICTIVE TOXICOLOGY CURRENT AND FUTURE END USER ANALYSIS, 2025–2034, (USD MILLION)
FIGURE 71 SPAIN AI IN PREDICTIVE TOXICOLOGY CURRENT AND FUTURE TYPE ANALYSIS, 2025–2034, (USD MILLION)
FIGURE 72 SPAIN AI IN PREDICTIVE TOXICOLOGY CURRENT AND FUTURE END USER ANALYSIS, 2025–2034, (USD MILLION)
FIGURE 73 ITALY AI IN PREDICTIVE TOXICOLOGY CURRENT AND FUTURE TYPE ANALYSIS, 2025–2034, (USD MILLION)
FIGURE 74 ITALY AI IN PREDICTIVE TOXICOLOGY CURRENT AND FUTURE END USER ANALYSIS, 2025–2034, (USD MILLION)
FIGURE 75 REST OF WESTERN EUROPE AI IN PREDICTIVE TOXICOLOGY CURRENT AND FUTURE TYPE ANALYSIS, 2025–2034, (USD MILLION)
FIGURE 76 REST OF WESTERN EUROPE AI IN PREDICTIVE TOXICOLOGY CURRENT AND FUTURE END USER ANALYSIS, 2025–2034, (USD MILLION)
FIGURE 77 EAST ASIA AND PACIFIC AI IN PREDICTIVE TOXICOLOGY CURRENT AND FUTURE MARKET VOLUME SHARE REGIONAL ANALYSIS, 2025–2034, (USD MILLION)
FIGURE 78 CHINA AI IN PREDICTIVE TOXICOLOGY CURRENT AND FUTURE TYPE ANALYSIS, 2025–2034, (USD MILLION)
FIGURE 79 CHINA AI IN PREDICTIVE TOXICOLOGY CURRENT AND FUTURE END USER ANALYSIS, 2025–2034, (USD MILLION)
FIGURE 80 JAPAN AI IN PREDICTIVE TOXICOLOGY CURRENT AND FUTURE TYPE ANALYSIS, 2025–2034, (USD MILLION)
FIGURE 81 JAPAN AI IN PREDICTIVE TOXICOLOGY CURRENT AND FUTURE END USER ANALYSIS, 2025–2034, (USD MILLION)
FIGURE 82 AUSTRALIA AI IN PREDICTIVE TOXICOLOGY CURRENT AND FUTURE TYPE ANALYSIS, 2025–2034, (USD MILLION)
FIGURE 83 AUSTRALIA AI IN PREDICTIVE TOXICOLOGY CURRENT AND FUTURE END USER ANALYSIS, 2025–2034, (USD MILLION)
FIGURE 84 CAMBODIA AI IN PREDICTIVE TOXICOLOGY CURRENT AND FUTURE TYPE ANALYSIS, 2025–2034, (USD MILLION)
FIGURE 85 CAMBODIA AI IN PREDICTIVE TOXICOLOGY CURRENT AND FUTURE END USER ANALYSIS, 2025–2034, (USD MILLION)
FIGURE 86 FIJI AI IN PREDICTIVE TOXICOLOGY CURRENT AND FUTURE TYPE ANALYSIS, 2025–2034, (USD MILLION)
FIGURE 87 FIJI AI IN PREDICTIVE TOXICOLOGY CURRENT AND FUTURE END USER ANALYSIS, 2025–2034, (USD MILLION)
FIGURE 88 INDONESIA AI IN PREDICTIVE TOXICOLOGY CURRENT AND FUTURE TYPE ANALYSIS, 2025–2034, (USD MILLION)
FIGURE 89 INDONESIA AI IN PREDICTIVE TOXICOLOGY CURRENT AND FUTURE END USER ANALYSIS, 2025–2034, (USD MILLION)
FIGURE 90 SOUTH KOREA AI IN PREDICTIVE TOXICOLOGY CURRENT AND FUTURE TYPE ANALYSIS, 2025–2034, (USD MILLION)
FIGURE 91 SOUTH KOREA AI IN PREDICTIVE TOXICOLOGY CURRENT AND FUTURE END USER ANALYSIS, 2025–2034, (USD MILLION)
FIGURE 92 REST OF EAST ASIA AND PACIFIC AI IN PREDICTIVE TOXICOLOGY CURRENT AND FUTURE TYPE ANALYSIS, 2025–2034, (USD MILLION)
FIGURE 93 REST OF EAST ASIA AND PACIFIC AI IN PREDICTIVE TOXICOLOGY CURRENT AND FUTURE END USER ANALYSIS, 2025–2034, (USD MILLION)
FIGURE 94 SEA AND SOUTH ASIA AI IN PREDICTIVE TOXICOLOGY CURRENT AND FUTURE MARKET VOLUME SHARE REGIONAL ANALYSIS, 2025–2034, (USD MILLION)
FIGURE 95 BANGLADESH AI IN PREDICTIVE TOXICOLOGY CURRENT AND FUTURE TYPE ANALYSIS, 2025–2034, (USD MILLION)
FIGURE 96 BANGLADESH AI IN PREDICTIVE TOXICOLOGY CURRENT AND FUTURE END USER ANALYSIS, 2025–2034, (USD MILLION)
FIGURE 97 NEW ZEALAND AI IN PREDICTIVE TOXICOLOGY CURRENT AND FUTURE TYPE ANALYSIS, 2025–2034, (USD MILLION)
FIGURE 98 NEW ZEALAND AI IN PREDICTIVE TOXICOLOGY CURRENT AND FUTURE END USER ANALYSIS, 2025–2034, (USD MILLION)
FIGURE 99 INDIA AI IN PREDICTIVE TOXICOLOGY CURRENT AND FUTURE TYPE ANALYSIS, 2025–2034, (USD MILLION)
FIGURE 100 INDIA AI IN PREDICTIVE TOXICOLOGY CURRENT AND FUTURE END USER ANALYSIS, 2025–2034, (USD MILLION)
FIGURE 101 SINGAPORE AI IN PREDICTIVE TOXICOLOGY CURRENT AND FUTURE TYPE ANALYSIS, 2025–2034, (USD MILLION)
FIGURE 102 SINGAPORE AI IN PREDICTIVE TOXICOLOGY CURRENT AND FUTURE END USER ANALYSIS, 2025–2034, (USD MILLION)
FIGURE 103 THAILAND AI IN PREDICTIVE TOXICOLOGY CURRENT AND FUTURE TYPE ANALYSIS, 2025–2034, (USD MILLION)
FIGURE 104 THAILAND AI IN PREDICTIVE TOXICOLOGY CURRENT AND FUTURE END USER ANALYSIS, 2025–2034, (USD MILLION)
FIGURE 105 TAIWAN AI IN PREDICTIVE TOXICOLOGY CURRENT AND FUTURE TYPE ANALYSIS, 2025–2034, (USD MILLION)
FIGURE 106 TAIWAN AI IN PREDICTIVE TOXICOLOGY CURRENT AND FUTURE END USER ANALYSIS, 2025–2034, (USD MILLION)
FIGURE 107 MALAYSIA AI IN PREDICTIVE TOXICOLOGY CURRENT AND FUTURE TYPE ANALYSIS, 2025–2034, (USD MILLION)
FIGURE 108 MALAYSIA AI IN PREDICTIVE TOXICOLOGY CURRENT AND FUTURE END USER ANALYSIS, 2025–2034, (USD MILLION)
FIGURE 109 REST OF SEA AND SOUTH ASIA AI IN PREDICTIVE TOXICOLOGY CURRENT AND FUTURE TYPE ANALYSIS, 2025–2034, (USD MILLION)
FIGURE 110 REST OF SEA AND SOUTH ASIA AI IN PREDICTIVE TOXICOLOGY CURRENT AND FUTURE END USER ANALYSIS, 2025–2034, (USD MILLION)
FIGURE 111 MIDDLE EAST AND AFRICA AI IN PREDICTIVE TOXICOLOGY CURRENT AND FUTURE MARKET VOLUME SHARE REGIONAL ANALYSIS, 2025–2034, (USD MILLION)
FIGURE 112 GCC COUNTRIES AI IN PREDICTIVE TOXICOLOGY CURRENT AND FUTURE TYPE ANALYSIS, 2025–2034, (USD MILLION)
FIGURE 113 GCC COUNTRIES AI IN PREDICTIVE TOXICOLOGY CURRENT AND FUTURE END USER ANALYSIS, 2025–2034, (USD MILLION)
FIGURE 114 SAUDI ARABIA AI IN PREDICTIVE TOXICOLOGY CURRENT AND FUTURE TYPE ANALYSIS, 2025–2034, (USD MILLION)
FIGURE 115 SAUDI ARABIA AI IN PREDICTIVE TOXICOLOGY CURRENT AND FUTURE END USER ANALYSIS, 2025–2034, (USD MILLION)
FIGURE 116 UAE AI IN PREDICTIVE TOXICOLOGY CURRENT AND FUTURE TYPE ANALYSIS, 2025–2034, (USD MILLION)
FIGURE 117 UAE AI IN PREDICTIVE TOXICOLOGY CURRENT AND FUTURE END USER ANALYSIS, 2025–2034, (USD MILLION)
FIGURE 118 BAHRAIN AI IN PREDICTIVE TOXICOLOGY CURRENT AND FUTURE TYPE ANALYSIS, 2025–2034, (USD MILLION)
FIGURE 119 BAHRAIN AI IN PREDICTIVE TOXICOLOGY CURRENT AND FUTURE END USER ANALYSIS, 2025–2034, (USD MILLION)
FIGURE 120 KUWAIT AI IN PREDICTIVE TOXICOLOGY CURRENT AND FUTURE TYPE ANALYSIS, 2025–2034, (USD MILLION)
FIGURE 121 KUWAIT AI IN PREDICTIVE TOXICOLOGY CURRENT AND FUTURE END USER ANALYSIS, 2025–2034, (USD MILLION)
FIGURE 122 OMAN AI IN PREDICTIVE TOXICOLOGY CURRENT AND FUTURE TYPE ANALYSIS, 2025–2034, (USD MILLION)
FIGURE 123 OMAN AI IN PREDICTIVE TOXICOLOGY CURRENT AND FUTURE END USER ANALYSIS, 2025–2034, (USD MILLION)
FIGURE 124 QATAR AI IN PREDICTIVE TOXICOLOGY CURRENT AND FUTURE TYPE ANALYSIS, 2025–2034, (USD MILLION)
FIGURE 125 QATAR AI IN PREDICTIVE TOXICOLOGY CURRENT AND FUTURE END USER ANALYSIS, 2025–2034, (USD MILLION)
FIGURE 126 EGYPT AI IN PREDICTIVE TOXICOLOGY CURRENT AND FUTURE TYPE ANALYSIS, 2025–2034, (USD MILLION)
FIGURE 127 EGYPT AI IN PREDICTIVE TOXICOLOGY CURRENT AND FUTURE END USER ANALYSIS, 2025–2034, (USD MILLION)
FIGURE 128 NIGERIA AI IN PREDICTIVE TOXICOLOGY CURRENT AND FUTURE TYPE ANALYSIS, 2025–2034, (USD MILLION)
FIGURE 129 NIGERIA AI IN PREDICTIVE TOXICOLOGY CURRENT AND FUTURE END USER ANALYSIS, 2025–2034, (USD MILLION)
FIGURE 130 SOUTH AFRICA AI IN PREDICTIVE TOXICOLOGY CURRENT AND FUTURE TYPE ANALYSIS, 2025–2034, (USD MILLION)
FIGURE 131 SOUTH AFRICA AI IN PREDICTIVE TOXICOLOGY CURRENT AND FUTURE END USER ANALYSIS, 2025–2034, (USD MILLION)
FIGURE 132 ISRAEL AI IN PREDICTIVE TOXICOLOGY CURRENT AND FUTURE TYPE ANALYSIS, 2025–2034, (USD MILLION)
FIGURE 133 ISRAEL AI IN PREDICTIVE TOXICOLOGY CURRENT AND FUTURE END USER ANALYSIS, 2025–2034, (USD MILLION)
FIGURE 134 REST OF MEA AI IN PREDICTIVE TOXICOLOGY CURRENT AND FUTURE TYPE ANALYSIS, 2025–2034, (USD MILLION)
FIGURE 135 REST OF MEA AI IN PREDICTIVE TOXICOLOGY CURRENT AND FUTURE END USER ANALYSIS, 2025–2034, (USD MILLION)
FIGURE 136 U. S. MARKET SHARE ANALYSIS BY TYPE (2024)
FIGURE 137 U. S. MARKET SHARE ANALYSIS BY END USER (2024)
FIGURE 138 CANADA MARKET SHARE ANALYSIS BY TYPE (2024)
FIGURE 139 CANADA MARKET SHARE ANALYSIS BY END USER (2024)
FIGURE 140 MEXICO MARKET SHARE ANALYSIS BY TYPE (2024)
FIGURE 141 MEXICO MARKET SHARE ANALYSIS BY END USER (2024)
FIGURE 142 CHINA MARKET SHARE ANALYSIS BY TYPE (2024)
FIGURE 143 CHINA MARKET SHARE ANALYSIS BY END USER (2024)
FIGURE 144 JAPAN MARKET SHARE ANALYSIS BY TYPE (2024)
FIGURE 145 JAPAN MARKET SHARE ANALYSIS BY END USER (2024)
FIGURE 146 INDIA MARKET SHARE ANALYSIS BY TYPE (2024)
FIGURE 147 INDIA MARKET SHARE ANALYSIS BY END USER (2024)
FIGURE 148 SOUTH KOREA MARKET SHARE ANALYSIS BY TYPE (2024)
FIGURE 149 SOUTH KOREA MARKET SHARE ANALYSIS BY END USER (2024)
FIGURE 150 SAUDI ARABIA MARKET SHARE ANALYSIS BY TYPE (2024)
FIGURE 151 SAUDI ARABIA MARKET SHARE ANALYSIS BY END USER (2024)
FIGURE 152 UAE MARKET SHARE ANALYSIS BY TYPE (2024)
FIGURE 153 UAE MARKET SHARE ANALYSIS BY END USER (2024)
FIGURE 154 EGYPT MARKET SHARE ANALYSIS BY TYPE (2024)
FIGURE 155 EGYPT MARKET SHARE ANALYSIS BY END USER (2024)
FIGURE 156 NIGERIA MARKET SHARE ANALYSIS BY TYPE (2024)
FIGURE 157 NIGERIA MARKET SHARE ANALYSIS BY END USER (2024)
FIGURE 158 SOUTH AFRICA MARKET SHARE ANALYSIS BY TYPE (2024)
FIGURE 159 SOUTH AFRICA MARKET SHARE ANALYSIS BY END USER (2024)
FIGURE 160 GERMANY MARKET SHARE ANALYSIS BY TYPE (2024)
FIGURE 161 GERMANY MARKET SHARE ANALYSIS BY END USER (2024)
FIGURE 162 FRANCE MARKET SHARE ANALYSIS BY TYPE (2024)
FIGURE 163 FRANCE MARKET SHARE ANALYSIS BY END USER (2024)
FIGURE 164 UK MARKET SHARE ANALYSIS BY TYPE (2024)
FIGURE 165 UK MARKET SHARE ANALYSIS BY END USER (2024)
FIGURE 166 SPAIN MARKET SHARE ANALYSIS BY TYPE (2024)
FIGURE 167 SPAIN MARKET SHARE ANALYSIS BY END USER (2024)
FIGURE 168 ITALY MARKET SHARE ANALYSIS BY TYPE (2024)
FIGURE 169 ITALY MARKET SHARE ANALYSIS BY END USER (2024)
FIGURE 170 BRAZIL MARKET SHARE ANALYSIS BY TYPE (2024)
FIGURE 171 BRAZIL MARKET SHARE ANALYSIS BY END USER (2024)
FIGURE 172 ARGENTINA MARKET SHARE ANALYSIS BY TYPE (2024)
FIGURE 173 ARGENTINA MARKET SHARE ANALYSIS BY END USER (2024)
FIGURE 174 COLUMBIA MARKET SHARE ANALYSIS BY TYPE (2024)
FIGURE 175 COLUMBIA MARKET SHARE ANALYSIS BY END USER (2024)
FIGURE 176 GLOBAL AI IN PREDICTIVE TOXICOLOGY CURRENT AND FUTURE MARKET KEY COUNTRY LEVEL ANALYSIS, 2024–2034, (USD MILLION)
FIGURE 177 FINANCIAL OVERVIEW:
Key Player Analysis
BenevolentAI: BenevolentAI is positioned as a leader focused on AI-first discovery with growing traction in target identification and portfolio partnerships. The company’s 2024–2025 reset returns it to a “TechBio” model and prioritizes platform deals over wholly owned programs, following a strategic overhaul announced in December 2024.Notably, its multi-year collaboration with AstraZeneca continued to progress in 2024, with additional targets advanced in cardiovascular and immunology settings, reinforcing BenevolentAI’s credibility with large pharma buyers that demand validated pipelines and auditability. BenevolentAI competes on algorithmic target discovery, documented partner outcomes, and the ability to integrate into enterprise R&D governance.
Berg Health (now part of BPGbio): Berg’s assets and platform were acquired by BPGbio, which now operates the integrated NAi Interrogative Biology platform combining biobank-scale datasets, Bayesian AI, and high-performance computing. BPGbio highlights access to Frontier-class compute and a large clinically annotated biobank, positioning the combined entity as an innovator in biology-first discovery and diagnostics that can inform predictive safety modeling and translational risk flags. For buyers, BPGbio’s differentiator is end-to-end capability from patient-derived data through AI-guided hypothesis generation, which can augment preclinical safety assessments and reduce wet-lab cycles.
Biovista: Biovista is a niche player with a long track record in literature-based discovery and predictive safety analytics. Its COSS platform blends text-mining with in silico simulations to produce ranked safety and efficacy hypotheses that support indication expansion and adverse event risk assessment. The company also collaborates with regulators, including work with the U.S. FDA on adverse event prediction at the drug-class level, which strengthens validation for pharmacovigilance and risk management use cases. If your teams need transparent, evidence-linked predictions for dossier support, Biovista’s strength lies in explainable outputs and regulatory-oriented workflows.
Cyclica (a Recursion company): Cyclica now operates within Recursion following a 2023 acquisition that expanded Recursion’s machine-learning toolkit for polypharmacology and off-target profiling. As part of a larger compute-at-scale environment, Cyclica’s proteome-wide screening and matchmaker technologies can feed predictive toxicology by flagging off-target liabilities and mechanism-linked safety signals earlier in the pipeline. For enterprise sponsors, the integration into Recursion’s platform increases data breadth and computational throughput, improving the odds of detecting class liabilities before costly GLP studies.
Market Key Players
Recursion Pharmaceuticals
Lhasa Limited
Exscientia PLC
Biovista
Benevolent AI
Instem plc
Insilico Medicine
Cyclica
Berg Health
Driver
Growing Focus on Faster Safety Triage
By 2025, sponsors are putting more emphasis on speeding up safety triage and reducing preclinical development costs. The market grew from USD 360.1 million in 2023 and is currently tracking a 30.0% CAGR through 2033. This shift highlights a growing focus on computational toxicology. Pharmaceutical and biotech companies, which accounted for about 53% of spending in 2023, are using AI platforms to screen extensive compound libraries before GLP studies begin. This early filtering helps teams identify genotoxicity, hepatotoxicity, and cardiotoxicity risks long before expensive assays start. It leads to better decision-making and faster R&D processes.
AI-Driven Productivity Gains in Pipeline Advancement
Machine learning captured 41% of the technology market share in 2023, emphasizing its key role in high-throughput risk ranking workflows. Programs that use in silico gates at early decision points see reductions of 10–20% in confirmatory assays. This contributes to quicker turnaround times and better hit-to-lead conversion rates. The ability to perform rapid, algorithm-driven toxicity predictions helps organizations shorten development cycles, use wet-lab resources more efficiently, and improve asset quality as they move into downstream toxicology stages.
Restraint
Data Quality and Validation Barriers Slowing Adoption
Even with progress, the industry's overall adoption is held back by uneven standards and varied data quality. Many AI models rely on inconsistent assays, sparse labels, and misaligned ontologies. This leads to mixed external validity, complicating regulatory and QA approval processes. These issues require more internal checks, extending the time needed for model approval and hindering company-wide implementation. Consequently, smaller sponsors with less developed data-management practices are more cautious about using AI-driven toxicology tools.
High Integration and Governance Costs Limit ROI
In addition to data problems, the costs of integration and operationalization significantly impact buyer decisions. Companies need to invest heavily in data engineering, LIMS/ELN integrations, workflow connectivity, and ongoing model governance. These expenses often add several months to implementation timelines. The upfront costs limit near-term ROI and mostly restrict adoption to larger organizations with established digital infrastructure. Until deployment budgets stabilize and toolchains become easier to integrate, purchases will continue to favor major pharmaceutical and biotech companies.
Opportunity
Expansion into Multimodal and Personalized Toxicology
Rapid improvements in multimodal modeling and personalized risk prediction are opening up significant new revenue opportunities. AI platforms that combine chemical structure data with omics, imaging, and exposure profiles extend predictive toxicology from general population insights to more targeted predictions for specific cohorts or patient segments. With genotoxicity currently accounting for 35% of endpoint demand, expanding into organ-specific risks and population variability could greatly boost average contract values for vendors.
High-Growth Prospects in Asia Pacific and Mid-Tier Markets
Asia Pacific is set to grow faster than the global market as local discovery pipelines expand and governments invest in national toxicology data initiatives. Maintaining a CAGR in the high-20s to low-30s could generate several hundred million dollars in regional spending by 2033. Vendors that provide bundled solutions—including validated models, regulatory-compliant documentation, and flexible pay-as-you-go licensing—are positioned to attract substantial budgets from mid-tier sponsors looking for scalable and lower-risk entry into AI-enabled safety assessment.
A global shift toward animal-reduction mandates and digital QA transformation is changing toxicology workflows. AI solutions, which made up 61% of revenue in 2023, increasingly use uncertainty quantification, conformal prediction frameworks, and provenance logs to meet evolving audit and compliance needs. These features let sponsors prove traceability, model reliability, and decision accountability, increasing comfort with computational toxicology results.
North America held around 44% of the market share, backed by a strong presence of biotech and CROs. Europe and APAC are narrowing the gap through regulatory consortia and cross-border validation efforts. Procurement teams now expect model cards, benchmark challenges, and real-world performance monitoring as conditions for purchase. This shift raises competitive pressure on vendors that can deliver measurable accuracy improvements, validated pipelines, and compliant, continuously updated model ecosystems.
Recent Developments
Dec 2024 – BenevolentAI: Announced a strategic overhaul to return to a TechBio partnership model, focusing on platform deals and cost discipline; the shift follows continued progress in its multi-year collaboration with AstraZeneca on AI-enabled target discovery. The reset prioritizes scalable, partner-driven revenue and positions the platform for safety-relevant use cases in early development.
Feb 2025 – Incyte & Genesis Therapeutics: Entered a multi-target AI collaboration for small-molecule discovery; financial terms undisclosed, but scope covers discovery to early development with AI methods expected to improve hit quality and reduce safety attrition. The deal broadens pharma access to AI pipelines that integrate early risk flags for toxicity before GLP studies.
Apr 2025 – Certara: Rolled out Simcyp version 24 and expanded positioning for Certara.AI, highlighting PBPK and QST workflows that support hepatotoxicity and cardiotoxicity risk assessment; update framed as part of a 2025 product roadmap. The release strengthens Certara’s role in regulatory-grade modeling and increases switching costs for sponsors standardizing predictive safety toolchains. (
Jul 2025 – Instem: Featured predictive toxicology solutions at the Japanese Society of Toxicology meeting and continued promotion of Leadscope Model Applier 2025.0; the LMA update added data-integration and model-explainability features for in silico assessments. The activity deepens Instem’s APAC footprint and supports uptake of AI-assisted genotoxicity and carcinogenicity screening.
Sep 2025 – Insilico Medicine: Launched an AI platform to accelerate small-molecule discovery with built-in efficacy and toxicity prediction; early users reported faster lead identification and reduced R&D timelines. The launch increases competition in end-to-end AI stacks and pushes vendors to demonstrate measurable reductions in safety-related attrition.