AI in PropTech Market Size, Growth & Forecast | 25.6% CAGR
Global AI in PropTech Market Size, Share & Analysis By Component (Solution, Services), By Deployment Mode (Cloud-Based, On-Premise), By End-Use (Residential, Commercial) Industry Digitization Trends & Forecast 2025–2034
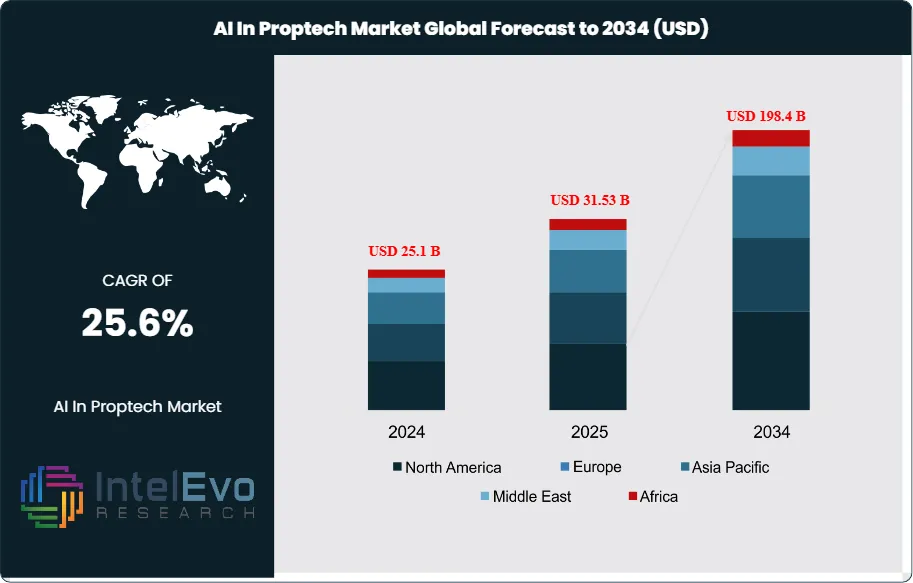
The AI in PropTech Market is valued at approximately USD 25.1 billion in 2024 and is projected to reach nearly USD 198.4 billion by 2034, expanding at an estimated CAGR of around 25.6% during 2025–2034. AI-driven automation, energy-optimization platforms, predictive maintenance, and smart-building analytics are transforming real estate operations across commercial, residential, and industrial assets. With digital twins, autonomous property management, and AI-enabled investment analytics gaining momentum, PropTech is entering a high-growth decade driven by efficiency, sustainability, and data-led decision-making. These advancements are reshaping tenant experience, reducing operating costs, and accelerating adoption across global developers, facility managers, and institutional investors—making AI one of the most disruptive forces in the real estate ecosystem.
After an early commercialization phase marked by pilots and point solutions, adoption has accelerated as owners, operators, and investors seek measurable gains in leasing velocity, asset valuation accuracy, operating expense reduction, and energy optimization. Funding signals remain supportive: AI-powered proptech companies attracted roughly USD 630 million in 2024, while landmark 2021 rounds—USD 700 million for Better.com and USD 500 million each for ServiceTitan and Hippo Insurance—demonstrated the category’s scale potential and strategic relevance. On the demand side, enterprises are unlocking value from previously siloed real-estate data: JLL reported 1.9 million square meters of demand for AI-enabled real estate solutions by end-2024 and used automated valuation and database tools to support analysis of USD 11 billion in transaction volumes, underscoring momentum in high-stakes, data-heavy workflows.
Growth is propelled by multiple vectors. Digitization of property management and facilities operations is expanding the addressable base for predictive maintenance, dynamic work-order routing, and computer-vision-based inspections, typically yielding 10–20% maintenance savings and 5–15% energy reductions at scale. On the supply side, cloud ubiquity, IoT sensor proliferation, and increasingly accessible ML platforms lower integration barriers, while maturing APIs enable bidirectional data flow across leasing, accounting, and building management systems. Regulatory and macro headwinds—data privacy, model explainability, fragmented data standards, and cyclical capex constraints from higher rates—remain manageable but require robust governance, cybersecurity, and clear ROI narratives.
Technology innovation is reshaping adoption patterns. Generative AI is accelerating lease abstraction, marketing content creation, and tenant communications; digital twins and physics-informed models optimize HVAC and space utilization; and AI-augmented underwriting enhances risk screening and portfolio rebalancing. Computer vision and NLP unlock unstructured data from site images and documents, while autonomous analytics deliver real-time variance alerts to asset managers. Regionally, North America leads on revenue and platform maturity, Europe advances with ESG-driven retrofits and strict data regimes, and Asia–Pacific is the fastest-growing arena as smart-city investments scale in China, India, and Southeast Asia. Emerging hotspots such as the Gulf states and Singapore combine green-building mandates with capital availability, positioning them as outsize adopters. For investors, the most attractive opportunities cluster around interoperable data layers, energy and maintenance optimization, and AI-driven transaction workflows that compress cycle times and improve yield.
Key Takeaways
Market Growth: The global AI in PropTech market was USD 25.1 billion in 2024 and is projected to reach USD 198.4 billion by 2034 (25.6% CAGR), driven by digitization of property operations, cloud/IoT data exhaust, and maturing AI toolchains. Incremental value creation of ≈USD 198.4 billion over 2025–2034 reflects accelerating adoption across valuation, maintenance, leasing, and energy optimization.
Component:Solutions led with 67.3% revenue share in 2024, outpacing services due to packaged analytics, digital twins, and AI-enabled valuation/CRM that deliver faster time-to-value and portfolio-scale deployment. Services remain essential for integration and data engineering but account for the remaining 32.7%.
Deployment Mode:Cloud-based platforms captured 68.0% share in 2024 as elastic compute and API ecosystems reduced training/inference costs and sped integrations; on-premises persists in data-sovereignty and mission-critical sites. Growing multi-cloud adoption is widening the gap through faster release cycles and security certifications.
Driver: Data-rich workflows are primed for automation—lease abstraction, predictive maintenance, and tenant engagement—supporting 10–20% maintenance savings and 5–15% energy reductions at scale. Capital formation remains supportive, with ~USD 630 million invested in AI-proptech in 2024 and prior mega-rounds (e.g., USD 700M/Better.com; USD 500M/ServiceTitan; USD 500M/Hippo) signaling sustained investor confidence.
Restraint: Fragmented data standards, privacy/regulatory constraints, and legacy BMS/CAFM silos raise integration complexity, typically adding ≈10–15% to project costs and extending deployments by 3–6 months. Explainability and model-risk governance requirements can further slow enterprise procurement cycles.
Opportunity: Commercial and industrial smart-building upgrades are underpenetrated relative to Residential’s 60.5% share (2024) and are poised to outgrow the market at ~24–26% CAGR. If they capture ~30–35% of incremental spend, these segments could unlock ≈USD 42–49 billion in new revenue by 2034, led by energy, maintenance, and space-optimization use cases.
Trend: Generative AI is scaling from pilots to production—automating 60–80% of lease-clause extraction, accelerating marketing content, and streamlining tenant support—while computer vision enables remote inspections and anomaly detection. Interoperable data layers and API-first ecosystems are becoming de facto standards for cross-platform underwriting and asset-performance analytics.
Regional Analysis: North America led with a 41.2% share (≈USD 8.4 billion) in 2024 on platform maturity and enterprise budgets; Europe is expanding under ESG retrofits and data-governance regimes. Asia–Pacific is the fastest-growing investment hotspot, projected at ~26–28% CAGR through 2034, with smart-city and green-building programs in China, India, Southeast Asia, and the Gulf states accelerating AI deployment.
Component Analysis
Solutions remain the center of gravity for AI in PropTech, accounting for an estimated 67.3% of segment revenue in 2024 and retaining leadership into 2025 as owners and operators prioritize packaged analytics, computer-vision modules, and AI-enhanced valuation/CRM suites that deliver rapid, portfolio-scale ROI. Productized capabilities—lease abstraction, anomaly detection for building systems, and digital-twin optimization—are increasingly embedded into core platforms, compressing deployment cycles and expanding attach rates across property management and brokerage workflows.
Services, while the smaller share, are gaining strategic weight as enterprises move from pilots to scaled programs. Demand is shifting toward data engineering, MLOps, model governance, and change-management services that de-risk AI adoption in regulated environments. As the broader market advances at roughly a low-20s CAGR through the late 2020s, advisory and integration services are positioned to grow in line with—or modestly ahead of—the total market, supported by multi-cloud rollouts, legacy system remediation, and enterprise-grade security requirements.
Deployment Mode Analysis
Cloud-based delivery dominated with about 68.0% share in 2024 and continues to expand in 2025, propelled by elastic compute for training/inference, API ecosystems, and usage-based pricing that lowers total cost of ownership for portfolios spanning hundreds of assets. Cloud-first stacks enable near real-time ingestion of IoT feeds and geospatial data, supporting predictive maintenance and space-utilization analytics across distributed footprints while meeting procurement expectations for speed and interoperability.
On-premise remains essential for data-sovereign workflows, mission-critical facilities, and environments with strict latency or uptime constraints. Hybrid patterns are becoming standard: model development and orchestration in the cloud, with inference at the edge for computer vision (e.g., access control, safety monitoring) or BMS integrations. In 2025+, heightened compliance obligations and customer security audits sustain on-premise and private-cloud demand, even as net new deployments skew cloud-first.
End-Use Analysis
Residential applications led with approximately 60.5% share in 2024 and continue to anchor volume as smart-home ecosystems, multifamily platforms, and resident-experience apps scale globally. Operators report double-digit improvements in work-order cycle times and 5–15% reductions in energy consumption where AI-enabled controls, demand response, and automated fault detection are deployed—supporting rent premiums and lower operating costs in competitive markets.
Commercial adoption is accelerating from a smaller base, driven by decarbonization mandates, corporate ESG reporting, and the economics of predictive maintenance (often yielding 10–20% maintenance savings) for large office, retail, and logistics portfolios. AI-assisted underwriting, dynamic space planning, and lease analytics are moving from pilots to standard practice, narrowing the gap with residential as enterprises consolidate data lakes and deploy portfolio-wide analytics.
Regional Analysis
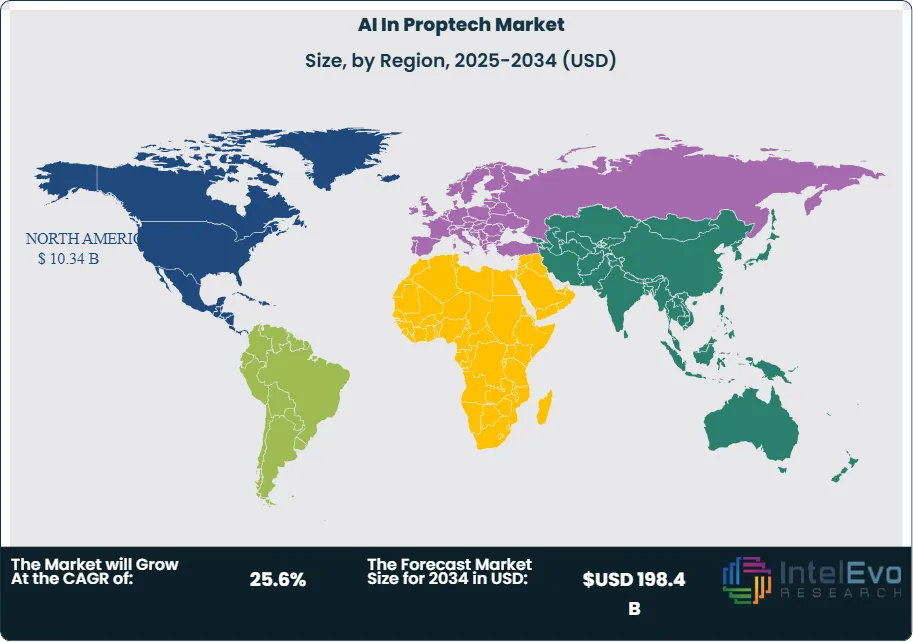
North America remains the revenue leader—about 41.2% share, or roughly USD 8.4 billion in 2024—underpinned by platform maturity, deep venture and corporate investment, and rapid adoption across multifamily and single-family rental platforms. Europe follows with robust momentum as energy-efficiency retrofits, data-privacy regimes, and evolving AI governance catalyze deployments in office, hospitality, and social housing; EU-aligned compliance features are becoming vendor differentiators.
Asia Pacific is the fastest-growing region through 2025+, supported by smart-city initiatives, green-building codes, and large new-build pipelines in China, India, Southeast Asia, Japan, and Australia. The Middle East & Africa and Latin America are earlier in the curve but show rising project pipelines—particularly in the Gulf’s high-spec commercial assets and Brazil/Mexico’s institutionalizing multifamily and logistics sectors—where greenfield developments and government digital-infrastructure programs favor cloud-first, AI-ready proptech stacks.
By Component (Solution, Services), By Deployment Mode (Cloud-Based, On-Premise), By End-Use (Residential, Commercial)
Research Methodology
Primary Research- 100 Interviews of Stakeholders
Secondary Research
Desk Research
Regional scope
North America (United States, Canada, Mexico)
Latin America (Brazil, Argentina, Columbia)
East Asia And Pacific (China, Japan, South Korea, Australia, Cambodia, Fiji, Indonesia)
Sea And South Asia (India, Singapore, Thailand, Taiwan, Malaysia)
Eastern Europe (Poland, Russia, Czech Republic, Romania)
Western Europe (Germany, U.K., France, Spain, Itlay)
Middle East & Africa (GCC Countries, Egypt, Nigeria, South Africa, Israel)
Competitive Landscape
Reonomy, Realtor.com, Skyline AI, Jones Lang LaSalle Incorporated, HouseCanary, Inc., Zillow Group, Apartment List, Compass, Redfin Corporation, Roof AI, Other Key Players
Customization Scope
Customization for segments, region/country-level will be provided. Moreover, additional customization can be done based on the requirements.
Pricing and Purchase Options
Avail customized purchase options to meet your exact research needs. We have three licenses to opt for: Single User License, Multi-User License (Up to 5 Users), Corporate Use License (Unlimited User and Printable PDF).
TABLE OF CONTENTS
1. EXECUTIVE SUMMARY
1.1. MARKET SNAPSHOT
1.2. KEY FINDINGS & INSIGHTS
1.3. ANALYST RECOMMENDATIONS
1.4. FUTURE OUTLOOK
2. RESEARCH METHODOLOGY
2.1. MARKET DEFINITION & SCOPE
2.2. RESEARCH OBJECTIVES: PRIMARY & SECONDARY DATA SOURCES
2.3. DATA COLLECTION SOURCES
2.3.1. COVERAGE OF 100+ PRIMARY RESEARCH/CONSULTATION CALLS WITH INDUSTRY STAKEHOLDERS
FIGURE 17 NORTH AMERICA AI IN PROPTECH SYSTEM CURRENT AND FUTURE TYPE ANALYSIS, 2025–2034, (USD MILLION)
FIGURE 18 NORTH AMERICA AI IN PROPTECH SYSTEM CURRENT AND FUTURE END USER ANALYSIS, 2025–2034, (USD MILLION)
FIGURE 19 MARKET SHARE BY COUNTRY
FIGURE 20 LATIN AMERICA AI IN PROPTECH SYSTEM CURRENT AND FUTURE TYPE ANALYSIS, 2025–2034, (USD MILLION)
FIGURE 21 LATIN AMERICA AI IN PROPTECH SYSTEM CURRENT AND FUTURE END USER ANALYSIS, 2025–2034, (USD MILLION)
FIGURE 22 MARKET SHARE BY COUNTRY
FIGURE 23 EASTERN EUROPE AI IN PROPTECH SYSTEM CURRENT AND FUTURE TYPE ANALYSIS, 2025–2034, (USD MILLION)
FIGURE 24 EASTERN EUROPE AI IN PROPTECH SYSTEM CURRENT AND FUTURE END USER ANALYSIS, 2025–2034, (USD MILLION)
FIGURE 25 MARKET SHARE BY COUNTRY
FIGURE 26 WESTERN EUROPE AI IN PROPTECH SYSTEM CURRENT AND FUTURE TYPE ANALYSIS, 2025–2034, (USD MILLION)
FIGURE 27 WESTERN EUROPE AI IN PROPTECH SYSTEM CURRENT AND FUTURE END USER ANALYSIS, 2025–2034, (USD MILLION)
FIGURE 28 MARKET SHARE BY COUNTRY
FIGURE 29 EAST ASIA AND PACIFIC AI IN PROPTECH SYSTEM CURRENT AND FUTURE TYPE ANALYSIS, 2025–2034, (USD MILLION)
FIGURE 30 EAST ASIA AND PACIFIC AI IN PROPTECH SYSTEM CURRENT AND FUTURE END USER ANALYSIS, 2025–2034, (USD MILLION)
FIGURE 31 MARKET SHARE BY COUNTRY
FIGURE 32 SEA AND SOUTH ASIA AI IN PROPTECH SYSTEM CURRENT AND FUTURE TYPE ANALYSIS, 2025–2034, (USD MILLION)
FIGURE 33 SEA AND SOUTH ASIA AI IN PROPTECH SYSTEM CURRENT AND FUTURE END USER ANALYSIS, 2025–2034, (USD MILLION)
FIGURE 34 MARKET SHARE BY COUNTRY
FIGURE 35 MIDDLE EAST AND AFRICA AI IN PROPTECH SYSTEM CURRENT AND FUTURE TYPE ANALYSIS, 2025–2034, (USD MILLION)
FIGURE 36 MIDDLE EAST AND AFRICA AI IN PROPTECH SYSTEM CURRENT AND FUTURE END USER ANALYSIS, 2025–2034, (USD MILLION)
FIGURE 37 NORTH AMERICA AI IN PROPTECH SYSTEM CURRENT AND FUTURE MARKET VOLUME SHARE REGIONAL ANALYSIS, 2025–2034, (USD MILLION)
FIGURE 38 U.S. AI IN PROPTECH SYSTEM CURRENT AND FUTURE TYPE ANALYSIS, 2025–2034, (USD MILLION)
FIGURE 39 U.S. AI IN PROPTECH SYSTEM CURRENT AND FUTURE END USER ANALYSIS, 2025–2034, (USD MILLION)
FIGURE 40 CANADA AI IN PROPTECH SYSTEM CURRENT AND FUTURE TYPE ANALYSIS, 2025–2034, (USD MILLION)
FIGURE 41 CANADA AI IN PROPTECH SYSTEM CURRENT AND FUTURE END USER ANALYSIS, 2025–2034, (USD MILLION)
FIGURE 42 LATIN AMERICA AI IN PROPTECH SYSTEM CURRENT AND FUTURE MARKET VOLUME SHARE REGIONAL ANALYSIS, 2025–2034, (USD MILLION)
FIGURE 43 MEXICO AI IN PROPTECH SYSTEM CURRENT AND FUTURE TYPE ANALYSIS, 2025–2034, (USD MILLION)
FIGURE 44 MEXICO AI IN PROPTECH SYSTEM CURRENT AND FUTURE END USER ANALYSIS, 2025–2034, (USD MILLION)
FIGURE 45 BRAZIL AI IN PROPTECH SYSTEM CURRENT AND FUTURE TYPE ANALYSIS, 2025–2034, (USD MILLION)
FIGURE 46 BRAZIL AI IN PROPTECH SYSTEM CURRENT AND FUTURE END USER ANALYSIS, 2025–2034, (USD MILLION)
FIGURE 47 ARGENTINA AI IN PROPTECH SYSTEM CURRENT AND FUTURE TYPE ANALYSIS, 2025–2034, (USD MILLION)
FIGURE 48 ARGENTINA AI IN PROPTECH SYSTEM CURRENT AND FUTURE END USER ANALYSIS, 2025–2034, (USD MILLION)
FIGURE 49 COLUMBIA AI IN PROPTECH SYSTEM CURRENT AND FUTURE TYPE ANALYSIS, 2025–2034, (USD MILLION)
FIGURE 50 COLUMBIA AI IN PROPTECH SYSTEM CURRENT AND FUTURE END USER ANALYSIS, 2025–2034, (USD MILLION)
FIGURE 51 REST OF LATIN AMERICA AI IN PROPTECH SYSTEM CURRENT AND FUTURE TYPE ANALYSIS, 2025–2034, (USD MILLION)
FIGURE 52 REST OF LATIN AMERICA AI IN PROPTECH SYSTEM CURRENT AND FUTURE END USER ANALYSIS, 2025–2034, (USD MILLION)
FIGURE 53 EASTERN EUROPE AI IN PROPTECH SYSTEM CURRENT AND FUTURE MARKET VOLUME SHARE REGIONAL ANALYSIS, 2025–2034, (USD MILLION)
FIGURE 54 POLAND AI IN PROPTECH SYSTEM CURRENT AND FUTURE TYPE ANALYSIS, 2025–2034, (USD MILLION)
FIGURE 55 POLAND AI IN PROPTECH SYSTEM CURRENT AND FUTURE END USER ANALYSIS, 2025–2034, (USD MILLION)
FIGURE 56 RUSSIA AI IN PROPTECH SYSTEM CURRENT AND FUTURE TYPE ANALYSIS, 2025–2034, (USD MILLION)
FIGURE 57 RUSSIA AI IN PROPTECH SYSTEM CURRENT AND FUTURE END USER ANALYSIS, 2025–2034, (USD MILLION)
FIGURE 58 CZECH REPUBLIC AI IN PROPTECH SYSTEM CURRENT AND FUTURE TYPE ANALYSIS, 2025–2034, (USD MILLION)
FIGURE 59 CZECH REPUBLIC AI IN PROPTECH SYSTEM CURRENT AND FUTURE END USER ANALYSIS, 2025–2034, (USD MILLION)
FIGURE 60 ROMANIA AI IN PROPTECH SYSTEM CURRENT AND FUTURE TYPE ANALYSIS, 2025–2034, (USD MILLION)
FIGURE 61 ROMANIA AI IN PROPTECH SYSTEM CURRENT AND FUTURE END USER ANALYSIS, 2025–2034, (USD MILLION)
FIGURE 62 REST OF EASTERN EUROPE AI IN PROPTECH SYSTEM CURRENT AND FUTURE TYPE ANALYSIS, 2025–2034, (USD MILLION)
FIGURE 63 REST OF EASTERN EUROPE AI IN PROPTECH SYSTEM CURRENT AND FUTURE END USER ANALYSIS, 2025–2034, (USD MILLION)
FIGURE 64 WESTERN EUROPE AI IN PROPTECH SYSTEM CURRENT AND FUTURE MARKET VOLUME SHARE REGIONAL ANALYSIS, 2025–2034, (USD MILLION)
FIGURE 65 GERMANY AI IN PROPTECH SYSTEM CURRENT AND FUTURE TYPE ANALYSIS, 2025–2034, (USD MILLION)
FIGURE 66 GERMANY AI IN PROPTECH SYSTEM CURRENT AND FUTURE END USER ANALYSIS, 2025–2034, (USD MILLION)
FIGURE 67 FRANCE AI IN PROPTECH SYSTEM CURRENT AND FUTURE TYPE ANALYSIS, 2025–2034, (USD MILLION)
FIGURE 68 FRANCE AI IN PROPTECH SYSTEM CURRENT AND FUTURE END USER ANALYSIS, 2025–2034, (USD MILLION)
FIGURE 69 UK AI IN PROPTECH SYSTEM CURRENT AND FUTURE TYPE ANALYSIS, 2025–2034, (USD MILLION)
FIGURE 70 UK AI IN PROPTECH SYSTEM CURRENT AND FUTURE END USER ANALYSIS, 2025–2034, (USD MILLION)
FIGURE 71 SPAIN AI IN PROPTECH SYSTEM CURRENT AND FUTURE TYPE ANALYSIS, 2025–2034, (USD MILLION)
FIGURE 72 SPAIN AI IN PROPTECH SYSTEM CURRENT AND FUTURE END USER ANALYSIS, 2025–2034, (USD MILLION)
FIGURE 73 ITALY AI IN PROPTECH SYSTEM CURRENT AND FUTURE TYPE ANALYSIS, 2025–2034, (USD MILLION)
FIGURE 74 ITALY AI IN PROPTECH SYSTEM CURRENT AND FUTURE END USER ANALYSIS, 2025–2034, (USD MILLION)
FIGURE 75 REST OF WESTERN EUROPE AI IN PROPTECH SYSTEM CURRENT AND FUTURE TYPE ANALYSIS, 2025–2034, (USD MILLION)
FIGURE 76 REST OF WESTERN EUROPE AI IN PROPTECH SYSTEM CURRENT AND FUTURE END USER ANALYSIS, 2025–2034, (USD MILLION)
FIGURE 77 EAST ASIA AND PACIFIC AI IN PROPTECH SYSTEM CURRENT AND FUTURE MARKET VOLUME SHARE REGIONAL ANALYSIS, 2025–2034, (USD MILLION)
FIGURE 78 CHINA AI IN PROPTECH SYSTEM CURRENT AND FUTURE TYPE ANALYSIS, 2025–2034, (USD MILLION)
FIGURE 79 CHINA AI IN PROPTECH SYSTEM CURRENT AND FUTURE END USER ANALYSIS, 2025–2034, (USD MILLION)
FIGURE 80 JAPAN AI IN PROPTECH SYSTEM CURRENT AND FUTURE TYPE ANALYSIS, 2025–2034, (USD MILLION)
FIGURE 81 JAPAN AI IN PROPTECH SYSTEM CURRENT AND FUTURE END USER ANALYSIS, 2025–2034, (USD MILLION)
FIGURE 82 AUSTRALIA AI IN PROPTECH SYSTEM CURRENT AND FUTURE TYPE ANALYSIS, 2025–2034, (USD MILLION)
FIGURE 83 AUSTRALIA AI IN PROPTECH SYSTEM CURRENT AND FUTURE END USER ANALYSIS, 2025–2034, (USD MILLION)
FIGURE 84 CAMBODIA AI IN PROPTECH SYSTEM CURRENT AND FUTURE TYPE ANALYSIS, 2025–2034, (USD MILLION)
FIGURE 85 CAMBODIA AI IN PROPTECH SYSTEM CURRENT AND FUTURE END USER ANALYSIS, 2025–2034, (USD MILLION)
FIGURE 86 FIJI AI IN PROPTECH SYSTEM CURRENT AND FUTURE TYPE ANALYSIS, 2025–2034, (USD MILLION)
FIGURE 87 FIJI AI IN PROPTECH SYSTEM CURRENT AND FUTURE END USER ANALYSIS, 2025–2034, (USD MILLION)
FIGURE 88 INDONESIA AI IN PROPTECH SYSTEM CURRENT AND FUTURE TYPE ANALYSIS, 2025–2034, (USD MILLION)
FIGURE 89 INDONESIA AI IN PROPTECH SYSTEM CURRENT AND FUTURE END USER ANALYSIS, 2025–2034, (USD MILLION)
FIGURE 90 SOUTH KOREA AI IN PROPTECH SYSTEM CURRENT AND FUTURE TYPE ANALYSIS, 2025–2034, (USD MILLION)
FIGURE 91 SOUTH KOREA AI IN PROPTECH SYSTEM CURRENT AND FUTURE END USER ANALYSIS, 2025–2034, (USD MILLION)
FIGURE 92 REST OF EAST ASIA AND PACIFIC AI IN PROPTECH SYSTEM CURRENT AND FUTURE TYPE ANALYSIS, 2025–2034, (USD MILLION)
FIGURE 93 REST OF EAST ASIA AND PACIFIC AI IN PROPTECH SYSTEM CURRENT AND FUTURE END USER ANALYSIS, 2025–2034, (USD MILLION)
FIGURE 94 SEA AND SOUTH ASIA AI IN PROPTECH SYSTEM CURRENT AND FUTURE MARKET VOLUME SHARE REGIONAL ANALYSIS, 2025–2034, (USD MILLION)
FIGURE 95 BANGLADESH AI IN PROPTECH SYSTEM CURRENT AND FUTURE TYPE ANALYSIS, 2025–2034, (USD MILLION)
FIGURE 96 BANGLADESH AI IN PROPTECH SYSTEM CURRENT AND FUTURE END USER ANALYSIS, 2025–2034, (USD MILLION)
FIGURE 97 NEW ZEALAND AI IN PROPTECH SYSTEM CURRENT AND FUTURE TYPE ANALYSIS, 2025–2034, (USD MILLION)
FIGURE 98 NEW ZEALAND AI IN PROPTECH SYSTEM CURRENT AND FUTURE END USER ANALYSIS, 2025–2034, (USD MILLION)
FIGURE 99 INDIA AI IN PROPTECH SYSTEM CURRENT AND FUTURE TYPE ANALYSIS, 2025–2034, (USD MILLION)
FIGURE 100 INDIA AI IN PROPTECH SYSTEM CURRENT AND FUTURE END USER ANALYSIS, 2025–2034, (USD MILLION)
FIGURE 101 SINGAPORE AI IN PROPTECH SYSTEM CURRENT AND FUTURE TYPE ANALYSIS, 2025–2034, (USD MILLION)
FIGURE 102 SINGAPORE AI IN PROPTECH SYSTEM CURRENT AND FUTURE END USER ANALYSIS, 2025–2034, (USD MILLION)
FIGURE 103 THAILAND AI IN PROPTECH SYSTEM CURRENT AND FUTURE TYPE ANALYSIS, 2025–2034, (USD MILLION)
FIGURE 104 THAILAND AI IN PROPTECH SYSTEM CURRENT AND FUTURE END USER ANALYSIS, 2025–2034, (USD MILLION)
FIGURE 105 TAIWAN AI IN PROPTECH SYSTEM CURRENT AND FUTURE TYPE ANALYSIS, 2025–2034, (USD MILLION)
FIGURE 106 TAIWAN AI IN PROPTECH SYSTEM CURRENT AND FUTURE END USER ANALYSIS, 2025–2034, (USD MILLION)
FIGURE 107 MALAYSIA AI IN PROPTECH SYSTEM CURRENT AND FUTURE TYPE ANALYSIS, 2025–2034, (USD MILLION)
FIGURE 108 MALAYSIA AI IN PROPTECH SYSTEM CURRENT AND FUTURE END USER ANALYSIS, 2025–2034, (USD MILLION)
FIGURE 109 REST OF SEA AND SOUTH ASIA AI IN PROPTECH SYSTEM CURRENT AND FUTURE TYPE ANALYSIS, 2025–2034, (USD MILLION)
FIGURE 110 REST OF SEA AND SOUTH ASIA AI IN PROPTECH SYSTEM CURRENT AND FUTURE END USER ANALYSIS, 2025–2034, (USD MILLION)
FIGURE 111 MIDDLE EAST AND AFRICA AI IN PROPTECH SYSTEM CURRENT AND FUTURE MARKET VOLUME SHARE REGIONAL ANALYSIS, 2025–2034, (USD MILLION)
FIGURE 112 GCC COUNTRIES AI IN PROPTECH SYSTEM CURRENT AND FUTURE TYPE ANALYSIS, 2025–2034, (USD MILLION)
FIGURE 113 GCC COUNTRIES AI IN PROPTECH SYSTEM CURRENT AND FUTURE END USER ANALYSIS, 2025–2034, (USD MILLION)
FIGURE 114 SAUDI ARABIA AI IN PROPTECH SYSTEM CURRENT AND FUTURE TYPE ANALYSIS, 2025–2034, (USD MILLION)
FIGURE 115 SAUDI ARABIA AI IN PROPTECH SYSTEM CURRENT AND FUTURE END USER ANALYSIS, 2025–2034, (USD MILLION)
FIGURE 116 UAE AI IN PROPTECH SYSTEM CURRENT AND FUTURE TYPE ANALYSIS, 2025–2034, (USD MILLION)
FIGURE 117 UAE AI IN PROPTECH SYSTEM CURRENT AND FUTURE END USER ANALYSIS, 2025–2034, (USD MILLION)
FIGURE 118 BAHRAIN AI IN PROPTECH SYSTEM CURRENT AND FUTURE TYPE ANALYSIS, 2025–2034, (USD MILLION)
FIGURE 119 BAHRAIN AI IN PROPTECH SYSTEM CURRENT AND FUTURE END USER ANALYSIS, 2025–2034, (USD MILLION)
FIGURE 120 KUWAIT AI IN PROPTECH SYSTEM CURRENT AND FUTURE TYPE ANALYSIS, 2025–2034, (USD MILLION)
FIGURE 121 KUWAIT AI IN PROPTECH SYSTEM CURRENT AND FUTURE END USER ANALYSIS, 2025–2034, (USD MILLION)
FIGURE 122 OMAN AI IN PROPTECH SYSTEM CURRENT AND FUTURE TYPE ANALYSIS, 2025–2034, (USD MILLION)
FIGURE 123 OMAN AI IN PROPTECH SYSTEM CURRENT AND FUTURE END USER ANALYSIS, 2025–2034, (USD MILLION)
FIGURE 124 QATAR AI IN PROPTECH SYSTEM CURRENT AND FUTURE TYPE ANALYSIS, 2025–2034, (USD MILLION)
FIGURE 125 QATAR AI IN PROPTECH SYSTEM CURRENT AND FUTURE END USER ANALYSIS, 2025–2034, (USD MILLION)
FIGURE 126 EGYPT AI IN PROPTECH SYSTEM CURRENT AND FUTURE TYPE ANALYSIS, 2025–2034, (USD MILLION)
FIGURE 127 EGYPT AI IN PROPTECH SYSTEM CURRENT AND FUTURE END USER ANALYSIS, 2025–2034, (USD MILLION)
FIGURE 128 NIGERIA AI IN PROPTECH SYSTEM CURRENT AND FUTURE TYPE ANALYSIS, 2025–2034, (USD MILLION)
FIGURE 129 NIGERIA AI IN PROPTECH SYSTEM CURRENT AND FUTURE END USER ANALYSIS, 2025–2034, (USD MILLION)
FIGURE 130 SOUTH AFRICA AI IN PROPTECH SYSTEM CURRENT AND FUTURE TYPE ANALYSIS, 2025–2034, (USD MILLION)
FIGURE 131 SOUTH AFRICA AI IN PROPTECH SYSTEM CURRENT AND FUTURE END USER ANALYSIS, 2025–2034, (USD MILLION)
FIGURE 132 ISRAEL AI IN PROPTECH SYSTEM CURRENT AND FUTURE TYPE ANALYSIS, 2025–2034, (USD MILLION)
FIGURE 133 ISRAEL AI IN PROPTECH SYSTEM CURRENT AND FUTURE END USER ANALYSIS, 2025–2034, (USD MILLION)
FIGURE 134 REST OF MEA AI IN PROPTECH SYSTEM CURRENT AND FUTURE TYPE ANALYSIS, 2025–2034, (USD MILLION)
FIGURE 135 REST OF MEA AI IN PROPTECH SYSTEM CURRENT AND FUTURE END USER ANALYSIS, 2025–2034, (USD MILLION)
FIGURE 136 U. S. MARKET SHARE ANALYSIS BY TYPE (2024)
FIGURE 137 U. S. MARKET SHARE ANALYSIS BY END USER (2024)
FIGURE 138 CANADA MARKET SHARE ANALYSIS BY TYPE (2024)
FIGURE 139 CANADA MARKET SHARE ANALYSIS BY END USER (2024)
FIGURE 140 MEXICO MARKET SHARE ANALYSIS BY TYPE (2024)
FIGURE 141 MEXICO MARKET SHARE ANALYSIS BY END USER (2024)
FIGURE 142 CHINA MARKET SHARE ANALYSIS BY TYPE (2024)
FIGURE 143 CHINA MARKET SHARE ANALYSIS BY END USER (2024)
FIGURE 144 JAPAN MARKET SHARE ANALYSIS BY TYPE (2024)
FIGURE 145 JAPAN MARKET SHARE ANALYSIS BY END USER (2024)
FIGURE 146 INDIA MARKET SHARE ANALYSIS BY TYPE (2024)
FIGURE 147 INDIA MARKET SHARE ANALYSIS BY END USER (2024)
FIGURE 148 SOUTH KOREA MARKET SHARE ANALYSIS BY TYPE (2024)
FIGURE 149 SOUTH KOREA MARKET SHARE ANALYSIS BY END USER (2024)
FIGURE 150 SAUDI ARABIA MARKET SHARE ANALYSIS BY TYPE (2024)
FIGURE 151 SAUDI ARABIA MARKET SHARE ANALYSIS BY END USER (2024)
FIGURE 152 UAE MARKET SHARE ANALYSIS BY TYPE (2024)
FIGURE 153 UAE MARKET SHARE ANALYSIS BY END USER (2024)
FIGURE 154 EGYPT MARKET SHARE ANALYSIS BY TYPE (2024)
FIGURE 155 EGYPT MARKET SHARE ANALYSIS BY END USER (2024)
FIGURE 156 NIGERIA MARKET SHARE ANALYSIS BY TYPE (2024)
FIGURE 157 NIGERIA MARKET SHARE ANALYSIS BY END USER (2024)
FIGURE 158 SOUTH AFRICA MARKET SHARE ANALYSIS BY TYPE (2024)
FIGURE 159 SOUTH AFRICA MARKET SHARE ANALYSIS BY END USER (2024)
FIGURE 160 GERMANY MARKET SHARE ANALYSIS BY TYPE (2024)
FIGURE 161 GERMANY MARKET SHARE ANALYSIS BY END USER (2024)
FIGURE 162 FRANCE MARKET SHARE ANALYSIS BY TYPE (2024)
FIGURE 163 FRANCE MARKET SHARE ANALYSIS BY END USER (2024)
FIGURE 164 UK MARKET SHARE ANALYSIS BY TYPE (2024)
FIGURE 165 UK MARKET SHARE ANALYSIS BY END USER (2024)
FIGURE 166 SPAIN MARKET SHARE ANALYSIS BY TYPE (2024)
FIGURE 167 SPAIN MARKET SHARE ANALYSIS BY END USER (2024)
FIGURE 168 ITALY MARKET SHARE ANALYSIS BY TYPE (2024)
FIGURE 169 ITALY MARKET SHARE ANALYSIS BY END USER (2024)
FIGURE 170 BRAZIL MARKET SHARE ANALYSIS BY TYPE (2024)
FIGURE 171 BRAZIL MARKET SHARE ANALYSIS BY END USER (2024)
FIGURE 172 ARGENTINA MARKET SHARE ANALYSIS BY TYPE (2024)
FIGURE 173 ARGENTINA MARKET SHARE ANALYSIS BY END USER (2024)
FIGURE 174 COLUMBIA MARKET SHARE ANALYSIS BY TYPE (2024)
FIGURE 175 COLUMBIA MARKET SHARE ANALYSIS BY END USER (2024)
FIGURE 176 GLOBAL AI IN PROPTECH SYSTEM CURRENT AND FUTURE MARKET KEY COUNTRY LEVEL ANALYSIS, 2024–2034, (USD MILLION)
FIGURE 177 FINANCIAL OVERVIEW:
Key Player Analysis
Zillow Group: Zillow has evolved from a listings marketplace into a transaction platform spanning search, touring, new construction, rentals, and mortgages. The company surpassed 200 million unique monthly users and is embedding AI across the stack—natural-language search, AI-assisted agent tools, and immersive media—to increase conversion and monetization. In 2025, Zillow introduced AI-powered Virtual Staging within its premium “Showcase” listings alongside interactive 3D floor plans and SkyTour flyovers, deepening listing engagement for brokers and builders. Financially, Q2-2025 revenue grew across segments, with Rentals up 36% year over year and Mortgages up 41%, supporting full-year mid-teens growth guidance. Strategic differentiation centers on responsible AI (including an open-source Fair Housing classifier), scaled distribution, and tighter integration of media, lead gen, and financing.
Redfin Corporation: Redfin continues to lean into conversational and generative AI to compress the home-search journey. Its “Ask Redfin” assistant—rolled out nationwide—answers listing and neighborhood questions in real time, building on the firm’s earlier ChatGPT plug-in and a broader data publishing strategy via its market data center. In 2025, Redfin agreed to be acquired by Rocket Companies in a $1.75B all-stock deal, aiming to pair Redfin’s traffic and agent network with Rocket’s mortgage origination and servicing engine; Rocket targets material cost savings and incremental revenue synergies as the integration progresses. While Redfin has streamlined operations (including targeted layoffs and a rentals restructuring), the combined platform’s AI-driven lead routing and end-to-end financing could expand attach rates and improve unit economics through 2026–2027.
Compass: Compass differentiates through a unified agent platform and “Compass AI,” a voice-enabled assistant that drafts outreach, builds listing presentations, and automates marketing workflows—designed to lift agent productivity and speed. The company posted record Q2-2025 results, including 97.5% quarterly principal-agent retention and market share above 6%, reflecting platform stickiness and share gains. In September 2025, Compass announced an all-stock acquisition of Anywhere Real Estate (Century 21, Coldwell Banker, Sotheby’s, etc.), a move that would combine ~340,000 real-estate professionals and create a $10B enterprise by value; management frames the deal as scale plus services (title, escrow, relocation) to diversify revenue and spread AI development costs across a larger base. Execution will hinge on realizing cost synergies and integrating brand portfolios without diluting agent productivity gains from Compass AI.
Roof AI: Montreal-based Roof AI provides an AI sales assistant that personalizes website, SMS, and messenger interactions to capture and nurture leads across brokerage, mortgage, relocation, and recruiting workflows. The platform—now marketed as “Roof Pro” and powered by OpenAI models—integrates with MLS feeds and brokerage systems to route inquiries, qualify prospects, and trigger agent follow-ups in real time. Differentiation comes from a focused go-to-market with mid-to-large U.S. brokerages (e.g., RE/MAX affiliates, Berkshire Hathaway HomeServices network members) and a product roadmap centered on automated conversation design and conversion analytics. For customers, the value proposition is faster response times and higher lead-to-appointment rates without adding headcount—an attractive lever amid leaner 2025 sales teams.
Market Key Players
Reonomy
Realtor.com
Skyline AI
Jones Lang LaSalle Incorporated
HouseCanary, Inc.
Zillow Group
Apartment List
Compass
Redfin Corporation
Roof AI
Other Key Players
Driver:
AI-Powered Efficiency
As of 2025, real-estate portfolios are under pressure to deliver measurable efficiency, decarbonization, and yield improvements—conditions that favor automation at scale. AI-enabled platforms are now embedded across leasing, valuation, and facilities operations, with cloud-first deployments accounting for roughly seven in ten new implementations. At the asset level, predictive maintenance and AI-driven controls typically cut maintenance expense by 10–20% and reduce energy consumption by 5–15%, while generative AI can automate 60–80% of lease-clause extraction and routine tenant communications. These tangible gains underpin the market’s ~22–23% CAGR through 2034 and are attracting enterprise budgets even amid tighter capital markets.
Automation Reshaping Real Estate
Strategically, the combination of IoT data streams, computer vision, and interoperable APIs is unlocking portfolio-wide analytics for owners and operators. Leading integrators and advisors (e.g., JLL, CBRE) are standardizing AI-augmented underwriting and asset performance dashboards, while building-tech vendors (e.g., Siemens, Honeywell, Schneider Electric) are integrating AI natively into BMS platforms. The result is faster decision velocity, tighter OPEX control, and improved NOI resilience—key differentiators in competitive leasing markets.
Restraint:
Integration, Data Governance, and High TCO Slow Scaling
The primary brakes on adoption in 2025 are integration complexity, data governance, and total cost of ownership. Fragmented data models across BMS/CAFM/ERP stacks and uneven data quality raise implementation risk, often adding 10–15% to project costs and extending enterprise rollouts by 3–6 months. Heightened regulatory scrutiny around privacy, cross-border data transfer, and model explainability further elongates procurement cycles, while a shortage of MLOps and building-data engineering talent constrains the pace of multi-site scale-up. Without strong data stewardship and model risk management, enterprises risk biased outputs, compliance gaps, and stranded pilots.
Opportunity:
High-ROI Retrofits
The most attractive upside lies in commercial and industrial retrofits, where AI-linked energy and maintenance optimization can deliver rapid paybacks and unlock green-finance incentives. These segments are poised to outgrow the overall market by 2–3 percentage points annually from 2025 onward; capturing 30–35% of incremental spend could create >USD 40–50 billion in new revenue pools by 2034. Parallel opportunities exist in interoperable data layers (common data models, ontology services) and AI-driven transaction workflows that compress diligence and closing timelines—critical for investors managing larger, cross-border portfolios.
APAC Smart City Programs Unlock Growth
Asia Pacific is the geographic catalyst, supported by smart-city pipelines and code-driven efficiency upgrades in China, India, Southeast Asia, and Australia. With multiple markets tracking high-20s CAGRs, vendors that localize models, meet data-residency requirements, and partner with regional systems integrators will gain outsized share. In North America and Europe, regulatory-driven retrofits and corporate net-zero roadmaps provide a deep, recurring revenue base for outcome-based service models.
Trend:
Shift Toward AI-Native Platforms, Digital Twins
2025 marks a pivot from pilots to platformization. Generative AI “co-pilots” for asset managers, digital twins fused with physics-informed models, and edge AI for computer vision (access control, safety, occupancy) are moving into production across multi-asset portfolios. Vendors are shipping model observability, bias testing, and lineage tracking as standard features, while open, API-first ecosystems enable plug-and-play analytics across leasing, accounting, and building systems.
Outcome-Based Models
Concurrently, hybrid architectures—cloud for training/orchestration, on-prem or edge for low-latency inference—are becoming the default in mission-critical facilities. Procurement increasingly favors outcome-backed contracts (e.g., uptime SLAs, verified kWh savings), aligning vendor incentives with performance. Together, these trends are reshaping competitive dynamics toward platforms that combine strong governance with measurable, asset-level ROI.
Recent Developments
Dec 2024 – CoStar Group: Hosted its Investor Day (Dec 5), detailing marketplace, data, and AI roadmaps for Homes.com, Apartments.com, and commercial platforms; management signaled continued investment in digital twin and computer-vision capabilities. The event preceded FY2024 results showing revenue of USD 2.74 billion (+11% YoY), reinforcing balance-sheet capacity for M&A and AI R&D. Strategic impact: strengthens CoStar’s position to fuse listings scale with AI-rich media and analytics across residential and commercial workflows.
Feb 2025 – CoStar Group: Completed its acquisition of Matterport (Feb 28), integrating the leading 3D digital twin provider—whose library spans ~50 billion sq ft—into CoStar’s marketplaces and data platforms. Strategic impact: accelerates AI/computer-vision features (e.g., automated measurements, scene understanding) across listings, underwriting, and facilities use cases, deepening differentiation versus portals and data providers.
Apr 2025 – Honeywell: Launched an AI-assisted automation platform for building operations (Apr 2), and separately unveiled an AI-powered building management solution (Jun 10) with early adopters Verizon and Vanderbilt University; Honeywell’s 2025 research also found ~84% of commercial building decision-makers plan to increase AI use. Strategic impact: positions Honeywell as a systems-layer orchestrator, embedding AI into BMS to drive measurable OPEX and energy savings for enterprise portfolios.
Jul 2025 – Rocket Companies / Redfin: Rocket closed its all-stock acquisition of Redfin (Jul 1) following a March agreement valued at USD 1.75 billion; the combined platform links Redfin’s high-intent traffic and agent network with Rocket Mortgage’s origination/servicing engine. Strategic impact: creates an end-to-end, AI-enabled home-search-to-financing funnel that can raise attach rates and lower customer acquisition costs.
Sep 2025 – Zillow Group: Introduced AI-powered Virtual Staging within its premium Showcase listings (Sep 10), enabling real-time, style-selectable restaging of listing photos to increase shopper engagement and agent differentiation. Strategic impact: enhances Zillow’s media moat and supports higher conversion and monetization across its listings, rentals, and new-construction businesses.
Sep 2025 – Compass / Anywhere Real Estate: Announced an all-stock deal for Compass to acquire Anywhere, valuing the target at ~USD 1.5–1.6 billion and creating a network of ~340,000 agents with an estimated ~18% U.S. market share; management guided to material cost synergies and cross-sell opportunities in title/escrow and relocation. Strategic impact: marks major brokerage consolidation aimed at scaling a unified, AI-augmented agent platform and spreading product development costs across a larger base.