AI in Remote Patient Monitoring Market Size | 24.8% CAGR
Global AI in Remote Patient Monitoring Market Size, Share & Analysis By Monitoring Device Type (Wearable, Implantable, Stationary), By Component (Hardware, Software, Services), By Technology (Machine Learning, Natural Language Processing, Computer Vision), By Application (Chronic Disease Management, Geriatric Care Management, Sleep Apnea Monitoring, Fitness Monitoring) Industry Dynamics & Forecast 2025–2034
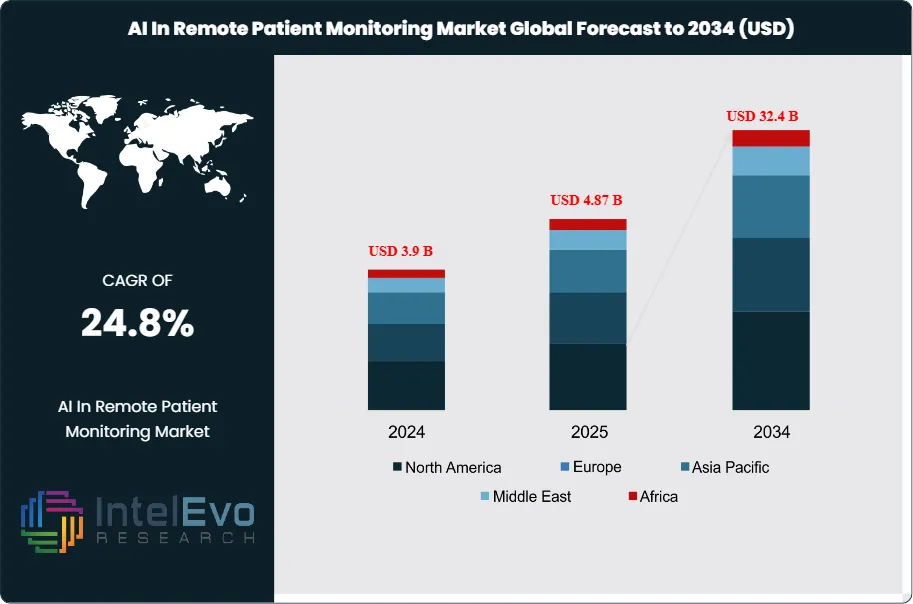
The Artificial Intelligence (AI) in Remote Patient Monitoring (RPM) Market is valued at USD 3.9 billion in 2024 and is projected to reach approximately USD 32.4 billion by 2034, growing at a powerful CAGR of around 24.8% from 2025–2034. The surge reflects rising adoption of AI-enabled wearables, predictive health alerts, and chronic-care monitoring platforms across global healthcare systems. With hospitals prioritizing virtual-first models and payers expanding reimbursement for continuous monitoring, AI-driven RPM is becoming a cornerstone of preventive and personalized care. Increasing integration of digital biomarkers, real-time analytics, and edge-AI devices is further driving visibility and engagement on professional and social platforms.
From a niche adjunct to telehealth pilots, AI-enabled RPM has evolved into a core capability for hospital-at-home and chronic disease management programs. The market’s expansion reflects a clear shift from episodic, facility-based care toward continuous, data-driven models: connected wearables, home diagnostics, and ambient sensors now generate high-frequency vitals and behavioral data that machine-learning models translate into risk scores, early-warning alerts, and personalized interventions. As a result, health systems report lower avoidable admissions and improved adherence, while payers see pathway-level cost containment—key in a period when healthcare expenditure growth is outpacing GDP in many economies.
Demand is anchored in the rising chronic disease burden and aging populations. Diabetes alone affects roughly 465 million adults worldwide, and cardiometabolic conditions account for a growing share of hospital utilization—both strong use cases for AI-triaged monitoring, medication optimization, and complications prevention. On the supply side, falling sensor costs, maturing cloud/edge architectures, and interoperability frameworks (e.g., FHIR-based data exchange) are removing integration friction, while the expansion of CPT/DRG-linked reimbursement in developed markets is normalizing RPM as a billable service line. Nevertheless, adoption faces constraints: uneven broadband coverage, clinician workflow fatigue, privacy and cybersecurity risks, and regulatory complexity spanning software-as-a-medical-device approvals, model transparency, and data residency. Algorithmic bias and explainability remain board-level concerns, especially as models scale across diverse populations.
Technological innovation is accelerating. Multimodal AI combines photoplethysmography, ECG, and activity streams to improve predictive accuracy; edge inference cuts latency for fall detection and cardiac events; and generative AI supports patient messaging, triage summarization, and care-plan personalization. Digital biomarkers for heart failure, COPD, and post-operative recovery are moving from validation to deployment, while anomaly-detection pipelines reduce alarm fatigue by double-digit percentages.
Regionally, North America leads on revenue—supported by payer incentives and mature telehealth infrastructure—while Western Europe advances under value-based care and stringent data-protection frameworks. Asia–Pacific is the fastest-growing investment hotspot, buoyed by large chronic disease cohorts, government digital-health strategies, and local device ecosystems; India and China are notable for scale economics and rapid mobile adoption. Emerging opportunities include remote oncology support, maternal health, and perioperative pathways, where investors should watch for platforms that pair clinically validated algorithms with interoperable data layers and outcomes-based contracting.
Key Takeaways
Market Growth: The Global AI in Remote Patient Monitoring (RPM) market was USD 3.9 billion in 2024 and is projected to reach ~ USD 32.4 billion by 2034, reflecting a 24.8% CAGR as providers shift from episodic to continuous, data-driven care and as payers scale reimbursement-linked RPM programs.
Offering: Managed Monitoring Services lead revenue with an estimated ~50%+ share, propelled by per-patient, per-month fees that bundle devices, dashboards, and clinical oversight; software subscriptions and analytics platforms are the fastest-growing layer as AI pipelines move from pilot to enterprise rollout.
Application: Cardiometabolic management (cardiac conditions + diabetes) accounts for the largest application share (≈40%), underpinned by high readmission costs and a global diabetes burden of ~465 million adults; COPD and post-acute recovery pathways are gaining traction with double-digit annual adoption.
End User: Providers (health systems and home-health networks) capture the majority of deployments due to integration with EHR workflows and hospital-at-home models, while payers accelerate funding for risk-based members, catalyzing multiyear RPM contracts and outcomes-based payments.
Driver: Rising chronic disease prevalence and aging populations expand the monitored cohort, while AI models that triage risk and personalize interventions deliver measurable impact—commonly reporting double-digit reductions in avoidable admissions and improved medication adherence in year one.
Restraint: Data governance and workflow burden remain binding constraints; compliance for SaMD, HIPAA/GDPR, and model validation often adds 6–12 months to procurement cycles, and alarm fatigue from legacy rules engines can depress clinician adoption without AI-based anomaly filtering.
Opportunity: Asia–Pacific represents the standout growth opportunity (often >30% CAGR potential) as large patient pools, national digital-health programs, and cost-optimized device ecosystems support scale; high-value niches include heart failure, COPD, perioperative monitoring, and oncology supportive care.
Trend: Multimodal and edge AI are moving mainstream—combining PPG/ECG, activity, and contextual signals for earlier decompensation detection—while generative AI increasingly automates patient messaging, triage summarization, and care-plan personalization, cutting manual touchpoints per patient.
Technology: Interoperability via FHIR, secure cloud/edge architectures, and continuous model monitoring are becoming table stakes; vendors showcasing explainability, bias testing, and real-world evidence are winning enterprise RFPs and commanding premium pricing.
Regional Analysis: North America leads on revenue (≈40–45%) with mature reimbursement and telehealth infrastructure; Western Europe follows under value-based care and stringent data-protection regimes; Asia–Pacific is the fastest-growing investment hotspot, with India and China driving volume through mobile-first adoption and local manufacturing.
Type Analysis
In 2025, AI-enabled remote patient monitoring (RPM) is anchored by three device classes—wearable, implantable, and stationary—each serving distinct acuity tiers. Wearables remain the revenue leader after capturing 61.2% share in 2023, supported by continuous collection of heart rate, blood pressure, SpO₂, rhythm, and glucose signals that feed real-time risk scoring and adaptive care plans. Tier-1 OEMs continue to expand medical-grade features—e.g., Fitbit’s Sense/Versa/Inspire lines adding on-wrist SpO₂ and advanced heart-rate analytics—improving adherence and enabling earlier intervention at scale.
Implantables (e.g., insertable cardiac monitors, long-wear biosensors) are a smaller installed base but post the fastest unit-value growth as payers back monitoring in high-risk cohorts where early decompensation detection materially lowers readmissions. Stationary devices (home hubs, BP cuffs, scales, spirometers) sustain adoption in geriatric and post-acute settings, increasingly paired with edge inference to filter noise and curb false alerts. The mix shift through 2030 favors multi-sensor kits that blend wearable convenience with stationary reliability for longitudinal signal fidelity.
Component Analysis
Software is the core value layer, accounting for 75.3% of market revenue in 2023 and retaining primacy in 2025 as providers standardize on SaaS platforms for data orchestration, predictive analytics, clinician dashboards, and alert routing. Platforms such as Philips IntelliSpace Corsium exemplify how real-time streaming, cohort stratification, and decision support convert raw device data into measurable outcomes and billable pathways.
Hardware growth remains steady but increasingly commoditized as sensor costs fall and connectivity (BLE/5G) becomes ubiquitous. Services—spanning managed monitoring, patient onboarding/logistics, and clinician oversight—represent a rising share of new contracts, particularly in hospital-at-home programs; many providers prefer per-member-per-month bundles that combine devices, software licenses, and 24/7 clinical escalation into outcomes-linked SLAs.
Technology Analysis
Machine learning (ML) is the backbone technology with a 53.9% share in 2023, and it continues to dominate 2025 deployments for anomaly detection, risk scoring, and personalized titration. Multivariate ML models fuse vitals, activity, and context to flag early decompensation and typically drive double-digit reductions in non-actionable alerts once tuned on local data.
Natural language processing (NLP) converts patient-reported messages and clinician notes into structured insights, accelerating triage and closing care gaps, while computer vision (CV) supports respiratory effort assessment and wound/edema tracking via camera feeds. “Others” include reinforcement learning for dosage optimization and privacy-preserving techniques (federated learning, differential privacy) that maintain accuracy while meeting data-residency and security requirements.
Application Analysis
Chronic disease management is the anchor use case, holding 55.2% share in 2023 and extending leadership through 2025 as diabetes, cardiovascular disease, COPD, and hypertension programs adopt AI-triaged monitoring to reduce avoidable admissions and improve adherence. With roughly ~465 million adults living with diabetes globally, continuous glucose monitors, cardiac rhythm analytics, and BP trend models are integral to proactive, home-based care.
Adjacent growth pockets include geriatric care management (fall detection, frailty indexing, medication reminders) and sleep apnea monitoring, where home diagnostics and AI-aided PAP adherence raise long-term efficacy. Fitness monitoring remains a feeder segment: while less reimbursed, it broadens the funnel for clinical-grade enrollment as algorithms graduate from wellness to regulated decision support.
Regional Analysis
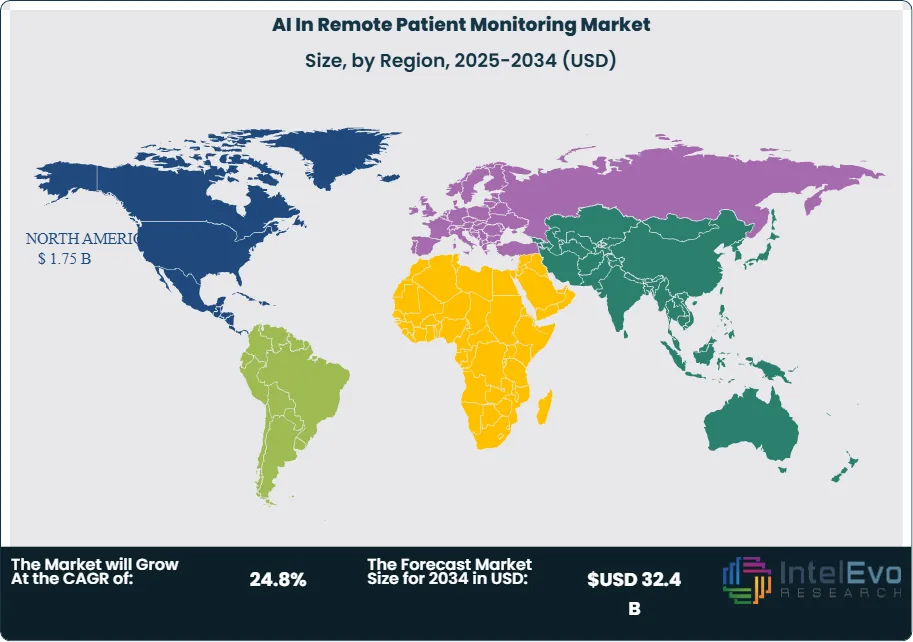
North America leads on revenue (≈40–45% share) in 2025, underpinned by established RPM reimbursement frameworks, high EHR interoperability, and scale programs across integrated delivery networks. Europe (≈20–25%) advances under value-based care and stringent data-protection regimes that favor vendors with explainability and post-market surveillance baked into SaMD lifecycles.
Asia Pacific is the fastest-growing region (often >30% CAGR outlook), propelled by large chronic-disease cohorts, government-backed digital-health roadmaps, and cost-optimized device ecosystems; China and India drive volume via mobile-first participation and local manufacturing. Latin America and Middle East & Africa remain emerging but increasingly active, with national telehealth initiatives and public-private pilots focusing on cardiometabolic and maternal-child health; scaling hinges on broadband availability, clinician capacity, and procurement models that bundle devices with managed services.
By Monitoring Device Type (Wearable, Implantable, Stationary), By Component (Hardware, Software, Services), By Technology (Machine Learning, Natural Language Processing, Computer Vision, Others), By Application (Chronic Disease Management, Geriatric Care Management, Sleep Apnea Monitoring, Fitness Monitoring, Other)
Research Methodology
Primary Research- 100 Interviews of Stakeholders
Secondary Research
Desk Research
Regional scope
North America (United States, Canada, Mexico)
Latin America (Brazil, Argentina, Columbia)
East Asia And Pacific (China, Japan, South Korea, Australia, Cambodia, Fiji, Indonesia)
Sea And South Asia (India, Singapore, Thailand, Taiwan, Malaysia)
Eastern Europe (Poland, Russia, Czech Republic, Romania)
Western Europe (Germany, U.K., France, Spain, Itlay)
Middle East & Africa (GCC Countries, Egypt, Nigeria, South Africa, Israel)
Competitive Landscape
Medasense Biometrics Ltd, Sensely Inc., AICure LLC, International Business Machines Corp. (IBM), Modernizing Machine, Inc., BPG Bio, Inc., Atomwise Inc., Caption Health Inc., Nuance Communications, Ferrum Health
Customization Scope
Customization for segments, region/country-level will be provided. Moreover, additional customization can be done based on the requirements.
Pricing and Purchase Options
Avail customized purchase options to meet your exact research needs. We have three licenses to opt for: Single User License, Multi-User License (Up to 5 Users), Corporate Use License (Unlimited User and Printable PDF).
TABLE OF CONTENTS
1. EXECUTIVE SUMMARY
1.1. MARKET SNAPSHOT
1.2. KEY FINDINGS & INSIGHTS
1.3. ANALYST RECOMMENDATIONS
1.4. FUTURE OUTLOOK
2. RESEARCH METHODOLOGY
2.1. MARKET DEFINITION & SCOPE
2.2. RESEARCH OBJECTIVES: PRIMARY & SECONDARY DATA SOURCES
2.3. DATA COLLECTION SOURCES
2.3.1. COVERAGE OF 100+ PRIMARY RESEARCH/CONSULTATION CALLS WITH INDUSTRY STAKEHOLDERS
FIGURE 17 NORTH AMERICA AI IN REMOTE PATIENT MONITORING CURRENT AND FUTURE TYPE ANALYSIS, 2025–2034, (USD MILLION)
FIGURE 18 NORTH AMERICA AI IN REMOTE PATIENT MONITORING CURRENT AND FUTURE END USER ANALYSIS, 2025–2034, (USD MILLION)
FIGURE 19 MARKET SHARE BY COUNTRY
FIGURE 20 LATIN AMERICA AI IN REMOTE PATIENT MONITORING CURRENT AND FUTURE TYPE ANALYSIS, 2025–2034, (USD MILLION)
FIGURE 21 LATIN AMERICA AI IN REMOTE PATIENT MONITORING CURRENT AND FUTURE END USER ANALYSIS, 2025–2034, (USD MILLION)
FIGURE 22 MARKET SHARE BY COUNTRY
FIGURE 23 EASTERN EUROPE AI IN REMOTE PATIENT MONITORING CURRENT AND FUTURE TYPE ANALYSIS, 2025–2034, (USD MILLION)
FIGURE 24 EASTERN EUROPE AI IN REMOTE PATIENT MONITORING CURRENT AND FUTURE END USER ANALYSIS, 2025–2034, (USD MILLION)
FIGURE 25 MARKET SHARE BY COUNTRY
FIGURE 26 WESTERN EUROPE AI IN REMOTE PATIENT MONITORING CURRENT AND FUTURE TYPE ANALYSIS, 2025–2034, (USD MILLION)
FIGURE 27 WESTERN EUROPE AI IN REMOTE PATIENT MONITORING CURRENT AND FUTURE END USER ANALYSIS, 2025–2034, (USD MILLION)
FIGURE 28 MARKET SHARE BY COUNTRY
FIGURE 29 EAST ASIA AND PACIFIC AI IN REMOTE PATIENT MONITORING CURRENT AND FUTURE TYPE ANALYSIS, 2025–2034, (USD MILLION)
FIGURE 30 EAST ASIA AND PACIFIC AI IN REMOTE PATIENT MONITORING CURRENT AND FUTURE END USER ANALYSIS, 2025–2034, (USD MILLION)
FIGURE 31 MARKET SHARE BY COUNTRY
FIGURE 32 SEA AND SOUTH ASIA AI IN REMOTE PATIENT MONITORING CURRENT AND FUTURE TYPE ANALYSIS, 2025–2034, (USD MILLION)
FIGURE 33 SEA AND SOUTH ASIA AI IN REMOTE PATIENT MONITORING CURRENT AND FUTURE END USER ANALYSIS, 2025–2034, (USD MILLION)
FIGURE 34 MARKET SHARE BY COUNTRY
FIGURE 35 MIDDLE EAST AND AFRICA AI IN REMOTE PATIENT MONITORING CURRENT AND FUTURE TYPE ANALYSIS, 2025–2034, (USD MILLION)
FIGURE 36 MIDDLE EAST AND AFRICA AI IN REMOTE PATIENT MONITORING CURRENT AND FUTURE END USER ANALYSIS, 2025–2034, (USD MILLION)
FIGURE 37 NORTH AMERICA AI IN REMOTE PATIENT MONITORING CURRENT AND FUTURE MARKET VOLUME SHARE REGIONAL ANALYSIS, 2025–2034, (USD MILLION)
FIGURE 38 U.S. AI IN REMOTE PATIENT MONITORING CURRENT AND FUTURE TYPE ANALYSIS, 2025–2034, (USD MILLION)
FIGURE 39 U.S. AI IN REMOTE PATIENT MONITORING CURRENT AND FUTURE END USER ANALYSIS, 2025–2034, (USD MILLION)
FIGURE 40 CANADA AI IN REMOTE PATIENT MONITORING CURRENT AND FUTURE TYPE ANALYSIS, 2025–2034, (USD MILLION)
FIGURE 41 CANADA AI IN REMOTE PATIENT MONITORING CURRENT AND FUTURE END USER ANALYSIS, 2025–2034, (USD MILLION)
FIGURE 42 LATIN AMERICA AI IN REMOTE PATIENT MONITORING CURRENT AND FUTURE MARKET VOLUME SHARE REGIONAL ANALYSIS, 2025–2034, (USD MILLION)
FIGURE 43 MEXICO AI IN REMOTE PATIENT MONITORING CURRENT AND FUTURE TYPE ANALYSIS, 2025–2034, (USD MILLION)
FIGURE 44 MEXICO AI IN REMOTE PATIENT MONITORING CURRENT AND FUTURE END USER ANALYSIS, 2025–2034, (USD MILLION)
FIGURE 45 BRAZIL AI IN REMOTE PATIENT MONITORING CURRENT AND FUTURE TYPE ANALYSIS, 2025–2034, (USD MILLION)
FIGURE 46 BRAZIL AI IN REMOTE PATIENT MONITORING CURRENT AND FUTURE END USER ANALYSIS, 2025–2034, (USD MILLION)
FIGURE 47 ARGENTINA AI IN REMOTE PATIENT MONITORING CURRENT AND FUTURE TYPE ANALYSIS, 2025–2034, (USD MILLION)
FIGURE 48 ARGENTINA AI IN REMOTE PATIENT MONITORING CURRENT AND FUTURE END USER ANALYSIS, 2025–2034, (USD MILLION)
FIGURE 49 COLUMBIA AI IN REMOTE PATIENT MONITORING CURRENT AND FUTURE TYPE ANALYSIS, 2025–2034, (USD MILLION)
FIGURE 50 COLUMBIA AI IN REMOTE PATIENT MONITORING CURRENT AND FUTURE END USER ANALYSIS, 2025–2034, (USD MILLION)
FIGURE 51 REST OF LATIN AMERICA AI IN REMOTE PATIENT MONITORING CURRENT AND FUTURE TYPE ANALYSIS, 2025–2034, (USD MILLION)
FIGURE 52 REST OF LATIN AMERICA AI IN REMOTE PATIENT MONITORING CURRENT AND FUTURE END USER ANALYSIS, 2025–2034, (USD MILLION)
FIGURE 53 EASTERN EUROPE AI IN REMOTE PATIENT MONITORING CURRENT AND FUTURE MARKET VOLUME SHARE REGIONAL ANALYSIS, 2025–2034, (USD MILLION)
FIGURE 54 POLAND AI IN REMOTE PATIENT MONITORING CURRENT AND FUTURE TYPE ANALYSIS, 2025–2034, (USD MILLION)
FIGURE 55 POLAND AI IN REMOTE PATIENT MONITORING CURRENT AND FUTURE END USER ANALYSIS, 2025–2034, (USD MILLION)
FIGURE 56 RUSSIA AI IN REMOTE PATIENT MONITORING CURRENT AND FUTURE TYPE ANALYSIS, 2025–2034, (USD MILLION)
FIGURE 57 RUSSIA AI IN REMOTE PATIENT MONITORING CURRENT AND FUTURE END USER ANALYSIS, 2025–2034, (USD MILLION)
FIGURE 58 CZECH REPUBLIC AI IN REMOTE PATIENT MONITORING CURRENT AND FUTURE TYPE ANALYSIS, 2025–2034, (USD MILLION)
FIGURE 59 CZECH REPUBLIC AI IN REMOTE PATIENT MONITORING CURRENT AND FUTURE END USER ANALYSIS, 2025–2034, (USD MILLION)
FIGURE 60 ROMANIA AI IN REMOTE PATIENT MONITORING CURRENT AND FUTURE TYPE ANALYSIS, 2025–2034, (USD MILLION)
FIGURE 61 ROMANIA AI IN REMOTE PATIENT MONITORING CURRENT AND FUTURE END USER ANALYSIS, 2025–2034, (USD MILLION)
FIGURE 62 REST OF EASTERN EUROPE AI IN REMOTE PATIENT MONITORING CURRENT AND FUTURE TYPE ANALYSIS, 2025–2034, (USD MILLION)
FIGURE 63 REST OF EASTERN EUROPE AI IN REMOTE PATIENT MONITORING CURRENT AND FUTURE END USER ANALYSIS, 2025–2034, (USD MILLION)
FIGURE 64 WESTERN EUROPE AI IN REMOTE PATIENT MONITORING CURRENT AND FUTURE MARKET VOLUME SHARE REGIONAL ANALYSIS, 2025–2034, (USD MILLION)
FIGURE 65 GERMANY AI IN REMOTE PATIENT MONITORING CURRENT AND FUTURE TYPE ANALYSIS, 2025–2034, (USD MILLION)
FIGURE 66 GERMANY AI IN REMOTE PATIENT MONITORING CURRENT AND FUTURE END USER ANALYSIS, 2025–2034, (USD MILLION)
FIGURE 67 FRANCE AI IN REMOTE PATIENT MONITORING CURRENT AND FUTURE TYPE ANALYSIS, 2025–2034, (USD MILLION)
FIGURE 68 FRANCE AI IN REMOTE PATIENT MONITORING CURRENT AND FUTURE END USER ANALYSIS, 2025–2034, (USD MILLION)
FIGURE 69 UK AI IN REMOTE PATIENT MONITORING CURRENT AND FUTURE TYPE ANALYSIS, 2025–2034, (USD MILLION)
FIGURE 70 UK AI IN REMOTE PATIENT MONITORING CURRENT AND FUTURE END USER ANALYSIS, 2025–2034, (USD MILLION)
FIGURE 71 SPAIN AI IN REMOTE PATIENT MONITORING CURRENT AND FUTURE TYPE ANALYSIS, 2025–2034, (USD MILLION)
FIGURE 72 SPAIN AI IN REMOTE PATIENT MONITORING CURRENT AND FUTURE END USER ANALYSIS, 2025–2034, (USD MILLION)
FIGURE 73 ITALY AI IN REMOTE PATIENT MONITORING CURRENT AND FUTURE TYPE ANALYSIS, 2025–2034, (USD MILLION)
FIGURE 74 ITALY AI IN REMOTE PATIENT MONITORING CURRENT AND FUTURE END USER ANALYSIS, 2025–2034, (USD MILLION)
FIGURE 75 REST OF WESTERN EUROPE AI IN REMOTE PATIENT MONITORING CURRENT AND FUTURE TYPE ANALYSIS, 2025–2034, (USD MILLION)
FIGURE 76 REST OF WESTERN EUROPE AI IN REMOTE PATIENT MONITORING CURRENT AND FUTURE END USER ANALYSIS, 2025–2034, (USD MILLION)
FIGURE 77 EAST ASIA AND PACIFIC AI IN REMOTE PATIENT MONITORING CURRENT AND FUTURE MARKET VOLUME SHARE REGIONAL ANALYSIS, 2025–2034, (USD MILLION)
FIGURE 78 CHINA AI IN REMOTE PATIENT MONITORING CURRENT AND FUTURE TYPE ANALYSIS, 2025–2034, (USD MILLION)
FIGURE 79 CHINA AI IN REMOTE PATIENT MONITORING CURRENT AND FUTURE END USER ANALYSIS, 2025–2034, (USD MILLION)
FIGURE 80 JAPAN AI IN REMOTE PATIENT MONITORING CURRENT AND FUTURE TYPE ANALYSIS, 2025–2034, (USD MILLION)
FIGURE 81 JAPAN AI IN REMOTE PATIENT MONITORING CURRENT AND FUTURE END USER ANALYSIS, 2025–2034, (USD MILLION)
FIGURE 82 AUSTRALIA AI IN REMOTE PATIENT MONITORING CURRENT AND FUTURE TYPE ANALYSIS, 2025–2034, (USD MILLION)
FIGURE 83 AUSTRALIA AI IN REMOTE PATIENT MONITORING CURRENT AND FUTURE END USER ANALYSIS, 2025–2034, (USD MILLION)
FIGURE 84 CAMBODIA AI IN REMOTE PATIENT MONITORING CURRENT AND FUTURE TYPE ANALYSIS, 2025–2034, (USD MILLION)
FIGURE 85 CAMBODIA AI IN REMOTE PATIENT MONITORING CURRENT AND FUTURE END USER ANALYSIS, 2025–2034, (USD MILLION)
FIGURE 86 FIJI AI IN REMOTE PATIENT MONITORING CURRENT AND FUTURE TYPE ANALYSIS, 2025–2034, (USD MILLION)
FIGURE 87 FIJI AI IN REMOTE PATIENT MONITORING CURRENT AND FUTURE END USER ANALYSIS, 2025–2034, (USD MILLION)
FIGURE 88 INDONESIA AI IN REMOTE PATIENT MONITORING CURRENT AND FUTURE TYPE ANALYSIS, 2025–2034, (USD MILLION)
FIGURE 89 INDONESIA AI IN REMOTE PATIENT MONITORING CURRENT AND FUTURE END USER ANALYSIS, 2025–2034, (USD MILLION)
FIGURE 90 SOUTH KOREA AI IN REMOTE PATIENT MONITORING CURRENT AND FUTURE TYPE ANALYSIS, 2025–2034, (USD MILLION)
FIGURE 91 SOUTH KOREA AI IN REMOTE PATIENT MONITORING CURRENT AND FUTURE END USER ANALYSIS, 2025–2034, (USD MILLION)
FIGURE 92 REST OF EAST ASIA AND PACIFIC AI IN REMOTE PATIENT MONITORING CURRENT AND FUTURE TYPE ANALYSIS, 2025–2034, (USD MILLION)
FIGURE 93 REST OF EAST ASIA AND PACIFIC AI IN REMOTE PATIENT MONITORING CURRENT AND FUTURE END USER ANALYSIS, 2025–2034, (USD MILLION)
FIGURE 94 SEA AND SOUTH ASIA AI IN REMOTE PATIENT MONITORING CURRENT AND FUTURE MARKET VOLUME SHARE REGIONAL ANALYSIS, 2025–2034, (USD MILLION)
FIGURE 95 BANGLADESH AI IN REMOTE PATIENT MONITORING CURRENT AND FUTURE TYPE ANALYSIS, 2025–2034, (USD MILLION)
FIGURE 96 BANGLADESH AI IN REMOTE PATIENT MONITORING CURRENT AND FUTURE END USER ANALYSIS, 2025–2034, (USD MILLION)
FIGURE 97 NEW ZEALAND AI IN REMOTE PATIENT MONITORING CURRENT AND FUTURE TYPE ANALYSIS, 2025–2034, (USD MILLION)
FIGURE 98 NEW ZEALAND AI IN REMOTE PATIENT MONITORING CURRENT AND FUTURE END USER ANALYSIS, 2025–2034, (USD MILLION)
FIGURE 99 INDIA AI IN REMOTE PATIENT MONITORING CURRENT AND FUTURE TYPE ANALYSIS, 2025–2034, (USD MILLION)
FIGURE 100 INDIA AI IN REMOTE PATIENT MONITORING CURRENT AND FUTURE END USER ANALYSIS, 2025–2034, (USD MILLION)
FIGURE 101 SINGAPORE AI IN REMOTE PATIENT MONITORING CURRENT AND FUTURE TYPE ANALYSIS, 2025–2034, (USD MILLION)
FIGURE 102 SINGAPORE AI IN REMOTE PATIENT MONITORING CURRENT AND FUTURE END USER ANALYSIS, 2025–2034, (USD MILLION)
FIGURE 103 THAILAND AI IN REMOTE PATIENT MONITORING CURRENT AND FUTURE TYPE ANALYSIS, 2025–2034, (USD MILLION)
FIGURE 104 THAILAND AI IN REMOTE PATIENT MONITORING CURRENT AND FUTURE END USER ANALYSIS, 2025–2034, (USD MILLION)
FIGURE 105 TAIWAN AI IN REMOTE PATIENT MONITORING CURRENT AND FUTURE TYPE ANALYSIS, 2025–2034, (USD MILLION)
FIGURE 106 TAIWAN AI IN REMOTE PATIENT MONITORING CURRENT AND FUTURE END USER ANALYSIS, 2025–2034, (USD MILLION)
FIGURE 107 MALAYSIA AI IN REMOTE PATIENT MONITORING CURRENT AND FUTURE TYPE ANALYSIS, 2025–2034, (USD MILLION)
FIGURE 108 MALAYSIA AI IN REMOTE PATIENT MONITORING CURRENT AND FUTURE END USER ANALYSIS, 2025–2034, (USD MILLION)
FIGURE 109 REST OF SEA AND SOUTH ASIA AI IN REMOTE PATIENT MONITORING CURRENT AND FUTURE TYPE ANALYSIS, 2025–2034, (USD MILLION)
FIGURE 110 REST OF SEA AND SOUTH ASIA AI IN REMOTE PATIENT MONITORING CURRENT AND FUTURE END USER ANALYSIS, 2025–2034, (USD MILLION)
FIGURE 111 MIDDLE EAST AND AFRICA AI IN REMOTE PATIENT MONITORING CURRENT AND FUTURE MARKET VOLUME SHARE REGIONAL ANALYSIS, 2025–2034, (USD MILLION)
FIGURE 112 GCC COUNTRIES AI IN REMOTE PATIENT MONITORING CURRENT AND FUTURE TYPE ANALYSIS, 2025–2034, (USD MILLION)
FIGURE 113 GCC COUNTRIES AI IN REMOTE PATIENT MONITORING CURRENT AND FUTURE END USER ANALYSIS, 2025–2034, (USD MILLION)
FIGURE 114 SAUDI ARABIA AI IN REMOTE PATIENT MONITORING CURRENT AND FUTURE TYPE ANALYSIS, 2025–2034, (USD MILLION)
FIGURE 115 SAUDI ARABIA AI IN REMOTE PATIENT MONITORING CURRENT AND FUTURE END USER ANALYSIS, 2025–2034, (USD MILLION)
FIGURE 116 UAE AI IN REMOTE PATIENT MONITORING CURRENT AND FUTURE TYPE ANALYSIS, 2025–2034, (USD MILLION)
FIGURE 117 UAE AI IN REMOTE PATIENT MONITORING CURRENT AND FUTURE END USER ANALYSIS, 2025–2034, (USD MILLION)
FIGURE 118 BAHRAIN AI IN REMOTE PATIENT MONITORING CURRENT AND FUTURE TYPE ANALYSIS, 2025–2034, (USD MILLION)
FIGURE 119 BAHRAIN AI IN REMOTE PATIENT MONITORING CURRENT AND FUTURE END USER ANALYSIS, 2025–2034, (USD MILLION)
FIGURE 120 KUWAIT AI IN REMOTE PATIENT MONITORING CURRENT AND FUTURE TYPE ANALYSIS, 2025–2034, (USD MILLION)
FIGURE 121 KUWAIT AI IN REMOTE PATIENT MONITORING CURRENT AND FUTURE END USER ANALYSIS, 2025–2034, (USD MILLION)
FIGURE 122 OMAN AI IN REMOTE PATIENT MONITORING CURRENT AND FUTURE TYPE ANALYSIS, 2025–2034, (USD MILLION)
FIGURE 123 OMAN AI IN REMOTE PATIENT MONITORING CURRENT AND FUTURE END USER ANALYSIS, 2025–2034, (USD MILLION)
FIGURE 124 QATAR AI IN REMOTE PATIENT MONITORING CURRENT AND FUTURE TYPE ANALYSIS, 2025–2034, (USD MILLION)
FIGURE 125 QATAR AI IN REMOTE PATIENT MONITORING CURRENT AND FUTURE END USER ANALYSIS, 2025–2034, (USD MILLION)
FIGURE 126 EGYPT AI IN REMOTE PATIENT MONITORING CURRENT AND FUTURE TYPE ANALYSIS, 2025–2034, (USD MILLION)
FIGURE 127 EGYPT AI IN REMOTE PATIENT MONITORING CURRENT AND FUTURE END USER ANALYSIS, 2025–2034, (USD MILLION)
FIGURE 128 NIGERIA AI IN REMOTE PATIENT MONITORING CURRENT AND FUTURE TYPE ANALYSIS, 2025–2034, (USD MILLION)
FIGURE 129 NIGERIA AI IN REMOTE PATIENT MONITORING CURRENT AND FUTURE END USER ANALYSIS, 2025–2034, (USD MILLION)
FIGURE 130 SOUTH AFRICA AI IN REMOTE PATIENT MONITORING CURRENT AND FUTURE TYPE ANALYSIS, 2025–2034, (USD MILLION)
FIGURE 131 SOUTH AFRICA AI IN REMOTE PATIENT MONITORING CURRENT AND FUTURE END USER ANALYSIS, 2025–2034, (USD MILLION)
FIGURE 132 ISRAEL AI IN REMOTE PATIENT MONITORING CURRENT AND FUTURE TYPE ANALYSIS, 2025–2034, (USD MILLION)
FIGURE 133 ISRAEL AI IN REMOTE PATIENT MONITORING CURRENT AND FUTURE END USER ANALYSIS, 2025–2034, (USD MILLION)
FIGURE 134 REST OF MEA AI IN REMOTE PATIENT MONITORING CURRENT AND FUTURE TYPE ANALYSIS, 2025–2034, (USD MILLION)
FIGURE 135 REST OF MEA AI IN REMOTE PATIENT MONITORING CURRENT AND FUTURE END USER ANALYSIS, 2025–2034, (USD MILLION)
FIGURE 136 U. S. MARKET SHARE ANALYSIS BY TYPE (2024)
FIGURE 137 U. S. MARKET SHARE ANALYSIS BY END USER (2024)
FIGURE 138 CANADA MARKET SHARE ANALYSIS BY TYPE (2024)
FIGURE 139 CANADA MARKET SHARE ANALYSIS BY END USER (2024)
FIGURE 140 MEXICO MARKET SHARE ANALYSIS BY TYPE (2024)
FIGURE 141 MEXICO MARKET SHARE ANALYSIS BY END USER (2024)
FIGURE 142 CHINA MARKET SHARE ANALYSIS BY TYPE (2024)
FIGURE 143 CHINA MARKET SHARE ANALYSIS BY END USER (2024)
FIGURE 144 JAPAN MARKET SHARE ANALYSIS BY TYPE (2024)
FIGURE 145 JAPAN MARKET SHARE ANALYSIS BY END USER (2024)
FIGURE 146 INDIA MARKET SHARE ANALYSIS BY TYPE (2024)
FIGURE 147 INDIA MARKET SHARE ANALYSIS BY END USER (2024)
FIGURE 148 SOUTH KOREA MARKET SHARE ANALYSIS BY TYPE (2024)
FIGURE 149 SOUTH KOREA MARKET SHARE ANALYSIS BY END USER (2024)
FIGURE 150 SAUDI ARABIA MARKET SHARE ANALYSIS BY TYPE (2024)
FIGURE 151 SAUDI ARABIA MARKET SHARE ANALYSIS BY END USER (2024)
FIGURE 152 UAE MARKET SHARE ANALYSIS BY TYPE (2024)
FIGURE 153 UAE MARKET SHARE ANALYSIS BY END USER (2024)
FIGURE 154 EGYPT MARKET SHARE ANALYSIS BY TYPE (2024)
FIGURE 155 EGYPT MARKET SHARE ANALYSIS BY END USER (2024)
FIGURE 156 NIGERIA MARKET SHARE ANALYSIS BY TYPE (2024)
FIGURE 157 NIGERIA MARKET SHARE ANALYSIS BY END USER (2024)
FIGURE 158 SOUTH AFRICA MARKET SHARE ANALYSIS BY TYPE (2024)
FIGURE 159 SOUTH AFRICA MARKET SHARE ANALYSIS BY END USER (2024)
FIGURE 160 GERMANY MARKET SHARE ANALYSIS BY TYPE (2024)
FIGURE 161 GERMANY MARKET SHARE ANALYSIS BY END USER (2024)
FIGURE 162 FRANCE MARKET SHARE ANALYSIS BY TYPE (2024)
FIGURE 163 FRANCE MARKET SHARE ANALYSIS BY END USER (2024)
FIGURE 164 UK MARKET SHARE ANALYSIS BY TYPE (2024)
FIGURE 165 UK MARKET SHARE ANALYSIS BY END USER (2024)
FIGURE 166 SPAIN MARKET SHARE ANALYSIS BY TYPE (2024)
FIGURE 167 SPAIN MARKET SHARE ANALYSIS BY END USER (2024)
FIGURE 168 ITALY MARKET SHARE ANALYSIS BY TYPE (2024)
FIGURE 169 ITALY MARKET SHARE ANALYSIS BY END USER (2024)
FIGURE 170 BRAZIL MARKET SHARE ANALYSIS BY TYPE (2024)
FIGURE 171 BRAZIL MARKET SHARE ANALYSIS BY END USER (2024)
FIGURE 172 ARGENTINA MARKET SHARE ANALYSIS BY TYPE (2024)
FIGURE 173 ARGENTINA MARKET SHARE ANALYSIS BY END USER (2024)
FIGURE 174 COLUMBIA MARKET SHARE ANALYSIS BY TYPE (2024)
FIGURE 175 COLUMBIA MARKET SHARE ANALYSIS BY END USER (2024)
FIGURE 176 GLOBAL AI IN REMOTE PATIENT MONITORING CURRENT AND FUTURE MARKET KEY COUNTRY LEVEL ANALYSIS, 2024–2034, (USD MILLION)
FIGURE 177 FINANCIAL OVERVIEW:
Key Player Analysis
BPG Bio, Inc.: BPG Bio operates at the intersection of biology and AI, leveraging its NAi Interrogative Biology® platform to mine multi-omics data from a large proprietary biobank using Bayesian causal AI and HPC resources. The company’s focus on biomarker discovery and mechanism-of-action insights positions it upstream of traditional RPM vendors; its outputs (validated biomarkers and targets) are increasingly relevant to digital endpoints and algorithmic risk stratification that feed RPM pathways in cardiometabolic and rare diseases. Recognition as a 2024 “BioTech AI Company of the Year” underscores its momentum and credibility with enterprise healthcare partners.
BPG Bio’s strategic thrust in 2025 centers on expanding NAi’s scalability and translational footprint through partnerships that connect molecular signals to longitudinal patient data. For RPM stakeholders, this creates openings to embed biology-informed features into monitoring algorithms (e.g., linking digital biomarkers to therapy response). The firm’s biology-first differentiation—rooted in clinically annotated samples and causal inference—offers a defensible edge as providers and payers demand explainability and outcome evidence in remote monitoring programs.
Ferrum Health: Ferrum Health provides a vendor-neutral “Private AI Hub” that allows health systems to deploy, validate, govern, and monitor clinical AI within their own environment—minimizing PHI exposure and integration overhead. As of 2024, its platform had processed more than 2.5 million unique patient records, signaling enterprise-scale readiness and growing adoption across service lines. The company emphasizes in-firewall deployment, model validation on local data, and an app catalog approach that accelerates AI rollout without sacrificing compliance.
In 2025, Ferrum’s relevance to AI-enabled RPM lies in governance and lifecycle management: health systems can use the hub to evaluate monitoring algorithms, harden security controls, and generate real-world performance evidence for contracting. This infrastructure-centric differentiation—security, auditability, and multi-model orchestration—aligns with procurement trends favoring explainable AI and standardized oversight across imaging, monitoring, and virtual-care workflows.
Caption Health Inc.: Caption Health’s FDA-cleared AI guidance software enables non-expert operators to acquire diagnostic-quality ultrasound images, expanding access to point-of-care and in-home cardiac assessment. Following its 2023 acquisition by GE HealthCare, the technology is being integrated into mainstream ultrasound portfolios, supporting care-at-home models and longitudinal monitoring of heart failure and other cardiology cohorts. Earlier initiatives such as “Caption Care” demonstrated field deployment of AI-guided scans in patients’ homes—an important bridge between episodic imaging and ongoing RPM.
Strategically, the GE platform provides distribution scale, regulatory depth, and integration with device fleets—key to embedding echo-based measures into remote pathways (e.g., fluid status, ejection fraction proxies). Caption’s differentiator remains access enablement: by lowering operator skill thresholds and standardizing acquisition, it brings diagnostic imaging into RPM toolkits where periodic imaging complements continuous wearable signals for more robust cardiometabolic management.
Sensely Inc.: Sensely offers a conversational AI “digital nurse” that engages patients via voice or text across 30+ languages, using clinically vetted content from sources such as Mayo Clinic and the NHS. Its modules span symptom assessment, navigation, and health management for payers, providers, and life sciences—a capability set that improves RPM adherence, escalates exceptions, and lowers call-center workload. With the healthcare virtual assistant category projected to grow at ~30% CAGR through the 2030s, Sensely’s multilingual, omni-channel interface is well placed to augment monitoring programs with continuous, low-friction engagement.
In 2025, Sensely’s strategic moves emphasize deeper integration into care management platforms and payer portals, enabling automated triage summaries and data capture that feed clinician dashboards. Differentiation stems from mature conversational UX, enterprise integrations, and content partnerships, which collectively support scalable behavior change and cost-to-serve reduction—two critical levers for RPM ROI in risk-bearing contracts.
Market Key Players
Medasense Biometrics Ltd
Sensely Inc.
AICure LLC
International Business Machines Corp. (IBM)
Modernizing Machine, Inc.
BPG Bio, Inc.
Atomwise Inc.
Caption Health Inc.
Nuance Communications
Ferrum Health
Driver:
AI-Enabled RPM Expands with Aging Populations & Chronic Burden
As of 2025, escalating cardiometabolic burden and aging populations are expanding the addressable base for AI-enabled remote patient monitoring (RPM). Health systems are shifting from episodic to longitudinal care, using wearables and home sensors to stream multi-parametric data that machine-learning models convert into risk scores and proactive interventions. This shift is economically compelling: RPM programs commonly report 10–20% reductions in avoidable readmissions and 15–30% fewer in-person visits within 6–12 months, supporting the market’s ~26–27% CAGR trajectory toward the early 2030s. The rapid penetration of medical-grade wearables (which held ~61% of monitoring hardware revenue in the baseline period) and software platforms (≈75% of stack value) further accelerates scale.
Adoption is constrained by uneven infrastructure, data-governance complexity, and clinician workflow burden. In many emerging markets, broadband coverage gaps and low digital literacy cap enrollment penetration, while enterprise deployments face lengthy security, compliance, and SaMD validation cycles that can add 6–12 months to procurement. Privacy and cybersecurity requirements (HIPAA/GDPR, ISO 27001, SOC 2) raise total cost of ownership, and legacy rules-based alerting can yield high false-positive rates that depress clinician satisfaction. These frictions delay time-to-value and favor incumbents with proven integrations and real-world evidence, raising barriers for new entrants.
The richest growth seam in 2025–2030 lies at the intersection of AI, IoT, and outcomes-based contracting. Asia–Pacific is positioned as the fastest-growing geography (often >30% CAGR) on the back of national digital-health programs and cost-optimized device ecosystems; incremental APAC RPM revenues could exceed USD 7–8 billion by 2030 if payer reimbursement and public tenders expand as expected. Clinically, high-acuity pathways—heart failure, COPD, post-operative recovery, and oncology supportive care—offer premium economics where early decompensation detection demonstrably averts admissions. Strategic partnerships among device OEMs, platform vendors, providers, and payers are unlocking per-member-per-month models and shared-savings contracts that scale beyond pilots.
Trend:
Multimodal & Edge AI Redefine Predictive, Personalized RPM
Multimodal and edge AI are becoming standard, fusing PPG/ECG, activity, and context data to improve early-warning sensitivity while reducing non-actionable alerts by 25–40% after local tuning. Generative and conversational AI are moving from pilots to production for triage summarization, patient engagement, and care-plan personalization, shrinking manual workload and closing gaps in adherence. Vendors are doubling down on explainability, continuous model monitoring, and privacy-preserving learning (federated learning, differential privacy) to satisfy procurement and regulatory scrutiny. Industry leaders—spanning Philips, Medtronic, Dexcom, Abbott, and platform specialists—are embedding these capabilities across RPM suites, setting a higher bar for interoperability (FHIR), cybersecurity, and real-world outcomes evidence.
Recent Developments
Dec 2024 – Dexcom: Launched a proprietary Generative AI platform for its Stelo over-the-counter glucose biosensor, making Dexcom the first CGM manufacturer to integrate GenAI into glucose biosensing; the system analyzes lifestyle patterns and provides personalized metabolic insights. Strategic impact: Strengthens Dexcom’s position in AI-enabled metabolic monitoring and expands use cases that can feed clinician-supervised RPM pathways.
Feb 2025 – Validic: Introduced GenAI-powered RPM summaries that auto-generate progress notes within EHR workflows, followed by availability of its Intelligent Digital Care solutions in AWS Marketplace later in the month to streamline procurement and scale. Strategic impact: Enhances provider productivity and accelerates health-system adoption of AI-driven RPM through enterprise-grade distribution channels.
Apr 2025 – Validic & Tenovi: Announced a strategic integration that brings cellular-connected devices into Validic’s platform, automating data capture from home devices to broaden access for patients without reliable broadband. Strategic impact: Expands the reachable RPM population and reduces onboarding friction, a critical lever for multi-site and payer-sponsored programs.
Jul 2025 – Philips & Western Australia Health: Reported outcomes from a collaboration showcasing remote continuous vital-sign monitoring for surgical pathways, highlighting improvements in post-operative care and cost efficiency across pilot cohorts. Strategic impact: Provides real-world evidence that supports budget justification for scaled RPM deployments in public health systems.
Sep 2025 – Philips & Masimo: Renewed a multi-year innovation partnership to integrate advanced wearable sensors (e.g., Radius PPG) and develop new AI algorithms within Philips’ monitoring ecosystem. Strategic impact: Bolsters an interoperable, AI-first monitoring stack that can extend from inpatient to home settings, intensifying competition with vertically integrated RPM platforms.