AI in RPA Market Forecast Size, Growth & Automation Trends | 14.9% CAGR
Global AI in RPA Market Size, Share & Analysis By Type (Software, Service), By Deployment Mode (Cloud-based, On-premise), By Organization Size (Large Enterprises, Small & Medium Enterprises), By Application (BFSI, Pharma & Healthcare, Retail & Consumer Goods, Information Technology & Telecom, Communication and Media & Education, Other Applications) Industry Regions & Key Players – Market Architecture, Automation Trends, Competitive Strategies & Forecast 2025–2034
The AI in Robotic Process Automation (RPA) Market is valued at approximately USD 4.9 Billion in 2024 and is projected to reach nearly USD 21.7 Billion by 2034, expanding at a CAGR of around 14.9% during 2025–2034. AI-enabled automation is moving beyond rule-based workflows into intelligent decisioning, autonomous document processing, and predictive operations. As enterprises digitize back-office, finance, HR, and supply-chain functions, AI-driven RPA is becoming a core engine for cost optimization and workforce augmentation. This decade will mark the shift from “bots” to cognitive automation ecosystems, reshaping enterprise productivity worldwide.
This rapid expansion underscores the accelerating convergence of automation and intelligence, as organizations increasingly seek solutions that streamline operations, reduce costs, and unlock new efficiencies. Historically, RPA adoption surged as enterprises sought to automate repetitive, rule-based tasks such as data entry, claims processing, and invoice management. More recently, the integration of artificial intelligence—particularly machine learning, natural language processing (NLP), and computer vision—has transformed RPA from a rules-based tool into a cognitive enabler capable of addressing unstructured data and complex decision-making processes.
The market’s evolution is fueled by several drivers. Demand-side factors include enterprises’ urgent need to boost productivity while containing labor costs, with surveys indicating that over 90% of executives now utilize intelligent automation in some form. Supply-side momentum comes from vendors embedding AI into RPA platforms, enabling capabilities like predictive analytics and sentiment analysis that broaden the scope of automation beyond back-office tasks. Yet challenges remain: the shortage of AI-skilled talent and the complexity of aligning AI algorithms with existing business processes often delay implementation, while integration hurdles and governance risks add layers of uncertainty for adopters.
Technological innovation is at the heart of growth. Deloitte reports that 27% of organizations deploying RPA are simultaneously adopting cognitive automation, highlighting the shift toward intelligent RPA ecosystems. Emerging solutions leverage AI to orchestrate workflows across functions, while advances in digitalization, low-code platforms, and cloud-native architectures make adoption more accessible. AI-powered RPA is particularly transforming customer service, fraud detection, and supply chain optimization, creating measurable ROI for early adopters.
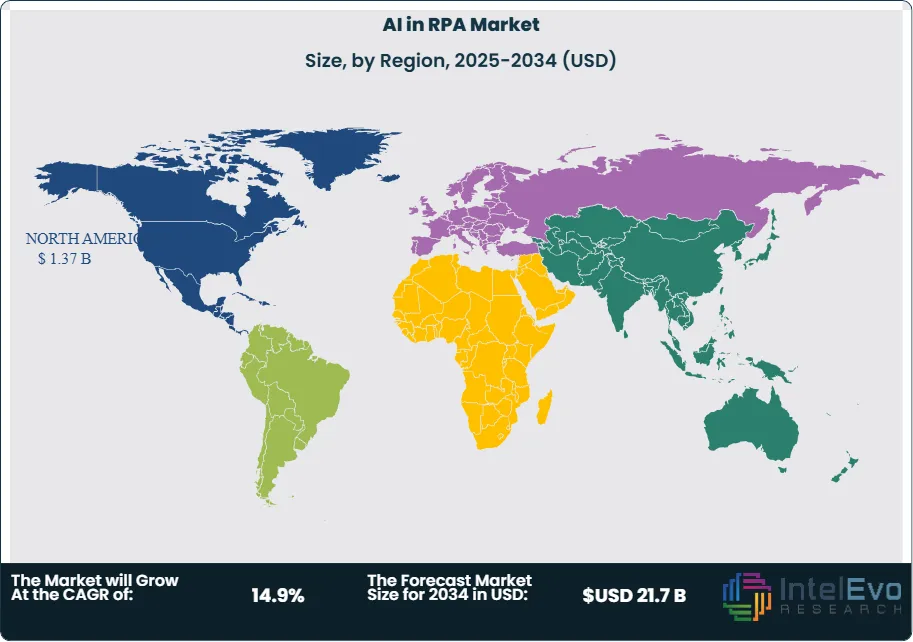
Geographically, North America leads the market, buoyed by robust enterprise digitalization initiatives and heavy investments by major technology players. Europe follows closely, driven by regulatory pressures to enhance compliance and efficiency. Meanwhile, Asia-Pacific is emerging as the fastest-growing region, propelled by digital transformation programs in countries like India and China and a burgeoning ecosystem of startups. For investors, high-growth hotspots lie in sectors such as banking, healthcare, and retail, where automation demand intersects with vast data volumes and the imperative for operational resilience. Together, these dynamics position AI-driven RPA as a transformative force reshaping enterprise productivity worldwide.
Key Takeaways
Market Growth: The global AI in RPA market was valued at USD 4.9 Billion (2024) and is projected to reach USD 21.7 Billion by 2034, registering a 14.9% CAGR (2025–2034), propelled by efficiency mandates, cost takeout, and the shift from rules-based bots to cognitive automation; >90% of executives report using intelligent automation in some capacity.
Segment Dominance – Component: Software led with >68% revenue share in 2023, reflecting spend on orchestration platforms, model-serving, and bot lifecycle management; services (~32%) remain essential for integration, data engineering, and governance in complex estates.
Segment Dominance – Deployment Model: On-premise accounted for >78% share in 2023, supported by data-residency and model-risk controls in regulated industries; however, cloud-native AI+RPA is the fastest-rising delivery model, expected to grow at >15% CAGR as vendors expand SaaS offerings and elastic inference.
Driver: Enterprise scaling is accelerating adoption—large enterprises captured ~66% of 2023 spend, while 27% of RPA adopters are layering in cognitive tools (NLP, computer vision, ML), expanding automation from structured to unstructured workflows and lifting throughput and straight-through processing.
Restraint: Integration complexity and the AI-skills gap slow rollouts; aligning models with legacy processes and controls can extend initial deployments by 4–6 months in highly regulated settings, raising near-term implementation costs and delaying time-to-value.
Opportunity: BFSI is the largest and steadiest demand pool with ~29% share (2023); driven by KYC/AML, fraud, and claims automation, the segment is poised to exceed ~USD 3.5 billion by 2033 at an estimated ~14–15% CAGR, aided by document-intensive use cases.
Trend: GenAI-infused RPA is moving mainstream as vendors such as UiPath, Microsoft, Automation Anywhere, and SS&C Blue Prism embed LLMs, retrieval-augmented generation, and vision to enable natural-language task creation, autonomous exception handling, and analytics-driven orchestration.
Regional Analysis: North America led with ~28% share (USD 0.9 billion) in 2023, supported by mature digital cores and stringent governance; Asia-Pacific is the fastest-growing region (expected ~15–18% CAGR) on the back of cloud adoption in India, China, and Southeast Asia, while Europe expands steadily under compliance-driven automation.
By Type
As of 2025, software continues to anchor spend in AI-enabled RPA, accounting for roughly two-thirds of global revenue (down modestly from ~68% in 2023 as services expand). Growth is propelled by platform consolidation and native AI features—LLM-based copilots, embedded NLP/computer vision, and policy-aware orchestration—that enable automation of unstructured, judgment-intensive work. Leading suites (e.g., UiPath, Microsoft Power Automate, Automation Anywhere, SS&C Blue Prism) now ship with prompt-to-flow design, integrated model hubs, and analytics, compressing time-to-value and lifting bot reliability.
Services (consulting, integration, managed operations) are rising faster than the overall market as enterprises scale from pilot to production. Complexities—data governance, model risk management, API/legacy connectivity, and change management—drive demand for systems integrators and MSPs. From 2025 onward, managed services tied to outcome SLAs (e.g., straight-through processing rates, first-contact resolution) and continuous model monitoring are expected to capture a growing share, particularly in regulated sectors.
By Deployment Mode
In 2025, on-premise remains prevalent in highly regulated environments (banking, insurance, public sector, healthcare), sustained by data-residency mandates, deterministic latency, and tighter control over model/version governance. Many large RPA estates continue to run on self-managed infrastructure where security tooling and audit workflows are already standardized.
That said, cloud-based deployments are the fastest-growing model and are expected to outpace overall market CAGR through 2030+. Elastic inference for AI services, lower upfront cost, and continuous delivery of features (e.g., new connectors, foundation-model upfits) are shifting new workloads to SaaS and VPC-managed options. Hybrid patterns—bots near systems of record with AI services in cloud—are becoming the default in multinational rollouts to balance sovereignty and agility.
By Organization Size
Large enterprises still command the majority of spending (historically ~66% in 2023; similar mix in 2025) because they operate the scale and process diversity that benefit most from cognitive automation. These organizations prioritize end-to-end automation (order-to-cash, claims, KYC/AML, HR case management) and fund platform standardization, CoEs, and governance programs that enable multi-country deployments and stringent compliance.
SMEs are closing the gap thanks to simplified pricing, prebuilt templates, and genAI assistants that reduce design and maintenance overhead. Cloud delivery and partner-led packages (industry playbooks with curated models and connectors) are unlocking adoption in midmarket finance, healthcare providers, logistics, and professional services, where rapid payback and minimal IT lift are decisive.
By Application
BFSI remains the largest vertical—about ~28–30% of 2025 spend—driven by document-heavy workflows and regulatory reporting. Banks and insurers are expanding from back-office automation to front-office augmentation (collections, underwriting triage, claims FNOL), with measurable improvements in cycle time and auditability. Information Technology & Telecom follows, leveraging bots for service desk, billing reconciliation, and network ops, often pairing genAI with event automation for autonomous remediation.
Momentum is accelerating in Pharma & Healthcare (prior authorization, revenue cycle, pharmacovigilance) and Retail & Consumer Goods (catalog enrichment, personalization ops, invoice matching), both expected to outgrow the market average as unstructured text/vision tasks become automatable. Communication & Media & Education deploy AI-RPA for content ops, rights management, and student services, while Other applications span manufacturing quality, logistics paperwork, and energy trading confirmations—areas where exception-handling and traceability are critical.
By Region
North America retains market leadership in 2025 (historically ~28% share; ~USD 0.9B in 2023), underpinned by mature digital cores, AI talent depth, and early adoption of model governance. Europe scales steadily, guided by compliance-first rollouts and strong uptake in financial services and public administration, with growth shaped by data-protection and AI-risk frameworks.
Asia Pacific is the fastest-growing region through the late 2020s, propelled by cloud adoption, Greenfield digital programs, and cost-to-serve pressure in India, Southeast Asia, and China. Latin America and Middle East & Africa are emerging investment corridors where shared-services modernization and government digitalization are catalyzing demand; partnerships with regional SIs and hyperscalers are pivotal to navigate data localization and talent constraints. Overall, APAC’s trajectory positions it to narrow the share gap with North America by 2030 while Europe maintains a high-compliance, multi-industry expansion path.
By Type (Software, Service), By Deployment Mode (Cloud-based, On-premise), By Organization Size (Large Enterprises, Small & Medium Enterprises), By Application (BFSI, Pharma & Healthcare, Retail & Consumer Goods, Information Technology & Telecom, Communication and Media & Education, Other Applications)
Research Methodology
Primary Research- 100 Interviews of Stakeholders
Secondary Research
Desk Research
Regional scope
North America (United States, Canada, Mexico)
Latin America (Brazil, Argentina, Columbia)
East Asia And Pacific (China, Japan, South Korea, Australia, Cambodia, Fiji, Indonesia)
Sea And South Asia (India, Singapore, Thailand, Taiwan, Malaysia)
Eastern Europe (Poland, Russia, Czech Republic, Romania)
Western Europe (Germany, U.K., France, Spain, Itlay)
Middle East & Africa (GCC Countries, Egypt, Nigeria, South Africa, Israel)
Competitive Landscape
UiPath, FPT Software, Pegasystems, NICE, EdgeVerve Systems Ltd., Automation Anywhere, OnviSource, Inc., Blue Prism, NTT Advanced Technology Corp., KOFAX, Inc., Other Key Players
Customization Scope
Customization for segments, region/country-level will be provided. Moreover, additional customization can be done based on the requirements.
Pricing and Purchase Options
Avail customized purchase options to meet your exact research needs. We have three licenses to opt for: Single User License, Multi-User License (Up to 5 Users), Corporate Use License (Unlimited User and Printable PDF).
TABLE OF CONTENTS
1. EXECUTIVE SUMMARY
1.1. MARKET SNAPSHOT
1.2. KEY FINDINGS & INSIGHTS
1.3. ANALYST RECOMMENDATIONS
1.4. FUTURE OUTLOOK
2. RESEARCH METHODOLOGY
2.1. MARKET DEFINITION & SCOPE
2.2. RESEARCH OBJECTIVES: PRIMARY & SECONDARY DATA SOURCES
2.3. DATA COLLECTION SOURCES
2.3.1. COVERAGE OF 100+ PRIMARY RESEARCH/CONSULTATION CALLS WITH INDUSTRY STAKEHOLDERS
FIGURE 17 NORTH AMERICA AI IN RPA SYSTEM CURRENT AND FUTURE TYPE ANALYSIS, 2025–2034, (USD MILLION)
FIGURE 18 NORTH AMERICA AI IN RPA SYSTEM CURRENT AND FUTURE END USER ANALYSIS, 2025–2034, (USD MILLION)
FIGURE 19 MARKET SHARE BY COUNTRY
FIGURE 20 LATIN AMERICA AI IN RPA SYSTEM CURRENT AND FUTURE TYPE ANALYSIS, 2025–2034, (USD MILLION)
FIGURE 21 LATIN AMERICA AI IN RPA SYSTEM CURRENT AND FUTURE END USER ANALYSIS, 2025–2034, (USD MILLION)
FIGURE 22 MARKET SHARE BY COUNTRY
FIGURE 23 EASTERN EUROPE AI IN RPA SYSTEM CURRENT AND FUTURE TYPE ANALYSIS, 2025–2034, (USD MILLION)
FIGURE 24 EASTERN EUROPE AI IN RPA SYSTEM CURRENT AND FUTURE END USER ANALYSIS, 2025–2034, (USD MILLION)
FIGURE 25 MARKET SHARE BY COUNTRY
FIGURE 26 WESTERN EUROPE AI IN RPA SYSTEM CURRENT AND FUTURE TYPE ANALYSIS, 2025–2034, (USD MILLION)
FIGURE 27 WESTERN EUROPE AI IN RPA SYSTEM CURRENT AND FUTURE END USER ANALYSIS, 2025–2034, (USD MILLION)
FIGURE 28 MARKET SHARE BY COUNTRY
FIGURE 29 EAST ASIA AND PACIFIC AI IN RPA SYSTEM CURRENT AND FUTURE TYPE ANALYSIS, 2025–2034, (USD MILLION)
FIGURE 30 EAST ASIA AND PACIFIC AI IN RPA SYSTEM CURRENT AND FUTURE END USER ANALYSIS, 2025–2034, (USD MILLION)
FIGURE 31 MARKET SHARE BY COUNTRY
FIGURE 32 SEA AND SOUTH ASIA AI IN RPA SYSTEM CURRENT AND FUTURE TYPE ANALYSIS, 2025–2034, (USD MILLION)
FIGURE 33 SEA AND SOUTH ASIA AI IN RPA SYSTEM CURRENT AND FUTURE END USER ANALYSIS, 2025–2034, (USD MILLION)
FIGURE 34 MARKET SHARE BY COUNTRY
FIGURE 35 MIDDLE EAST AND AFRICA AI IN RPA SYSTEM CURRENT AND FUTURE TYPE ANALYSIS, 2025–2034, (USD MILLION)
FIGURE 36 MIDDLE EAST AND AFRICA AI IN RPA SYSTEM CURRENT AND FUTURE END USER ANALYSIS, 2025–2034, (USD MILLION)
FIGURE 37 NORTH AMERICA AI IN RPA SYSTEM CURRENT AND FUTURE MARKET VOLUME SHARE REGIONAL ANALYSIS, 2025–2034, (USD MILLION)
FIGURE 38 U.S. AI IN RPA SYSTEM CURRENT AND FUTURE TYPE ANALYSIS, 2025–2034, (USD MILLION)
FIGURE 39 U.S. AI IN RPA SYSTEM CURRENT AND FUTURE END USER ANALYSIS, 2025–2034, (USD MILLION)
FIGURE 40 CANADA AI IN RPA SYSTEM CURRENT AND FUTURE TYPE ANALYSIS, 2025–2034, (USD MILLION)
FIGURE 41 CANADA AI IN RPA SYSTEM CURRENT AND FUTURE END USER ANALYSIS, 2025–2034, (USD MILLION)
FIGURE 42 LATIN AMERICA AI IN RPA SYSTEM CURRENT AND FUTURE MARKET VOLUME SHARE REGIONAL ANALYSIS, 2025–2034, (USD MILLION)
FIGURE 43 MEXICO AI IN RPA SYSTEM CURRENT AND FUTURE TYPE ANALYSIS, 2025–2034, (USD MILLION)
FIGURE 44 MEXICO AI IN RPA SYSTEM CURRENT AND FUTURE END USER ANALYSIS, 2025–2034, (USD MILLION)
FIGURE 45 BRAZIL AI IN RPA SYSTEM CURRENT AND FUTURE TYPE ANALYSIS, 2025–2034, (USD MILLION)
FIGURE 46 BRAZIL AI IN RPA SYSTEM CURRENT AND FUTURE END USER ANALYSIS, 2025–2034, (USD MILLION)
FIGURE 47 ARGENTINA AI IN RPA SYSTEM CURRENT AND FUTURE TYPE ANALYSIS, 2025–2034, (USD MILLION)
FIGURE 48 ARGENTINA AI IN RPA SYSTEM CURRENT AND FUTURE END USER ANALYSIS, 2025–2034, (USD MILLION)
FIGURE 49 COLUMBIA AI IN RPA SYSTEM CURRENT AND FUTURE TYPE ANALYSIS, 2025–2034, (USD MILLION)
FIGURE 50 COLUMBIA AI IN RPA SYSTEM CURRENT AND FUTURE END USER ANALYSIS, 2025–2034, (USD MILLION)
FIGURE 51 REST OF LATIN AMERICA AI IN RPA SYSTEM CURRENT AND FUTURE TYPE ANALYSIS, 2025–2034, (USD MILLION)
FIGURE 52 REST OF LATIN AMERICA AI IN RPA SYSTEM CURRENT AND FUTURE END USER ANALYSIS, 2025–2034, (USD MILLION)
FIGURE 53 EASTERN EUROPE AI IN RPA SYSTEM CURRENT AND FUTURE MARKET VOLUME SHARE REGIONAL ANALYSIS, 2025–2034, (USD MILLION)
FIGURE 54 POLAND AI IN RPA SYSTEM CURRENT AND FUTURE TYPE ANALYSIS, 2025–2034, (USD MILLION)
FIGURE 55 POLAND AI IN RPA SYSTEM CURRENT AND FUTURE END USER ANALYSIS, 2025–2034, (USD MILLION)
FIGURE 56 RUSSIA AI IN RPA SYSTEM CURRENT AND FUTURE TYPE ANALYSIS, 2025–2034, (USD MILLION)
FIGURE 57 RUSSIA AI IN RPA SYSTEM CURRENT AND FUTURE END USER ANALYSIS, 2025–2034, (USD MILLION)
FIGURE 58 CZECH REPUBLIC AI IN RPA SYSTEM CURRENT AND FUTURE TYPE ANALYSIS, 2025–2034, (USD MILLION)
FIGURE 59 CZECH REPUBLIC AI IN RPA SYSTEM CURRENT AND FUTURE END USER ANALYSIS, 2025–2034, (USD MILLION)
FIGURE 60 ROMANIA AI IN RPA SYSTEM CURRENT AND FUTURE TYPE ANALYSIS, 2025–2034, (USD MILLION)
FIGURE 61 ROMANIA AI IN RPA SYSTEM CURRENT AND FUTURE END USER ANALYSIS, 2025–2034, (USD MILLION)
FIGURE 62 REST OF EASTERN EUROPE AI IN RPA SYSTEM CURRENT AND FUTURE TYPE ANALYSIS, 2025–2034, (USD MILLION)
FIGURE 63 REST OF EASTERN EUROPE AI IN RPA SYSTEM CURRENT AND FUTURE END USER ANALYSIS, 2025–2034, (USD MILLION)
FIGURE 64 WESTERN EUROPE AI IN RPA SYSTEM CURRENT AND FUTURE MARKET VOLUME SHARE REGIONAL ANALYSIS, 2025–2034, (USD MILLION)
FIGURE 65 GERMANY AI IN RPA SYSTEM CURRENT AND FUTURE TYPE ANALYSIS, 2025–2034, (USD MILLION)
FIGURE 66 GERMANY AI IN RPA SYSTEM CURRENT AND FUTURE END USER ANALYSIS, 2025–2034, (USD MILLION)
FIGURE 67 FRANCE AI IN RPA SYSTEM CURRENT AND FUTURE TYPE ANALYSIS, 2025–2034, (USD MILLION)
FIGURE 68 FRANCE AI IN RPA SYSTEM CURRENT AND FUTURE END USER ANALYSIS, 2025–2034, (USD MILLION)
FIGURE 69 UK AI IN RPA SYSTEM CURRENT AND FUTURE TYPE ANALYSIS, 2025–2034, (USD MILLION)
FIGURE 70 UK AI IN RPA SYSTEM CURRENT AND FUTURE END USER ANALYSIS, 2025–2034, (USD MILLION)
FIGURE 71 SPAIN AI IN RPA SYSTEM CURRENT AND FUTURE TYPE ANALYSIS, 2025–2034, (USD MILLION)
FIGURE 72 SPAIN AI IN RPA SYSTEM CURRENT AND FUTURE END USER ANALYSIS, 2025–2034, (USD MILLION)
FIGURE 73 ITALY AI IN RPA SYSTEM CURRENT AND FUTURE TYPE ANALYSIS, 2025–2034, (USD MILLION)
FIGURE 74 ITALY AI IN RPA SYSTEM CURRENT AND FUTURE END USER ANALYSIS, 2025–2034, (USD MILLION)
FIGURE 75 REST OF WESTERN EUROPE AI IN RPA SYSTEM CURRENT AND FUTURE TYPE ANALYSIS, 2025–2034, (USD MILLION)
FIGURE 76 REST OF WESTERN EUROPE AI IN RPA SYSTEM CURRENT AND FUTURE END USER ANALYSIS, 2025–2034, (USD MILLION)
FIGURE 77 EAST ASIA AND PACIFIC AI IN RPA SYSTEM CURRENT AND FUTURE MARKET VOLUME SHARE REGIONAL ANALYSIS, 2025–2034, (USD MILLION)
FIGURE 78 CHINA AI IN RPA SYSTEM CURRENT AND FUTURE TYPE ANALYSIS, 2025–2034, (USD MILLION)
FIGURE 79 CHINA AI IN RPA SYSTEM CURRENT AND FUTURE END USER ANALYSIS, 2025–2034, (USD MILLION)
FIGURE 80 JAPAN AI IN RPA SYSTEM CURRENT AND FUTURE TYPE ANALYSIS, 2025–2034, (USD MILLION)
FIGURE 81 JAPAN AI IN RPA SYSTEM CURRENT AND FUTURE END USER ANALYSIS, 2025–2034, (USD MILLION)
FIGURE 82 AUSTRALIA AI IN RPA SYSTEM CURRENT AND FUTURE TYPE ANALYSIS, 2025–2034, (USD MILLION)
FIGURE 83 AUSTRALIA AI IN RPA SYSTEM CURRENT AND FUTURE END USER ANALYSIS, 2025–2034, (USD MILLION)
FIGURE 84 CAMBODIA AI IN RPA SYSTEM CURRENT AND FUTURE TYPE ANALYSIS, 2025–2034, (USD MILLION)
FIGURE 85 CAMBODIA AI IN RPA SYSTEM CURRENT AND FUTURE END USER ANALYSIS, 2025–2034, (USD MILLION)
FIGURE 86 FIJI AI IN RPA SYSTEM CURRENT AND FUTURE TYPE ANALYSIS, 2025–2034, (USD MILLION)
FIGURE 87 FIJI AI IN RPA SYSTEM CURRENT AND FUTURE END USER ANALYSIS, 2025–2034, (USD MILLION)
FIGURE 88 INDONESIA AI IN RPA SYSTEM CURRENT AND FUTURE TYPE ANALYSIS, 2025–2034, (USD MILLION)
FIGURE 89 INDONESIA AI IN RPA SYSTEM CURRENT AND FUTURE END USER ANALYSIS, 2025–2034, (USD MILLION)
FIGURE 90 SOUTH KOREA AI IN RPA SYSTEM CURRENT AND FUTURE TYPE ANALYSIS, 2025–2034, (USD MILLION)
FIGURE 91 SOUTH KOREA AI IN RPA SYSTEM CURRENT AND FUTURE END USER ANALYSIS, 2025–2034, (USD MILLION)
FIGURE 92 REST OF EAST ASIA AND PACIFIC AI IN RPA SYSTEM CURRENT AND FUTURE TYPE ANALYSIS, 2025–2034, (USD MILLION)
FIGURE 93 REST OF EAST ASIA AND PACIFIC AI IN RPA SYSTEM CURRENT AND FUTURE END USER ANALYSIS, 2025–2034, (USD MILLION)
FIGURE 94 SEA AND SOUTH ASIA AI IN RPA SYSTEM CURRENT AND FUTURE MARKET VOLUME SHARE REGIONAL ANALYSIS, 2025–2034, (USD MILLION)
FIGURE 95 BANGLADESH AI IN RPA SYSTEM CURRENT AND FUTURE TYPE ANALYSIS, 2025–2034, (USD MILLION)
FIGURE 96 BANGLADESH AI IN RPA SYSTEM CURRENT AND FUTURE END USER ANALYSIS, 2025–2034, (USD MILLION)
FIGURE 97 NEW ZEALAND AI IN RPA SYSTEM CURRENT AND FUTURE TYPE ANALYSIS, 2025–2034, (USD MILLION)
FIGURE 98 NEW ZEALAND AI IN RPA SYSTEM CURRENT AND FUTURE END USER ANALYSIS, 2025–2034, (USD MILLION)
FIGURE 99 INDIA AI IN RPA SYSTEM CURRENT AND FUTURE TYPE ANALYSIS, 2025–2034, (USD MILLION)
FIGURE 100 INDIA AI IN RPA SYSTEM CURRENT AND FUTURE END USER ANALYSIS, 2025–2034, (USD MILLION)
FIGURE 101 SINGAPORE AI IN RPA SYSTEM CURRENT AND FUTURE TYPE ANALYSIS, 2025–2034, (USD MILLION)
FIGURE 102 SINGAPORE AI IN RPA SYSTEM CURRENT AND FUTURE END USER ANALYSIS, 2025–2034, (USD MILLION)
FIGURE 103 THAILAND AI IN RPA SYSTEM CURRENT AND FUTURE TYPE ANALYSIS, 2025–2034, (USD MILLION)
FIGURE 104 THAILAND AI IN RPA SYSTEM CURRENT AND FUTURE END USER ANALYSIS, 2025–2034, (USD MILLION)
FIGURE 105 TAIWAN AI IN RPA SYSTEM CURRENT AND FUTURE TYPE ANALYSIS, 2025–2034, (USD MILLION)
FIGURE 106 TAIWAN AI IN RPA SYSTEM CURRENT AND FUTURE END USER ANALYSIS, 2025–2034, (USD MILLION)
FIGURE 107 MALAYSIA AI IN RPA SYSTEM CURRENT AND FUTURE TYPE ANALYSIS, 2025–2034, (USD MILLION)
FIGURE 108 MALAYSIA AI IN RPA SYSTEM CURRENT AND FUTURE END USER ANALYSIS, 2025–2034, (USD MILLION)
FIGURE 109 REST OF SEA AND SOUTH ASIA AI IN RPA SYSTEM CURRENT AND FUTURE TYPE ANALYSIS, 2025–2034, (USD MILLION)
FIGURE 110 REST OF SEA AND SOUTH ASIA AI IN RPA SYSTEM CURRENT AND FUTURE END USER ANALYSIS, 2025–2034, (USD MILLION)
FIGURE 111 MIDDLE EAST AND AFRICA AI IN RPA SYSTEM CURRENT AND FUTURE MARKET VOLUME SHARE REGIONAL ANALYSIS, 2025–2034, (USD MILLION)
FIGURE 112 GCC COUNTRIES AI IN RPA SYSTEM CURRENT AND FUTURE TYPE ANALYSIS, 2025–2034, (USD MILLION)
FIGURE 113 GCC COUNTRIES AI IN RPA SYSTEM CURRENT AND FUTURE END USER ANALYSIS, 2025–2034, (USD MILLION)
FIGURE 114 SAUDI ARABIA AI IN RPA SYSTEM CURRENT AND FUTURE TYPE ANALYSIS, 2025–2034, (USD MILLION)
FIGURE 115 SAUDI ARABIA AI IN RPA SYSTEM CURRENT AND FUTURE END USER ANALYSIS, 2025–2034, (USD MILLION)
FIGURE 116 UAE AI IN RPA SYSTEM CURRENT AND FUTURE TYPE ANALYSIS, 2025–2034, (USD MILLION)
FIGURE 117 UAE AI IN RPA SYSTEM CURRENT AND FUTURE END USER ANALYSIS, 2025–2034, (USD MILLION)
FIGURE 118 BAHRAIN AI IN RPA SYSTEM CURRENT AND FUTURE TYPE ANALYSIS, 2025–2034, (USD MILLION)
FIGURE 119 BAHRAIN AI IN RPA SYSTEM CURRENT AND FUTURE END USER ANALYSIS, 2025–2034, (USD MILLION)
FIGURE 120 KUWAIT AI IN RPA SYSTEM CURRENT AND FUTURE TYPE ANALYSIS, 2025–2034, (USD MILLION)
FIGURE 121 KUWAIT AI IN RPA SYSTEM CURRENT AND FUTURE END USER ANALYSIS, 2025–2034, (USD MILLION)
FIGURE 122 OMAN AI IN RPA SYSTEM CURRENT AND FUTURE TYPE ANALYSIS, 2025–2034, (USD MILLION)
FIGURE 123 OMAN AI IN RPA SYSTEM CURRENT AND FUTURE END USER ANALYSIS, 2025–2034, (USD MILLION)
FIGURE 124 QATAR AI IN RPA SYSTEM CURRENT AND FUTURE TYPE ANALYSIS, 2025–2034, (USD MILLION)
FIGURE 125 QATAR AI IN RPA SYSTEM CURRENT AND FUTURE END USER ANALYSIS, 2025–2034, (USD MILLION)
FIGURE 126 EGYPT AI IN RPA SYSTEM CURRENT AND FUTURE TYPE ANALYSIS, 2025–2034, (USD MILLION)
FIGURE 127 EGYPT AI IN RPA SYSTEM CURRENT AND FUTURE END USER ANALYSIS, 2025–2034, (USD MILLION)
FIGURE 128 NIGERIA AI IN RPA SYSTEM CURRENT AND FUTURE TYPE ANALYSIS, 2025–2034, (USD MILLION)
FIGURE 129 NIGERIA AI IN RPA SYSTEM CURRENT AND FUTURE END USER ANALYSIS, 2025–2034, (USD MILLION)
FIGURE 130 SOUTH AFRICA AI IN RPA SYSTEM CURRENT AND FUTURE TYPE ANALYSIS, 2025–2034, (USD MILLION)
FIGURE 131 SOUTH AFRICA AI IN RPA SYSTEM CURRENT AND FUTURE END USER ANALYSIS, 2025–2034, (USD MILLION)
FIGURE 132 ISRAEL AI IN RPA SYSTEM CURRENT AND FUTURE TYPE ANALYSIS, 2025–2034, (USD MILLION)
FIGURE 133 ISRAEL AI IN RPA SYSTEM CURRENT AND FUTURE END USER ANALYSIS, 2025–2034, (USD MILLION)
FIGURE 134 REST OF MEA AI IN RPA SYSTEM CURRENT AND FUTURE TYPE ANALYSIS, 2025–2034, (USD MILLION)
FIGURE 135 REST OF MEA AI IN RPA SYSTEM CURRENT AND FUTURE END USER ANALYSIS, 2025–2034, (USD MILLION)
FIGURE 136 U. S. MARKET SHARE ANALYSIS BY TYPE (2024)
FIGURE 137 U. S. MARKET SHARE ANALYSIS BY END USER (2024)
FIGURE 138 CANADA MARKET SHARE ANALYSIS BY TYPE (2024)
FIGURE 139 CANADA MARKET SHARE ANALYSIS BY END USER (2024)
FIGURE 140 MEXICO MARKET SHARE ANALYSIS BY TYPE (2024)
FIGURE 141 MEXICO MARKET SHARE ANALYSIS BY END USER (2024)
FIGURE 142 CHINA MARKET SHARE ANALYSIS BY TYPE (2024)
FIGURE 143 CHINA MARKET SHARE ANALYSIS BY END USER (2024)
FIGURE 144 JAPAN MARKET SHARE ANALYSIS BY TYPE (2024)
FIGURE 145 JAPAN MARKET SHARE ANALYSIS BY END USER (2024)
FIGURE 146 INDIA MARKET SHARE ANALYSIS BY TYPE (2024)
FIGURE 147 INDIA MARKET SHARE ANALYSIS BY END USER (2024)
FIGURE 148 SOUTH KOREA MARKET SHARE ANALYSIS BY TYPE (2024)
FIGURE 149 SOUTH KOREA MARKET SHARE ANALYSIS BY END USER (2024)
FIGURE 150 SAUDI ARABIA MARKET SHARE ANALYSIS BY TYPE (2024)
FIGURE 151 SAUDI ARABIA MARKET SHARE ANALYSIS BY END USER (2024)
FIGURE 152 UAE MARKET SHARE ANALYSIS BY TYPE (2024)
FIGURE 153 UAE MARKET SHARE ANALYSIS BY END USER (2024)
FIGURE 154 EGYPT MARKET SHARE ANALYSIS BY TYPE (2024)
FIGURE 155 EGYPT MARKET SHARE ANALYSIS BY END USER (2024)
FIGURE 156 NIGERIA MARKET SHARE ANALYSIS BY TYPE (2024)
FIGURE 157 NIGERIA MARKET SHARE ANALYSIS BY END USER (2024)
FIGURE 158 SOUTH AFRICA MARKET SHARE ANALYSIS BY TYPE (2024)
FIGURE 159 SOUTH AFRICA MARKET SHARE ANALYSIS BY END USER (2024)
FIGURE 160 GERMANY MARKET SHARE ANALYSIS BY TYPE (2024)
FIGURE 161 GERMANY MARKET SHARE ANALYSIS BY END USER (2024)
FIGURE 162 FRANCE MARKET SHARE ANALYSIS BY TYPE (2024)
FIGURE 163 FRANCE MARKET SHARE ANALYSIS BY END USER (2024)
FIGURE 164 UK MARKET SHARE ANALYSIS BY TYPE (2024)
FIGURE 165 UK MARKET SHARE ANALYSIS BY END USER (2024)
FIGURE 166 SPAIN MARKET SHARE ANALYSIS BY TYPE (2024)
FIGURE 167 SPAIN MARKET SHARE ANALYSIS BY END USER (2024)
FIGURE 168 ITALY MARKET SHARE ANALYSIS BY TYPE (2024)
FIGURE 169 ITALY MARKET SHARE ANALYSIS BY END USER (2024)
FIGURE 170 BRAZIL MARKET SHARE ANALYSIS BY TYPE (2024)
FIGURE 171 BRAZIL MARKET SHARE ANALYSIS BY END USER (2024)
FIGURE 172 ARGENTINA MARKET SHARE ANALYSIS BY TYPE (2024)
FIGURE 173 ARGENTINA MARKET SHARE ANALYSIS BY END USER (2024)
FIGURE 174 COLUMBIA MARKET SHARE ANALYSIS BY TYPE (2024)
FIGURE 175 COLUMBIA MARKET SHARE ANALYSIS BY END USER (2024)
FIGURE 176 GLOBAL AI IN RPA SYSTEM CURRENT AND FUTURE MARKET KEY COUNTRY LEVEL ANALYSIS, 2024–2034, (USD MILLION)
FIGURE 177 FINANCIAL OVERVIEW:
Key Player Analysis
Automation Anywhere: A Leader/innovator in AI-powered automation, Automation Anywhere has pivoted its Automation Success Platform toward agentic, LLM-infused orchestration—notably through Automation Co-Pilot and AI Studio—to speed “prompt-to-workflow” creation and expand straight-through processing in service, finance, and IT ops. The company announced second-generation GenAI process models and a revamped build experience in 2024 aimed at 3× faster time-to-value, while reporting record quarterly performance on the back of GenAI-led deals—signals of durable enterprise demand.
Strategically, AA’s focus on embedded copilots (including integrations such as Amazon Q) and multi-session automation across business apps strengthens its positioning with business users while preserving enterprise controls; industry recognition (e.g., Gartner Magic Quadrant Leader, 2024) underpins premium placement in large accounts consolidating platforms around AI-first roadmaps.
Blue Prism: Now under SS&C, Blue Prism positions as a Leader in “agentic automation,” blending RPA with BPM and low/no-code to target end-to-end, governed workflows in regulated industries. SS&C’s 2022 portfolio unification and the Blue Prism Cloud managed platform expanded its delivery options, while the heritage emphasis on governance and reliability remains a differentiator for financial services and public sector buyers.
The SS&C umbrella gives Blue Prism deeper go-to-market leverage and cross-sell into a broad financial footprint; historically, Blue Prism reported use by 2,000+ businesses worldwide, and the brand’s current messaging centers on “agentic AI” readiness—appealing to buyers prioritizing auditability, role-based controls, and lifecycle compliance for AI-enabled digital workers.
EdgeVerve Systems Ltd: Positioned as an innovator, EdgeVerve’s AssistEdge (RPA) and XtractEdge (IDP) form a connected automation stack that unites human and digital workers across document-heavy, multi-system processes. In 2024, EdgeVerve was recognized as a Leader in IDC MarketScape for Worldwide Unstructured IDP, reinforcing credibility in AI-driven document understanding—a critical unlock for expanding automation into unstructured data flows.
Backed by Infosys, EdgeVerve benefits from a global delivery network and large enterprise relationships; the firm’s messaging emphasizes AI-first AssistEdge 20.0, flexible deployment (including SaaS and cloud-managed services), and tighter convergence with process discovery and analytics—an attractive mix for enterprises standardizing on governed, cross-functional automation.
FPT Software: FPT is a fast-rising challenger with akaBot, a cost-efficient RPA and hyperautomation suite gaining traction across Asia and increasingly in developed markets through partner channels. Corporate momentum is solid—FPT reported US$2.47B revenue and US$435M PBT in 2024, while akaBot secured high customer satisfaction markers (e.g., 100% willingness-to-recommend in a 2024 Gartner Peer Insights VoC note).
akaBot differentiates on price-performance, rapid deployment, and packaged use cases for back-office and document-centric workflows; the platform’s push into agentic/GenAI patterns and vertical templates (Japan and ASEAN focus) positions it well for SME and mid-enterprise adoption where outcome-based pricing and managed services are decisive.
Key Market Players
UiPath
FPT Software
Pegasystems
NICE
EdgeVerve Systems Ltd.
Automation Anywhere
OnviSource, Inc.
Blue Prism
NTT Advanced Technology Corp.
KOFAX, Inc.
Other Key Players
Driver:
AI-Enhanced RPA Accelerating Enterprise Efficiency and Throughput
By 2025, enterprises are under acute pressure to compress cycle times and lower cost-to-serve, making AI-enabled RPA a priority line item in digital operations budgets. Intelligent bots augmented with NLP, computer vision, and large language models are now automating judgment-heavy work—claims triage, KYC/AML checks, and invoice exception handling—lifting straight-through processing by 15–30% and cutting manual touchpoints by 25–40% in scaled programs. With the global AI in RPA market tracking a ~15%+ CAGR through 2034, platform consolidation and native AI copilots are accelerating time-to-value and expanding the automatable surface area beyond back office tasks.
Strategically, this efficiency flywheel redirects labor from rote processing to revenue and risk work, supporting margin defense in BFSI, healthcare, and retail while hard-wiring compliance. Vendors that fuse process mining, orchestration, and model governance into a single stack are capturing outsized share as buyers standardize on fewer, enterprise-grade platforms.
Restraint:
High Ownership Costs and Compliance Delays Slowing Adoption
Total cost of ownership remains the gating factor for many programs. Enterprise-grade deployments often require USD 0.5–2.0 million in upfront spend (licenses, systems integration, data engineering, security hardening), with 30–45% of budgets consumed by ongoing run operations—model monitoring, prompt maintenance, and change management. In regulated environments, aligning AI models with controls can elongate initial rollout by 4–6 months, delaying ROI and straining sponsorship.
The strategic implication is a two-speed market: highly regulated incumbents move deliberately to mitigate model risk and data-residency exposure, while midmarket adopters wait for packaged, outcome-priced offerings. Vendors that cannot prove reliable payback windows (e.g., 12–18 months) risk elongating sales cycles and higher churn at renewal.
Opportunity:
SME-Focused Cloud RPA and GenAI Assistants Unlocking New Growth
SMEs represent the fastest-expanding demand pool as cloud delivery, usage-based pricing, and vertical templates lower adoption barriers. From 2025 onward, SME-focused bundles (pretrained document skills, connectors, and compliance presets) are poised to grow at ~15–20% CAGR, potentially adding USD 4–6 billion in incremental revenue by 2030. GenAI assistants that translate natural-language intents into automations reduce build times by 50%+, making small teams viable automation owners.
Strategically, capturing SME wallets requires channel-led distribution, pay-as-you-go tiers, and outcome SLAs (e.g., first-contact resolution, days-sales-outstanding improvements). Providers that pair low-code design with managed services will widen the addressable market and build durable annuities.
GenAI-infused hyperautomation is reshaping product roadmaps and buyer expectations. Leading platforms (e.g., UiPath, Microsoft, Automation Anywhere, SS&C Blue Prism, SAP) are embedding LLMs, retrieval-augmented generation, and autonomous agents to enable prompt-to-workflow creation, self-healing bots, and real-time exception handling. Cloud adoption is accelerating—industry share of cloud-deployed AI-RPA is on pace to rise from ~25% in 2024 to ~40%+ by 2026—as enterprises favor elastic inference and continuous feature delivery.
The strategic impact is a pivot from task automation to end-to-end, insight-driven operations: process mining feeds opportunity maps, agents orchestrate cross-system work, and robotic process intelligence closes the loop with KPI-level telemetry. Vendors that prove secure, governed GenAI at scale—auditable prompts, bias controls, and lineage—will set the standard for enterprise adoption and capture premium pricing.
Recent Developments
Dec 2024 – Automation Anywhere: Reported its fifth consecutive non-GAAP profitable quarter, with 2× growth in AI Agent deals and a claim to #1 in Agentic Process Automation following major platform wins. The results signal accelerating enterprise adoption of agentic automation and strengthen AA’s leadership narrative heading into 2025.
Feb 2025 – UiPath: Introduced Long Running Workflows in Studio (Feb 26), enabling BPMN-modeled, human-in-the-loop processes that span UI, API, and decision tasks—expanding beyond task bots to orchestrate complex, end-to-end business processes. This deepens UiPath’s role as a process platform and improves fit for regulated, multi-step operations.
Mar 2025 – NICE: Launched CXone Mpower Orchestrator, positioned as an end-to-end AI automation layer unifying virtual agents, live agents, and back-office workflows; NICE highlights adoption across 25,000+ organizations and 85+ Fortune 100 customers as the base for scale. The release elevates NICE from CX tooling to full workflow orchestration, intensifying competition at the AI service-automation boundary.
Apr 2025 – Tungsten Automation (Kofax): Rolled out InvoiceAgility 2025.3 with expanded global e-invoicing compliance, including updates for Germany, France, Malaysia, new support for China, and alignment with Italy’s technical specification effective April 1, 2025. The update reinforces Tungsten’s compliance moat in document-centric automation, a key buying criterion for finance operations.
Jul 2025 – Pegasystems: Announced a five-year collaboration with AWS that brings Amazon Bedrock and AWS Transform to Pega Blueprint, aimed at speeding legacy modernization with agentic AI workflows and multi-model access. The partnership broadens Pega’s modernization beachhead and ties its platform more tightly to hyperscaler AI ecosystems.
Sep 2025 – Automation Anywhere: Reported >60% of wins from GenAI deals in Q2 FY26, 20%+ RPO growth, and multiple AWS milestones (including AWS Generative AI Competency and agents listed in AWS Marketplace’s AI Agents & Tools). These signals point to durable demand, ecosystem leverage, and expanding product differentiation around its Process Reasoning Engine.
Frequently Asked Questions
How big is the AI in RPA Market?
The AI in RPA Market will rise from USD 4.9B in 2024 to USD 21.7B by 2034, driven by intelligent automation, cognitive workflows, and enterprise demand for scalable digital operations.
Who are the major players in the AI in RPA Market?
UiPath, FPT Software, Pegasystems, NICE, EdgeVerve Systems Ltd., Automation Anywhere, OnviSource, Inc., Blue Prism, NTT Advanced Technology Corp., KOFAX, Inc., Other Key Players
Which segments covered the AI in RPA Market?
By Type (Software, Service), By Deployment Mode (Cloud-based, On-premise), By Organization Size (Large Enterprises, Small & Medium Enterprises), By Application (BFSI, Pharma & Healthcare, Retail & Consumer Goods, Information Technology & Telecom, Communication and Media & Education, Other Applications)
How can this market research report help my business make strategic decisions?
Our market research reports provide actionable intelligence, including verified market size data, CAGR projections, competitive benchmarking, and segment-level opportunity analysis. These insights support strategic planning, investment decisions, product development, and market entry strategies for enterprises and startups alike.
How frequently is the data updated?
We continuously monitor industry developments and update our reports to reflect regulatory changes, technological advancements, and macroeconomic shifts. Updated editions ensure you receive the latest market intelligence.