
- Home
- Industries
 Aerospace And Defence
 Agriculture
 Automotive And Transportation
 Banking And Finance
 Business
 Chemicals And Materials
 Consumer And Retail
 Electronics And Semiconductors
 Food And Beverages
 Machinery & Equipments
 Manufacturing And Construction
 Medical Devices
 Others
 Pharmaceuticals And Healthcare
 Power And Energy
 Sports
 Technology
- Services
- News Room
- About us
- Contact Us
-
AI in Sampler Market Size, Share & Growth Forecast | 9.2% CAGR
Global AI in Sampler Market Size, Share & Analysis By Product Type (Portable, Desktop, Others), By Technique (Impact Air Sampler, Surface Air Sampler, Impinge Air Sampler, Real-Time Samplers, Compressed Air Sample, Others), By Application (Research and Academic Institutes, Pharmaceutical, Hospitals, Food and Beverages, Others), By Distribution Channel (Direct Sales, Indirect Sales) Industry Overview, Market Dynamics, Automation Trends, Competitive Landscape & Forecast 2025–2034

Report Overview
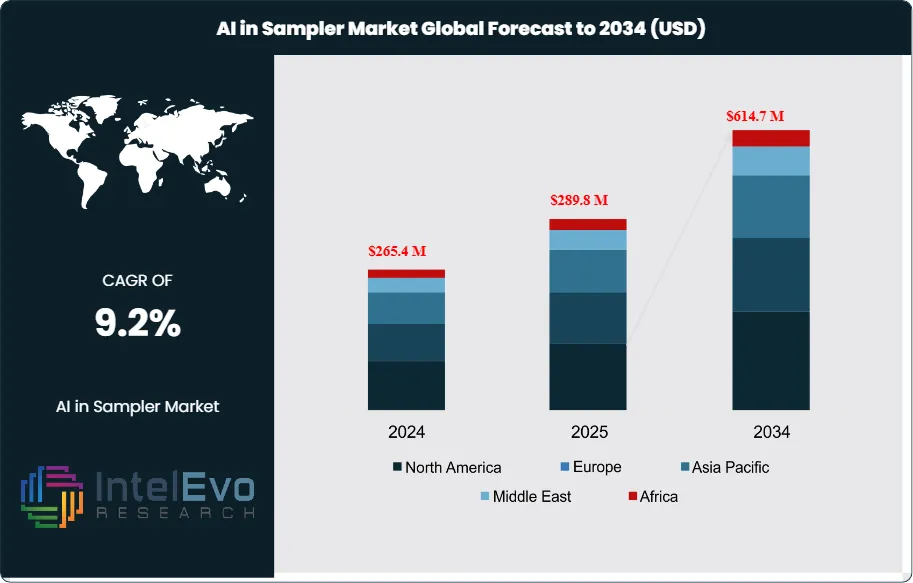
The Air Sampler Market is projected to grow from USD 265.4 Million in 2024 to approximately USD 614.7 Million by 2034, expanding at a CAGR of around 9.2% during 2025–2034. Rising global concerns over air quality and workplace safety are driving strong adoption of advanced air sampling devices across healthcare, pharmaceuticals, and environmental monitoring sectors. Stringent regulatory standards for pollution control and contamination assessment are further propelling product innovation and market expansion.
Get More Information about this report -
Request Free Sample ReportWith increasing focus on smart, portable, and automated air sampling solutions, manufacturers are aligning with sustainability and digital monitoring trends worldwide. This driven by stricter air quality regulations and heightened focus on environmental and occupational health, offering strategic opportunities for equipment manufacturers, healthcare providers, and industrial operators.
Air sampling technologies are essential for assessing airborne pollutants, contaminants, and gases, making them indispensable tools in safeguarding public health, ensuring workplace safety, and enabling regulatory compliance. The market has evolved significantly as governments, industries, and environmental bodies increase investments in monitoring infrastructure to address rising concerns about pollution, climate change, and workplace exposure risks.
Product diversity remains a defining feature of the market. Active samplers, which mechanically draw air through filters, are widely adopted for their precision in environmental monitoring, while passive samplers, which capture particles through natural diffusion, provide cost-effective solutions for long-term exposure studies. High-volume samplers are extensively used in environmental applications for detecting trace pollutants at low concentrations, whereas compact, personal samplers are gaining traction in occupational health to monitor worker exposure to hazardous particulates.
Growth in this market is underpinned by a combination of regulatory pressure and increasing awareness of air quality’s direct impact on health outcomes. Industries such as pharmaceuticals, healthcare, construction, and manufacturing are expanding the use of advanced air samplers to comply with stringent standards and minimize liability associated with unsafe air conditions. However, the high cost of advanced devices and calibration requirements present adoption challenges, particularly in cost-sensitive regions.
Technological innovation continues to reshape the competitive landscape. Modern air samplers are increasingly equipped with digital interfaces, wireless connectivity, and enhanced sensitivity, enabling real-time monitoring and integration with broader environmental data systems. These advancements not only improve the accuracy of pollutant detection but also support predictive modeling and faster regulatory reporting.
Regionally, North America and Europe represent mature markets due to strict environmental frameworks and occupational health laws, while Asia-Pacific is emerging as a high-growth region, driven by rapid industrialization, urban pollution, and government-led air quality initiatives. Looking ahead, the market’s trajectory will be shaped by the convergence of stricter regulation, technological sophistication, and growing global demand for air quality solutions that balance efficiency, compliance, and cost-effectiveness.
, By Technique (Impact Air Sampler, Surface Air Sampler, Impinge Air Sampler, Real-Time Samplers, Compressed Air Sample, Others), By Application (Research and Academic Institutes, Pharmaceutical, Hospitals, Food and Beverages, Others), By Distribution Channel (Direct Sales, Indirect Sales) Industry Overview, Market Dynamics, Automation Trends, Competitive Landscape & Forecast 2025–2034")
Key Takeaways
- Market Growth: The global Air Sampler Market, valued at USD 265.4 Million in 2024, is projected to reach USD 614.7 Million by 2034, expanding at a CAGR of 9.2%. Growth is driven by rising regulatory scrutiny on air quality, increasing environmental awareness, and heightened demand for workplace safety monitoring.
- Product Type: Portable air samplers represented more than 69.1% of global revenues in 2023, supported by their mobility, ease of deployment, and suitability for both occupational and environmental applications. Their adoption continues to rise in healthcare and construction sectors where on-site monitoring is critical.
- Technique: Impact air samplers accounted for over 36.5% of the market in 2023, favored for their accuracy in capturing biological and particulate matter. Their reliability in pharmaceutical cleanrooms and food safety testing reinforces their leadership.
- Application: Research and academic institutes generated 35.5% of global demand in 2023, reflecting extensive use of air samplers in environmental monitoring, epidemiological studies, and laboratory-based air quality assessments.
- Distribution Channel: Indirect sales channels held a dominant 70.2% market share in 2023, with distributors providing broad access and technical support across diverse geographies.
- Driver: Stricter international air quality standards and occupational health regulations are compelling organizations to invest in advanced air sampling technologies for compliance and risk mitigation.
- Restraint: High acquisition and maintenance costs of advanced air sampling devices limit adoption in cost-sensitive markets, particularly among small enterprises and government agencies in developing regions.
- Opportunity: Asia-Pacific presents significant growth opportunities, with rapid industrialization, urban pollution challenges, and expanding pharmaceutical and healthcare industries driving accelerated adoption of air samplers.
- Trend: Integration of digital features such as real-time monitoring, IoT connectivity, and cloud-based analytics is reshaping product development, enabling faster decision-making and predictive air quality assessments.
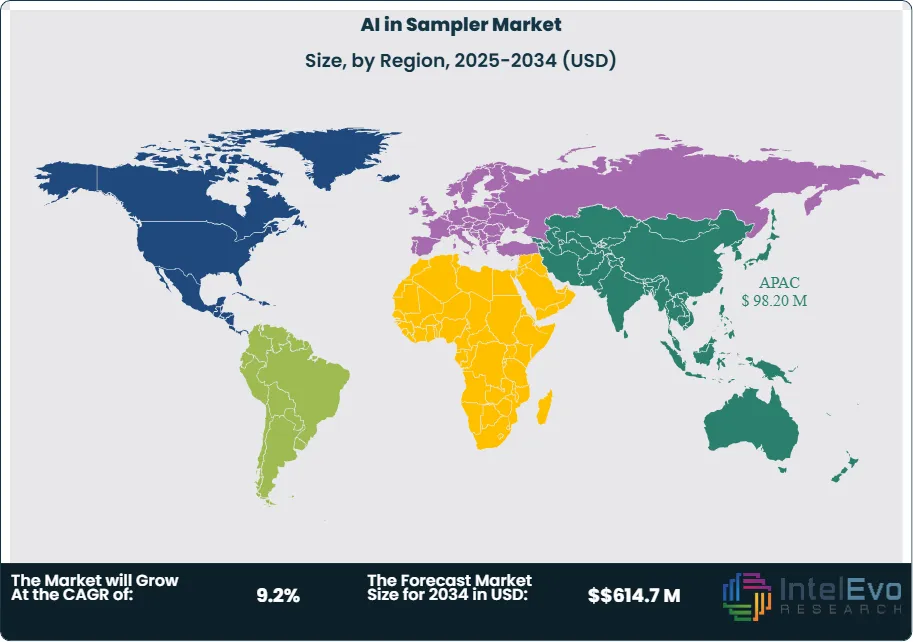
- Regional Analysis: Asia-Pacific led the market with a 36.7% share in 2023, fueled by healthcare and pharmaceutical demand, while North America and Europe remain strong due to established regulatory frameworks. Emerging economies in Latin America and the Middle East are expected to adopt air sampling solutions more actively in response to rising urban pollution levels.
Product Analysis
As of 2025, portable air samplers continue to dominate the market, accounting for more than two-thirds of global revenues. Their versatility, ease of deployment, and ability to provide on-site measurements make them indispensable across diverse settings, ranging from industrial plants to outdoor monitoring stations. Their growing role in occupational safety assessments and rapid environmental testing further underpins demand.
Desktop air samplers, while less mobile, maintain a critical role in laboratories, cleanrooms, and controlled manufacturing facilities. These systems are valued for their precision in continuous monitoring, ensuring compliance with stringent air quality standards in highly sensitive environments such as pharmaceuticals and biotechnology.
Other product categories, including high-volume samplers and bioaerosol-specific devices, address niche requirements such as environmental research and infection control in healthcare. Although smaller in share, these specialized systems remain strategically important for sectors with unique monitoring challenges.
Technique Analysis
Impact air samplers remain the leading technique in 2025, capturing over one-third of market share. Their effectiveness in detecting a wide spectrum of airborne particles ensures widespread use in environmental surveillance and workplace safety programs.
Surface air samplers are increasingly adopted in industries with strict sterility demands, such as pharmaceuticals and food production, where they play a crucial role in contamination prevention. Similarly, impinge air samplers, which capture particles in liquid media, remain highly relevant in R&D applications requiring detailed chemical or biological analysis.
Real-time samplers are gaining momentum as urban pollution and industrial emissions drive demand for instantaneous data. These devices enable quick decision-making by providing continuous feedback on air quality. In parallel, compressed air samplers are becoming standard in industrial facilities, where clean compressed air is essential for ensuring equipment longevity and maintaining product quality.
Application Analysis
Research and academic institutions continue to represent the largest end-user segment, contributing over one-third of market revenues in 2025. Their reliance on air sampling technologies for advanced studies in environmental science, epidemiology, and occupational health underscores their strategic importance.
The pharmaceutical sector remains a critical driver of demand, as air samplers are essential in sterile manufacturing environments. Strict global regulatory requirements around contamination control are accelerating adoption across production lines. Hospitals also rely heavily on these technologies to monitor airborne pathogens, reinforcing infection control protocols and ensuring safer patient care environments.
In the food and beverage sector, air samplers safeguard product integrity by detecting airborne contaminants that could compromise safety or shelf life. With stricter global food safety standards, this segment is experiencing steady growth, as producers increasingly view air monitoring as an integral part of quality assurance.
Distribution Channel Analysis
In 2025, indirect sales channels remain dominant, accounting for more than 70% of global distribution. Established networks of distributors and resellers provide manufacturers with broad market access, particularly in regions where direct manufacturer presence is limited. This approach has proven effective in scaling availability and servicing demand across both developed and emerging markets.
Direct sales, while smaller in share, remain highly strategic. Large enterprises and specialized industries often prefer direct engagement with manufacturers to secure customized solutions, ongoing technical support, and faster response times. For companies producing high-performance or niche devices, direct sales continue to serve as a channel for differentiation and client retention.
Regional Analysis
Asia-Pacific leads the global air sampler market with a share exceeding one-third, supported by rapid industrialization, heightened environmental concerns, and expanding pharmaceutical manufacturing capacity. Countries such as China, India, Japan, and South Korea are central to this growth, as rising investments in healthcare infrastructure and stricter air quality regulations accelerate adoption. The region is projected to surpass USD 90 million in value by the close of the forecast period.
North America remains a mature yet steadily growing market, characterized by robust healthcare infrastructure, strong regulatory enforcement, and early adoption of advanced sampling technologies. Demand is particularly high in pharmaceutical manufacturing, cleanroom applications, and occupational safety programs. Europe, meanwhile, continues to prioritize air quality monitoring in line with its stringent environmental and workplace health standards, sustaining a strong position in the global landscape.
Get More Information about this report -
Request Free Sample ReportMarket Key Segments
By Product Type
- Portable
- Desktop
- Others
By Technique
- Impact Air Sampler
- Surface Air Sampler
- Impinge Air Sampler
- Real-Time Samplers
- Compressed Air Sample
- Others
By Application
- Research and Academic Institutes
- Pharmaceutical
- Hospitals
- Food and Beverages
- Others
By Distribution Channel
- Direct Sales
- Indirect Sales
Regions
- North America
- Latin America
- East Asia And Pacific
- Sea And South Asia
- Eastern Europe
- Western Europe
- Middle East & Africa
| Report Attribute | Details |
| Market size (2024) | $265.4 M |
| Forecast Revenue (2034) | $614.7 M |
| CAGR (2024-2034) | 9.2% |
| Historical data | 2020-2023 |
| Base Year For Estimation | 2024 |
| Forecast Period | 2025-2034 |
| Report coverage | Revenue Forecast, Competitive Landscape, Market Dynamics, Growth Factors, Trends and Recent Developments |
| Segments covered | By Product Type (Portable, Desktop, Others), By Technique (Impact Air Sampler, Surface Air Sampler, Impinge Air Sampler, Real-Time Samplers, Compressed Air Sample, Others), By Application (Research and Academic Institutes, Pharmaceutical, Hospitals, Food and Beverages, Others), By Distribution Channel (Direct Sales, Indirect Sales) |
| Research Methodology |
|
| Regional scope |
|
| Competitive Landscape | Particle Measuring Systems, Sartorius, Aquqria srl, MBV AG, Emtek, Bertin Technologies, Tianjin Hengao, Sarstedt, LightHouse, Multitech Enviro Analytical, bioMerieux, IUL, Orum International, VWR, Beijing Jiance, SIBATA, Qingdao Junray, Climet Instruments |
| Customization Scope | Customization for segments, region/country-level will be provided. Moreover, additional customization can be done based on the requirements. |
| Pricing and Purchase Options | Avail customized purchase options to meet your exact research needs. We have three licenses to opt for: Single User License, Multi-User License (Up to 5 Users), Corporate Use License (Unlimited User and Printable PDF). |
, By Technique (Impact Air Sampler, Surface Air Sampler, Impinge Air Sampler, Real-Time Samplers, Compressed Air Sample, Others), By Application (Research and Academic Institutes, Pharmaceutical, Hospitals, Food and Beverages, Others), By Distribution Channel (Direct Sales, Indirect Sales) Industry Overview, Market Dynamics, Automation Trends, Competitive Landscape & Forecast 2025–2034")
, By Technique (Impact Air Sampler, Surface Air Sampler, Impinge Air Sampler, Real-Time Samplers, Compressed Air Sample, Others), By Application (Research and Academic Institutes, Pharmaceutical, Hospitals, Food and Beverages, Others), By Distribution Channel (Direct Sales, Indirect Sales) Industry Overview, Market Dynamics, Automation Trends, Competitive Landscape & Forecast 2025–2034")
, By Technique (Impact Air Sampler, Surface Air Sampler, Impinge Air Sampler, Real-Time Samplers, Compressed Air Sample, Others), By Application (Research and Academic Institutes, Pharmaceutical, Hospitals, Food and Beverages, Others), By Distribution Channel (Direct Sales, Indirect Sales) Industry Overview, Market Dynamics, Automation Trends, Competitive Landscape & Forecast 2025–2034")
Frequently Asked Questions
How big is the AI in Sampler Market?
The AI in Sampler Market is projected to grow from USD 265.4 Million in 2024 to USD 614.7 Million by 2034, at a CAGR of 9.2%. Rising air quality concerns, stricter environmental regulations, and demand for smart, portable, and automated sampling devices are fueling market expansion across healthcare and industrial sectors.
Who are the major players in the AI in Sampler Market?
Particle Measuring Systems, Sartorius, Aquqria srl, MBV AG, Emtek, Bertin Technologies, Tianjin Hengao, Sarstedt, LightHouse, Multitech Enviro Analytical, bioMerieux, IUL, Orum International, VWR, Beijing Jiance, SIBATA, Qingdao Junray, Climet Instruments
Which segments covered the AI in Sampler Market?
By Product Type (Portable, Desktop, Others), By Technique (Impact Air Sampler, Surface Air Sampler, Impinge Air Sampler, Real-Time Samplers, Compressed Air Sample, Others), By Application (Research and Academic Institutes, Pharmaceutical, Hospitals, Food and Beverages, Others), By Distribution Channel (Direct Sales, Indirect Sales)
How can this market research report help my business make strategic decisions?
Our market research reports provide actionable intelligence, including verified market size data, CAGR projections, competitive benchmarking, and segment-level opportunity analysis. These insights support strategic planning, investment decisions, product development, and market entry strategies for enterprises and startups alike.
How frequently is the data updated?
We continuously monitor industry developments and update our reports to reflect regulatory changes, technological advancements, and macroeconomic shifts. Updated editions ensure you receive the latest market intelligence.

Select Licence Type
Connect with our sales team
Why IntelEvoResearch
100%
Customer
Satisfaction
24x7+
Availability - we are always
there when you need us
200+
Fortune 50 Companies trust
IntelEvoResearch
80%
of our reports are exclusive
and first in the industry
100%
more data
and analysis
1000+
reports published
till date