AI in Smart Cities Market Size, Trends & Forecast | 29.1% CAGR
Global AI in Smart Cities Market Size, Share & Analysis By Component (Hardware, Software, Services), By Application (Smart Mobility, Energy Management, Healthcare, Public Safety and Security, Waste Management, Environmental Monitoring, Water Management), By Deployment Mode (Cloud-based, On-premises), By End User (Utilities, Transportation Companies, Healthcare Providers, Real Estate Developers) Industry Regions & Key Players – Urban Digitalization Trends & Forecast 2025–2034
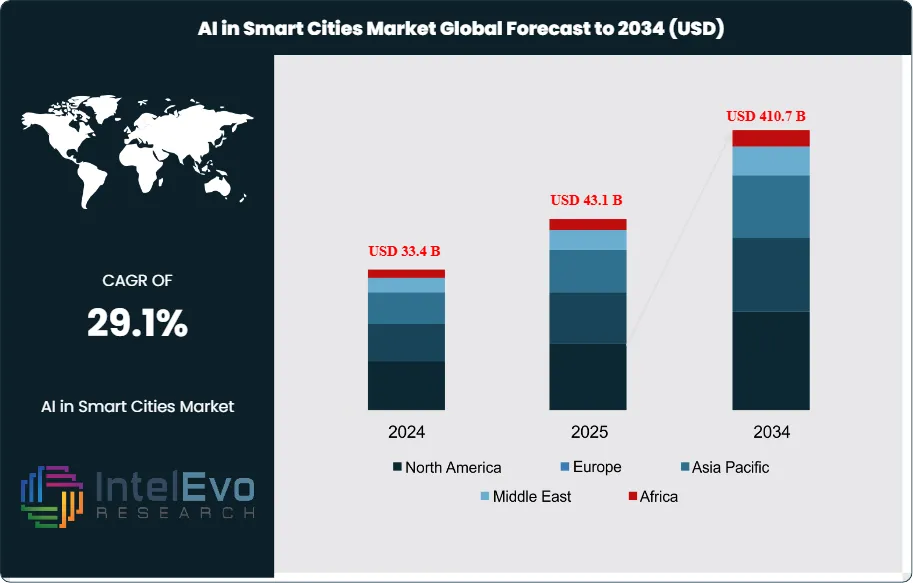
The AI in Smart Cities Market is projected to grow from USD 33.4 Billion in 2024 to approximately USD 410.7 Billion by 2034, expanding at a CAGR of around 29.1% during 2025–2034. Smart city initiatives are accelerating globally as governments and enterprises adopt AI to enhance traffic management, energy efficiency, and public safety systems. Advancements in IoT sensors, digital twins, and connected urban infrastructure are creating data-driven, automated city environments. With increasing investments in sustainable urban development, AI is becoming the backbone of next-generation city planning and real-time civic operations.
Artificial intelligence (AI) has emerged as a critical enabler of smart city development, transforming how urban areas manage infrastructure, resources, and citizen services. By integrating AI with Internet of Things (IoT) networks, cloud platforms, and advanced connectivity, cities are leveraging real-time data to optimize transportation, energy distribution, healthcare, waste management, and governance. This convergence is driving a rapid shift toward more efficient, resilient, and sustainable urban ecosystems, ultimately enhancing the quality of life for residents.
The market’s momentum is reinforced by surging urbanization, rising demand for sustainable city solutions, and the growing emphasis on digital-first public infrastructure. AI is increasingly deployed in traffic control systems to reduce congestion, predictive analytics for energy conservation, and intelligent surveillance for enhanced safety. For municipalities, these solutions not only improve operational efficiency but also support long-term urban planning by enabling data-driven decision-making. At the same time, citizens benefit from improved mobility, faster access to public services, and more transparent governance models.
Technological advancements are playing a pivotal role in shaping market growth. Machine learning, natural language processing, and predictive modeling are revolutionizing smart city operations, while cloud-based deployment ensures scalability and cost efficiency. In addition, AI-powered environmental monitoring solutions are supporting sustainability initiatives by reducing pollution levels and enabling more efficient resource allocation. Ambitious government-led programs, such as Dubai’s AI Roadmap, illustrate the forward momentum of this sector, with objectives ranging from autonomous mobility to fully digitized service delivery.
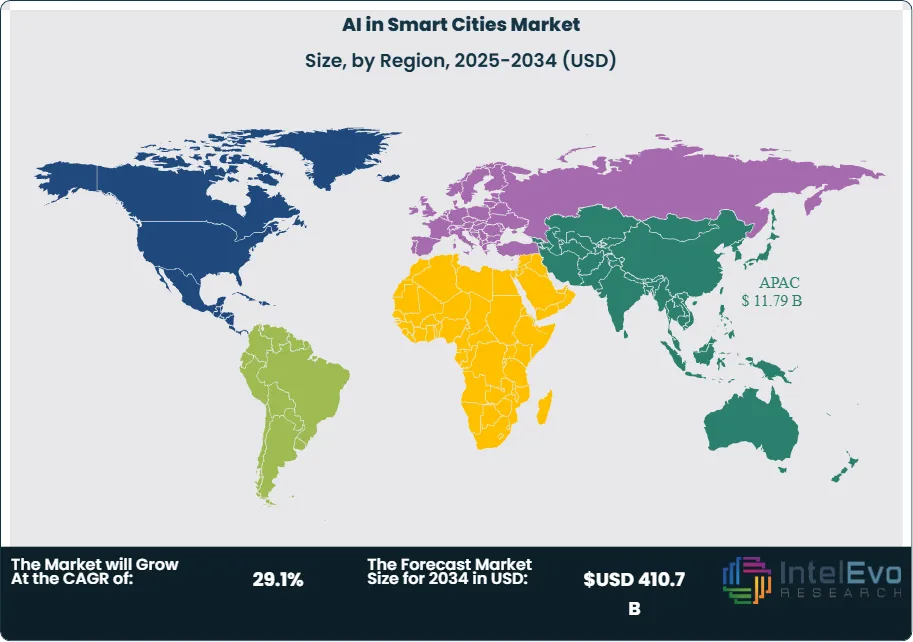
Regionally, Asia-Pacific leads the market, accounting for over 35% of global revenue in 2023, supported by large-scale government investments, robust 5G rollouts, and widespread adoption of IoT-enabled infrastructure in countries such as China, Japan, and South Korea. North America and Europe are also critical investment hotspots, driven by public-private partnerships and the integration of AI into advanced mobility and sustainability programs. Emerging economies in Latin America and the Middle East are beginning to accelerate adoption through targeted smart city initiatives, offering strong potential for growth.
Overall, the adoption of AI in smart cities is advancing beyond experimentation to become a cornerstone of urban transformation. With rising demand for intelligent, connected, and sustainable environments, the market is expected to experience robust expansion over the next decade, attracting significant investments from technology providers, governments, and infrastructure developers worldwide.
Market Growth: The global AI in Smart Cities Market is projected to expand from USD 33.4 Billion in 2024 to USD 410.7 billion by 2034, advancing at a CAGR of 29.1% during 2024–2033. Growth is being fueled by rapid urbanization, rising demand for sustainable urban solutions, and the integration of AI with IoT and cloud platforms.
Offering (Software): Software solutions accounted for more than 59.3% of market share in 2023, driven by demand for AI-powered analytics, predictive modeling, and citizen service platforms. The scalability and adaptability of software are making it the backbone of smart city initiatives.
Application (Transportation): Transportation emerged as the largest application area, holding over 38.7% share, as AI is increasingly applied to traffic management, smart mobility platforms, and autonomous vehicle infrastructure to reduce congestion and improve safety.
Deployment (Cloud): Cloud-based AI solutions captured more than 53.5% of the market in 2023, reflecting the preference of municipalities for scalable, cost-effective deployment models that support real-time data processing and multi-stakeholder collaboration.
Driver: The growing focus on improving citizen engagement and operational efficiency is accelerating adoption. AI-enabled tools are being used to optimize energy grids, enhance public safety, and streamline access to government services, thereby strengthening urban resilience.
Restraint: The lack of interoperability and standardization across AI platforms and smart city systems continues to hinder seamless integration, raising costs and slowing deployment, particularly in developing economies.
Opportunity: Rising demand for sustainability-driven solutions—such as AI-powered energy management, water conservation, and environmental monitoring—presents high-growth potential, especially as governments align with net-zero and climate-resilient city goals.
Trend: The convergence of AI with emerging technologies such as digital twins, edge computing, and 5G is reshaping smart city operations, enabling predictive urban planning, real-time resource allocation, and autonomous mobility services.
Regional Analysis: Asia-Pacific led the market in 2023 with over 35.3% share (USD 10.9 billion), supported by large-scale government programs in China, Japan, and South Korea. North America and Europe remain strong innovation hubs, while the Middle East is rapidly investing in AI-driven mega city projects like NEOM in Saudi Arabia.
Application Analysis
In 2025, transportation and smart mobility continue to dominate AI adoption in smart cities, building on their substantial share of nearly 39% in recent years. AI-driven platforms are being deployed to optimize traffic flow, manage congestion, and reduce carbon emissions through intelligent routing and predictive maintenance. The integration of IoT-enabled traffic signals, smart parking systems, and autonomous fleet management solutions is transforming urban mobility, with leading cities in Asia and Europe already reporting measurable reductions in travel delays and pollution levels.
Beyond mobility, applications such as public safety, healthcare, and energy management are gaining momentum. Cities are increasingly using AI for predictive policing, environmental monitoring, and smart grids that balance energy demand with renewable supply. For example, municipalities are adopting AI-driven environmental sensors to reduce air pollution and enhance disaster preparedness. These developments reflect the expanding scope of AI beyond transport, positioning it as a multi-sectoral enabler of urban resilience and sustainability.
Deployment Mode Analysis
Cloud-based AI platforms have emerged as the preferred deployment model for smart city projects in 2025, maintaining a dominant share above 50%. Their scalability and flexibility make them particularly valuable for municipalities managing vast data volumes from sensors, utilities, and connected infrastructure. Cloud deployment also reduces upfront capital investment, enabling smaller cities to implement AI solutions through subscription-based or pay-as-you-go models. This shift toward operating expenditure models is accelerating adoption across regions with budget constraints.
On-premises solutions, while more limited, remain relevant for applications requiring heightened security, such as law enforcement databases and sensitive citizen records. However, advancements in hybrid cloud and edge computing are narrowing this gap, allowing cities to balance data sovereignty with the scalability of cloud systems. This evolution underscores how deployment models are adapting to the complex realities of urban governance.
End User Analysis
In 2025, real estate developers represent one of the most influential end-user groups within the AI in smart cities market. Their adoption of AI spans smart building design, predictive maintenance, and energy-efficient infrastructure planning. Developers are leveraging AI-enhanced building management systems to optimize HVAC performance, reduce energy costs, and meet tightening sustainability regulations. These solutions not only improve operational efficiency but also align with growing investor and resident demand for greener, digitally connected living environments.
Utilities and transportation companies are also critical adopters, using AI to modernize grid management and mobility systems. For instance, AI-powered demand forecasting enables utilities to integrate renewable energy sources more effectively, while transportation firms deploy intelligent analytics to support multimodal transport hubs. Collectively, these end-user segments are driving AI’s transition from experimental projects to core operational systems in urban development.
By Regional Analysis
The Asia-Pacific region continues to lead the global AI in smart cities market in 2025, sustaining its share of more than one-third of total revenues. China, India, and Japan are at the forefront, propelled by large-scale government programs such as India’s Smart Cities Mission and China’s urban modernization initiatives. These programs emphasize AI adoption in traffic control, surveillance, and energy distribution, reinforcing APAC’s status as the global hub for smart city innovation.
North America and Europe remain highly competitive markets, with North America focusing on AI-powered citizen engagement platforms and sustainability-oriented energy management, while Europe emphasizes digital twins and green urban planning aligned with the EU’s climate goals. Meanwhile, the Middle East is accelerating investments in mega-projects such as Saudi Arabia’s NEOM, embedding AI into infrastructure from inception. Latin America and Africa, though at earlier stages of adoption, are beginning to roll out AI-enabled public safety and water management projects, highlighting significant untapped potential in emerging economies.
By Component (Hardware, Software, Services (Consulting, Maintenance, Training)), By Application (Smart Mobility, Energy Management, Healthcare, Public Safety and Security, Waste Management, Environmental Monitoring, Water Management, Others), By Deployment Mode (Cloud-based, On-premises), By End User (Utilities, Transportation Companies, Healthcare Providers, Real Estate Developers, Others (Education, Retail))
Research Methodology
Primary Research- 100 Interviews of Stakeholders
Secondary Research
Desk Research
Regional scope
North America (United States, Canada, Mexico)
Latin America (Brazil, Argentina, Columbia)
East Asia And Pacific (China, Japan, South Korea, Australia, Cambodia, Fiji, Indonesia)
Sea And South Asia (India, Singapore, Thailand, Taiwan, Malaysia)
Eastern Europe (Poland, Russia, Czech Republic, Romania)
Western Europe (Germany, U.K., France, Spain, Itlay)
Middle East & Africa (GCC Countries, Egypt, Nigeria, South Africa, Israel)
Competitive Landscape
ABB Ltd, Alibaba Group Holding Ltd., Cisco Systems, Inc., Gorilla Technology, Hayden AI, Hitachi, Ltd., Honeywell International Inc., Huawei Technologies Co., Ltd., IBM Corporation, Intel Corporation, Metropolis Technologies, Microsoft Corporation, NEC Corporation, Nodeflux, omniQ, Oracle Corporation, Paradox Engineering SA, Samsara Inc., SAP SE, Schneider Electric, Siemens AG
Customization Scope
Customization for segments, region/country-level will be provided. Moreover, additional customization can be done based on the requirements.
Pricing and Purchase Options
Avail customized purchase options to meet your exact research needs. We have three licenses to opt for: Single User License, Multi-User License (Up to 5 Users), Corporate Use License (Unlimited User and Printable PDF).
TABLE OF CONTENTS
1. EXECUTIVE SUMMARY
1.1. MARKET SNAPSHOT
1.2. KEY FINDINGS & INSIGHTS
1.3. ANALYST RECOMMENDATIONS
1.4. FUTURE OUTLOOK
2. RESEARCH METHODOLOGY
2.1. MARKET DEFINITION & SCOPE
2.2. RESEARCH OBJECTIVES: PRIMARY & SECONDARY DATA SOURCES
2.3. DATA COLLECTION SOURCES
2.3.1. COVERAGE OF 100+ PRIMARY RESEARCH/CONSULTATION CALLS WITH INDUSTRY STAKEHOLDERS
FIGURE 17 NORTH AMERICA AI IN SMART CITIES CURRENT AND FUTURE TYPE ANALYSIS, 2025–2034, (USD MILLION)
FIGURE 18 NORTH AMERICA AI IN SMART CITIES CURRENT AND FUTURE END USER ANALYSIS, 2025–2034, (USD MILLION)
FIGURE 19 MARKET SHARE BY COUNTRY
FIGURE 20 LATIN AMERICA AI IN SMART CITIES CURRENT AND FUTURE TYPE ANALYSIS, 2025–2034, (USD MILLION)
FIGURE 21 LATIN AMERICA AI IN SMART CITIES CURRENT AND FUTURE END USER ANALYSIS, 2025–2034, (USD MILLION)
FIGURE 22 MARKET SHARE BY COUNTRY
FIGURE 23 EASTERN EUROPE AI IN SMART CITIES CURRENT AND FUTURE TYPE ANALYSIS, 2025–2034, (USD MILLION)
FIGURE 24 EASTERN EUROPE AI IN SMART CITIES CURRENT AND FUTURE END USER ANALYSIS, 2025–2034, (USD MILLION)
FIGURE 25 MARKET SHARE BY COUNTRY
FIGURE 26 WESTERN EUROPE AI IN SMART CITIES CURRENT AND FUTURE TYPE ANALYSIS, 2025–2034, (USD MILLION)
FIGURE 27 WESTERN EUROPE AI IN SMART CITIES CURRENT AND FUTURE END USER ANALYSIS, 2025–2034, (USD MILLION)
FIGURE 28 MARKET SHARE BY COUNTRY
FIGURE 29 EAST ASIA AND PACIFIC AI IN SMART CITIES CURRENT AND FUTURE TYPE ANALYSIS, 2025–2034, (USD MILLION)
FIGURE 30 EAST ASIA AND PACIFIC AI IN SMART CITIES CURRENT AND FUTURE END USER ANALYSIS, 2025–2034, (USD MILLION)
FIGURE 31 MARKET SHARE BY COUNTRY
FIGURE 32 SEA AND SOUTH ASIA AI IN SMART CITIES CURRENT AND FUTURE TYPE ANALYSIS, 2025–2034, (USD MILLION)
FIGURE 33 SEA AND SOUTH ASIA AI IN SMART CITIES CURRENT AND FUTURE END USER ANALYSIS, 2025–2034, (USD MILLION)
FIGURE 34 MARKET SHARE BY COUNTRY
FIGURE 35 MIDDLE EAST AND AFRICA AI IN SMART CITIES CURRENT AND FUTURE TYPE ANALYSIS, 2025–2034, (USD MILLION)
FIGURE 36 MIDDLE EAST AND AFRICA AI IN SMART CITIES CURRENT AND FUTURE END USER ANALYSIS, 2025–2034, (USD MILLION)
FIGURE 37 NORTH AMERICA AI IN SMART CITIES CURRENT AND FUTURE MARKET VOLUME SHARE REGIONAL ANALYSIS, 2025–2034, (USD MILLION)
FIGURE 38 U.S. AI IN SMART CITIES CURRENT AND FUTURE TYPE ANALYSIS, 2025–2034, (USD MILLION)
FIGURE 39 U.S. AI IN SMART CITIES CURRENT AND FUTURE END USER ANALYSIS, 2025–2034, (USD MILLION)
FIGURE 40 CANADA AI IN SMART CITIES CURRENT AND FUTURE TYPE ANALYSIS, 2025–2034, (USD MILLION)
FIGURE 41 CANADA AI IN SMART CITIES CURRENT AND FUTURE END USER ANALYSIS, 2025–2034, (USD MILLION)
FIGURE 42 LATIN AMERICA AI IN SMART CITIES CURRENT AND FUTURE MARKET VOLUME SHARE REGIONAL ANALYSIS, 2025–2034, (USD MILLION)
FIGURE 43 MEXICO AI IN SMART CITIES CURRENT AND FUTURE TYPE ANALYSIS, 2025–2034, (USD MILLION)
FIGURE 44 MEXICO AI IN SMART CITIES CURRENT AND FUTURE END USER ANALYSIS, 2025–2034, (USD MILLION)
FIGURE 45 BRAZIL AI IN SMART CITIES CURRENT AND FUTURE TYPE ANALYSIS, 2025–2034, (USD MILLION)
FIGURE 46 BRAZIL AI IN SMART CITIES CURRENT AND FUTURE END USER ANALYSIS, 2025–2034, (USD MILLION)
FIGURE 47 ARGENTINA AI IN SMART CITIES CURRENT AND FUTURE TYPE ANALYSIS, 2025–2034, (USD MILLION)
FIGURE 48 ARGENTINA AI IN SMART CITIES CURRENT AND FUTURE END USER ANALYSIS, 2025–2034, (USD MILLION)
FIGURE 49 COLUMBIA AI IN SMART CITIES CURRENT AND FUTURE TYPE ANALYSIS, 2025–2034, (USD MILLION)
FIGURE 50 COLUMBIA AI IN SMART CITIES CURRENT AND FUTURE END USER ANALYSIS, 2025–2034, (USD MILLION)
FIGURE 51 REST OF LATIN AMERICA AI IN SMART CITIES CURRENT AND FUTURE TYPE ANALYSIS, 2025–2034, (USD MILLION)
FIGURE 52 REST OF LATIN AMERICA AI IN SMART CITIES CURRENT AND FUTURE END USER ANALYSIS, 2025–2034, (USD MILLION)
FIGURE 53 EASTERN EUROPE AI IN SMART CITIES CURRENT AND FUTURE MARKET VOLUME SHARE REGIONAL ANALYSIS, 2025–2034, (USD MILLION)
FIGURE 54 POLAND AI IN SMART CITIES CURRENT AND FUTURE TYPE ANALYSIS, 2025–2034, (USD MILLION)
FIGURE 55 POLAND AI IN SMART CITIES CURRENT AND FUTURE END USER ANALYSIS, 2025–2034, (USD MILLION)
FIGURE 56 RUSSIA AI IN SMART CITIES CURRENT AND FUTURE TYPE ANALYSIS, 2025–2034, (USD MILLION)
FIGURE 57 RUSSIA AI IN SMART CITIES CURRENT AND FUTURE END USER ANALYSIS, 2025–2034, (USD MILLION)
FIGURE 58 CZECH REPUBLIC AI IN SMART CITIES CURRENT AND FUTURE TYPE ANALYSIS, 2025–2034, (USD MILLION)
FIGURE 59 CZECH REPUBLIC AI IN SMART CITIES CURRENT AND FUTURE END USER ANALYSIS, 2025–2034, (USD MILLION)
FIGURE 60 ROMANIA AI IN SMART CITIES CURRENT AND FUTURE TYPE ANALYSIS, 2025–2034, (USD MILLION)
FIGURE 61 ROMANIA AI IN SMART CITIES CURRENT AND FUTURE END USER ANALYSIS, 2025–2034, (USD MILLION)
FIGURE 62 REST OF EASTERN EUROPE AI IN SMART CITIES CURRENT AND FUTURE TYPE ANALYSIS, 2025–2034, (USD MILLION)
FIGURE 63 REST OF EASTERN EUROPE AI IN SMART CITIES CURRENT AND FUTURE END USER ANALYSIS, 2025–2034, (USD MILLION)
FIGURE 64 WESTERN EUROPE AI IN SMART CITIES CURRENT AND FUTURE MARKET VOLUME SHARE REGIONAL ANALYSIS, 2025–2034, (USD MILLION)
FIGURE 65 GERMANY AI IN SMART CITIES CURRENT AND FUTURE TYPE ANALYSIS, 2025–2034, (USD MILLION)
FIGURE 66 GERMANY AI IN SMART CITIES CURRENT AND FUTURE END USER ANALYSIS, 2025–2034, (USD MILLION)
FIGURE 67 FRANCE AI IN SMART CITIES CURRENT AND FUTURE TYPE ANALYSIS, 2025–2034, (USD MILLION)
FIGURE 68 FRANCE AI IN SMART CITIES CURRENT AND FUTURE END USER ANALYSIS, 2025–2034, (USD MILLION)
FIGURE 69 UK AI IN SMART CITIES CURRENT AND FUTURE TYPE ANALYSIS, 2025–2034, (USD MILLION)
FIGURE 70 UK AI IN SMART CITIES CURRENT AND FUTURE END USER ANALYSIS, 2025–2034, (USD MILLION)
FIGURE 71 SPAIN AI IN SMART CITIES CURRENT AND FUTURE TYPE ANALYSIS, 2025–2034, (USD MILLION)
FIGURE 72 SPAIN AI IN SMART CITIES CURRENT AND FUTURE END USER ANALYSIS, 2025–2034, (USD MILLION)
FIGURE 73 ITALY AI IN SMART CITIES CURRENT AND FUTURE TYPE ANALYSIS, 2025–2034, (USD MILLION)
FIGURE 74 ITALY AI IN SMART CITIES CURRENT AND FUTURE END USER ANALYSIS, 2025–2034, (USD MILLION)
FIGURE 75 REST OF WESTERN EUROPE AI IN SMART CITIES CURRENT AND FUTURE TYPE ANALYSIS, 2025–2034, (USD MILLION)
FIGURE 76 REST OF WESTERN EUROPE AI IN SMART CITIES CURRENT AND FUTURE END USER ANALYSIS, 2025–2034, (USD MILLION)
FIGURE 77 EAST ASIA AND PACIFIC AI IN SMART CITIES CURRENT AND FUTURE MARKET VOLUME SHARE REGIONAL ANALYSIS, 2025–2034, (USD MILLION)
FIGURE 78 CHINA AI IN SMART CITIES CURRENT AND FUTURE TYPE ANALYSIS, 2025–2034, (USD MILLION)
FIGURE 79 CHINA AI IN SMART CITIES CURRENT AND FUTURE END USER ANALYSIS, 2025–2034, (USD MILLION)
FIGURE 80 JAPAN AI IN SMART CITIES CURRENT AND FUTURE TYPE ANALYSIS, 2025–2034, (USD MILLION)
FIGURE 81 JAPAN AI IN SMART CITIES CURRENT AND FUTURE END USER ANALYSIS, 2025–2034, (USD MILLION)
FIGURE 82 AUSTRALIA AI IN SMART CITIES CURRENT AND FUTURE TYPE ANALYSIS, 2025–2034, (USD MILLION)
FIGURE 83 AUSTRALIA AI IN SMART CITIES CURRENT AND FUTURE END USER ANALYSIS, 2025–2034, (USD MILLION)
FIGURE 84 CAMBODIA AI IN SMART CITIES CURRENT AND FUTURE TYPE ANALYSIS, 2025–2034, (USD MILLION)
FIGURE 85 CAMBODIA AI IN SMART CITIES CURRENT AND FUTURE END USER ANALYSIS, 2025–2034, (USD MILLION)
FIGURE 86 FIJI AI IN SMART CITIES CURRENT AND FUTURE TYPE ANALYSIS, 2025–2034, (USD MILLION)
FIGURE 87 FIJI AI IN SMART CITIES CURRENT AND FUTURE END USER ANALYSIS, 2025–2034, (USD MILLION)
FIGURE 88 INDONESIA AI IN SMART CITIES CURRENT AND FUTURE TYPE ANALYSIS, 2025–2034, (USD MILLION)
FIGURE 89 INDONESIA AI IN SMART CITIES CURRENT AND FUTURE END USER ANALYSIS, 2025–2034, (USD MILLION)
FIGURE 90 SOUTH KOREA AI IN SMART CITIES CURRENT AND FUTURE TYPE ANALYSIS, 2025–2034, (USD MILLION)
FIGURE 91 SOUTH KOREA AI IN SMART CITIES CURRENT AND FUTURE END USER ANALYSIS, 2025–2034, (USD MILLION)
FIGURE 92 REST OF EAST ASIA AND PACIFIC AI IN SMART CITIES CURRENT AND FUTURE TYPE ANALYSIS, 2025–2034, (USD MILLION)
FIGURE 93 REST OF EAST ASIA AND PACIFIC AI IN SMART CITIES CURRENT AND FUTURE END USER ANALYSIS, 2025–2034, (USD MILLION)
FIGURE 94 SEA AND SOUTH ASIA AI IN SMART CITIES CURRENT AND FUTURE MARKET VOLUME SHARE REGIONAL ANALYSIS, 2025–2034, (USD MILLION)
FIGURE 95 BANGLADESH AI IN SMART CITIES CURRENT AND FUTURE TYPE ANALYSIS, 2025–2034, (USD MILLION)
FIGURE 96 BANGLADESH AI IN SMART CITIES CURRENT AND FUTURE END USER ANALYSIS, 2025–2034, (USD MILLION)
FIGURE 97 NEW ZEALAND AI IN SMART CITIES CURRENT AND FUTURE TYPE ANALYSIS, 2025–2034, (USD MILLION)
FIGURE 98 NEW ZEALAND AI IN SMART CITIES CURRENT AND FUTURE END USER ANALYSIS, 2025–2034, (USD MILLION)
FIGURE 99 INDIA AI IN SMART CITIES CURRENT AND FUTURE TYPE ANALYSIS, 2025–2034, (USD MILLION)
FIGURE 100 INDIA AI IN SMART CITIES CURRENT AND FUTURE END USER ANALYSIS, 2025–2034, (USD MILLION)
FIGURE 101 SINGAPORE AI IN SMART CITIES CURRENT AND FUTURE TYPE ANALYSIS, 2025–2034, (USD MILLION)
FIGURE 102 SINGAPORE AI IN SMART CITIES CURRENT AND FUTURE END USER ANALYSIS, 2025–2034, (USD MILLION)
FIGURE 103 THAILAND AI IN SMART CITIES CURRENT AND FUTURE TYPE ANALYSIS, 2025–2034, (USD MILLION)
FIGURE 104 THAILAND AI IN SMART CITIES CURRENT AND FUTURE END USER ANALYSIS, 2025–2034, (USD MILLION)
FIGURE 105 TAIWAN AI IN SMART CITIES CURRENT AND FUTURE TYPE ANALYSIS, 2025–2034, (USD MILLION)
FIGURE 106 TAIWAN AI IN SMART CITIES CURRENT AND FUTURE END USER ANALYSIS, 2025–2034, (USD MILLION)
FIGURE 107 MALAYSIA AI IN SMART CITIES CURRENT AND FUTURE TYPE ANALYSIS, 2025–2034, (USD MILLION)
FIGURE 108 MALAYSIA AI IN SMART CITIES CURRENT AND FUTURE END USER ANALYSIS, 2025–2034, (USD MILLION)
FIGURE 109 REST OF SEA AND SOUTH ASIA AI IN SMART CITIES CURRENT AND FUTURE TYPE ANALYSIS, 2025–2034, (USD MILLION)
FIGURE 110 REST OF SEA AND SOUTH ASIA AI IN SMART CITIES CURRENT AND FUTURE END USER ANALYSIS, 2025–2034, (USD MILLION)
FIGURE 111 MIDDLE EAST AND AFRICA AI IN SMART CITIES CURRENT AND FUTURE MARKET VOLUME SHARE REGIONAL ANALYSIS, 2025–2034, (USD MILLION)
FIGURE 112 GCC COUNTRIES AI IN SMART CITIES CURRENT AND FUTURE TYPE ANALYSIS, 2025–2034, (USD MILLION)
FIGURE 113 GCC COUNTRIES AI IN SMART CITIES CURRENT AND FUTURE END USER ANALYSIS, 2025–2034, (USD MILLION)
FIGURE 114 SAUDI ARABIA AI IN SMART CITIES CURRENT AND FUTURE TYPE ANALYSIS, 2025–2034, (USD MILLION)
FIGURE 115 SAUDI ARABIA AI IN SMART CITIES CURRENT AND FUTURE END USER ANALYSIS, 2025–2034, (USD MILLION)
FIGURE 116 UAE AI IN SMART CITIES CURRENT AND FUTURE TYPE ANALYSIS, 2025–2034, (USD MILLION)
FIGURE 117 UAE AI IN SMART CITIES CURRENT AND FUTURE END USER ANALYSIS, 2025–2034, (USD MILLION)
FIGURE 118 BAHRAIN AI IN SMART CITIES CURRENT AND FUTURE TYPE ANALYSIS, 2025–2034, (USD MILLION)
FIGURE 119 BAHRAIN AI IN SMART CITIES CURRENT AND FUTURE END USER ANALYSIS, 2025–2034, (USD MILLION)
FIGURE 120 KUWAIT AI IN SMART CITIES CURRENT AND FUTURE TYPE ANALYSIS, 2025–2034, (USD MILLION)
FIGURE 121 KUWAIT AI IN SMART CITIES CURRENT AND FUTURE END USER ANALYSIS, 2025–2034, (USD MILLION)
FIGURE 122 OMAN AI IN SMART CITIES CURRENT AND FUTURE TYPE ANALYSIS, 2025–2034, (USD MILLION)
FIGURE 123 OMAN AI IN SMART CITIES CURRENT AND FUTURE END USER ANALYSIS, 2025–2034, (USD MILLION)
FIGURE 124 QATAR AI IN SMART CITIES CURRENT AND FUTURE TYPE ANALYSIS, 2025–2034, (USD MILLION)
FIGURE 125 QATAR AI IN SMART CITIES CURRENT AND FUTURE END USER ANALYSIS, 2025–2034, (USD MILLION)
FIGURE 126 EGYPT AI IN SMART CITIES CURRENT AND FUTURE TYPE ANALYSIS, 2025–2034, (USD MILLION)
FIGURE 127 EGYPT AI IN SMART CITIES CURRENT AND FUTURE END USER ANALYSIS, 2025–2034, (USD MILLION)
FIGURE 128 NIGERIA AI IN SMART CITIES CURRENT AND FUTURE TYPE ANALYSIS, 2025–2034, (USD MILLION)
FIGURE 129 NIGERIA AI IN SMART CITIES CURRENT AND FUTURE END USER ANALYSIS, 2025–2034, (USD MILLION)
FIGURE 130 SOUTH AFRICA AI IN SMART CITIES CURRENT AND FUTURE TYPE ANALYSIS, 2025–2034, (USD MILLION)
FIGURE 131 SOUTH AFRICA AI IN SMART CITIES CURRENT AND FUTURE END USER ANALYSIS, 2025–2034, (USD MILLION)
FIGURE 132 ISRAEL AI IN SMART CITIES CURRENT AND FUTURE TYPE ANALYSIS, 2025–2034, (USD MILLION)
FIGURE 133 ISRAEL AI IN SMART CITIES CURRENT AND FUTURE END USER ANALYSIS, 2025–2034, (USD MILLION)
FIGURE 134 REST OF MEA AI IN SMART CITIES CURRENT AND FUTURE TYPE ANALYSIS, 2025–2034, (USD MILLION)
FIGURE 135 REST OF MEA AI IN SMART CITIES CURRENT AND FUTURE END USER ANALYSIS, 2025–2034, (USD MILLION)
FIGURE 136 U. S. MARKET SHARE ANALYSIS BY TYPE (2024)
FIGURE 137 U. S. MARKET SHARE ANALYSIS BY END USER (2024)
FIGURE 138 CANADA MARKET SHARE ANALYSIS BY TYPE (2024)
FIGURE 139 CANADA MARKET SHARE ANALYSIS BY END USER (2024)
FIGURE 140 MEXICO MARKET SHARE ANALYSIS BY TYPE (2024)
FIGURE 141 MEXICO MARKET SHARE ANALYSIS BY END USER (2024)
FIGURE 142 CHINA MARKET SHARE ANALYSIS BY TYPE (2024)
FIGURE 143 CHINA MARKET SHARE ANALYSIS BY END USER (2024)
FIGURE 144 JAPAN MARKET SHARE ANALYSIS BY TYPE (2024)
FIGURE 145 JAPAN MARKET SHARE ANALYSIS BY END USER (2024)
FIGURE 146 INDIA MARKET SHARE ANALYSIS BY TYPE (2024)
FIGURE 147 INDIA MARKET SHARE ANALYSIS BY END USER (2024)
FIGURE 148 SOUTH KOREA MARKET SHARE ANALYSIS BY TYPE (2024)
FIGURE 149 SOUTH KOREA MARKET SHARE ANALYSIS BY END USER (2024)
FIGURE 150 SAUDI ARABIA MARKET SHARE ANALYSIS BY TYPE (2024)
FIGURE 151 SAUDI ARABIA MARKET SHARE ANALYSIS BY END USER (2024)
FIGURE 152 UAE MARKET SHARE ANALYSIS BY TYPE (2024)
FIGURE 153 UAE MARKET SHARE ANALYSIS BY END USER (2024)
FIGURE 154 EGYPT MARKET SHARE ANALYSIS BY TYPE (2024)
FIGURE 155 EGYPT MARKET SHARE ANALYSIS BY END USER (2024)
FIGURE 156 NIGERIA MARKET SHARE ANALYSIS BY TYPE (2024)
FIGURE 157 NIGERIA MARKET SHARE ANALYSIS BY END USER (2024)
FIGURE 158 SOUTH AFRICA MARKET SHARE ANALYSIS BY TYPE (2024)
FIGURE 159 SOUTH AFRICA MARKET SHARE ANALYSIS BY END USER (2024)
FIGURE 160 GERMANY MARKET SHARE ANALYSIS BY TYPE (2024)
FIGURE 161 GERMANY MARKET SHARE ANALYSIS BY END USER (2024)
FIGURE 162 FRANCE MARKET SHARE ANALYSIS BY TYPE (2024)
FIGURE 163 FRANCE MARKET SHARE ANALYSIS BY END USER (2024)
FIGURE 164 UK MARKET SHARE ANALYSIS BY TYPE (2024)
FIGURE 165 UK MARKET SHARE ANALYSIS BY END USER (2024)
FIGURE 166 SPAIN MARKET SHARE ANALYSIS BY TYPE (2024)
FIGURE 167 SPAIN MARKET SHARE ANALYSIS BY END USER (2024)
FIGURE 168 ITALY MARKET SHARE ANALYSIS BY TYPE (2024)
FIGURE 169 ITALY MARKET SHARE ANALYSIS BY END USER (2024)
FIGURE 170 BRAZIL MARKET SHARE ANALYSIS BY TYPE (2024)
FIGURE 171 BRAZIL MARKET SHARE ANALYSIS BY END USER (2024)
FIGURE 172 ARGENTINA MARKET SHARE ANALYSIS BY TYPE (2024)
FIGURE 173 ARGENTINA MARKET SHARE ANALYSIS BY END USER (2024)
FIGURE 174 COLUMBIA MARKET SHARE ANALYSIS BY TYPE (2024)
FIGURE 175 COLUMBIA MARKET SHARE ANALYSIS BY END USER (2024)
FIGURE 176 GLOBAL AI IN SMART CITIES CURRENT AND FUTURE MARKET KEY COUNTRY LEVEL ANALYSIS, 2024–2034, (USD MILLION)
FIGURE 177 FINANCIAL OVERVIEW:
Key Player Analysis
IBM Corporation: IBM remains a pivotal force in advancing AI adoption within smart city ecosystems, with a strong focus on data analytics, digital twins, and AI-driven infrastructure optimization. Its Watson AI platform and Maximo Application Suite have been widely applied to predictive maintenance, energy optimization, and city asset management, making IBM a trusted partner for municipalities seeking operational efficiency. In 2025, IBM has expanded its strategic collaborations with urban developers and utility providers, integrating AI with IoT-enabled smart grids to enhance sustainability outcomes. The company’s emphasis on open standards and interoperability positions it as a leader in bridging fragmented urban technology ecosystems and ensuring scalability across diverse city infrastructures.
Microsoft Corporation: Microsoft continues to strengthen its role as a leading innovator in the smart cities market through the integration of Azure AI, Microsoft Mesh, and its productivity ecosystem. The company’s strategy in 2025 emphasizes leveraging cloud-based AI platforms to enable scalable urban services ranging from citizen engagement applications to real-time traffic management. Through partnerships with governments and real estate developers, Microsoft has embedded AI-driven digital twins into large-scale urban projects, allowing planners to simulate resource allocation and sustainability scenarios with high precision. Its ability to unify AI, edge computing, and collaboration tools like Teams provides a comprehensive environment that facilitates both city management and stakeholder engagement, solidifying its position as a top-tier player in this domain.
Google LLC: Google is shaping the AI in smart cities landscape by capitalizing on its strengths in cloud infrastructure, AI research, and geospatial analytics. In 2025, the company has extended Google Cloud’s AI solutions into urban planning, mobility, and public safety applications, enabling real-time insights from massive datasets generated by IoT devices. With Android XR and Gemini AI integration, Google is expanding its role in immersive smart city experiences, combining predictive AI with spatial computing to enhance citizen services and mobility planning. Its competitive edge lies in combining advanced AI algorithms with vast data processing capabilities, which allows municipalities to improve efficiency while fostering innovation in sustainability-focused projects such as energy optimization and environmental monitoring.
Intel Corporation: Intel plays a critical role in enabling the hardware backbone of AI-powered smart city ecosystems. In 2025, the company’s focus has been on deploying AI-optimized processors and edge computing solutions to support latency-sensitive applications such as autonomous transport, real-time surveillance, and energy grid monitoring. By collaborating with city authorities and solution providers, Intel has positioned its edge AI platforms as essential to scaling smart infrastructure without overwhelming centralized cloud systems. Furthermore, Intel’s investments in sustainability-driven semiconductor design highlight its alignment with global efforts to reduce the carbon footprint of urban technology deployments. By combining hardware innovation with partnerships across the smart city value chain, Intel is solidifying its reputation as a foundational enabler of next-generation urban intelligence.
Key Market Players
ABB Ltd
Alibaba Group Holding Ltd.
Cisco Systems, Inc.
Gorilla Technology
Hayden AI
Hitachi, Ltd.
Honeywell International Inc.
Huawei Technologies Co., Ltd.
IBM Corporation
Intel Corporation
Metropolis Technologies
Microsoft Corporation
NEC Corporation
Nodeflux
omniQ
Oracle Corporation
Paradox Engineering SA
Samsara Inc.
SAP SE
Schneider Electric
Siemens AG
Driver
Urban Growth Demands Intelligent Infrastructure
As of 2025, accelerating urbanization is placing immense pressure on city systems, from mobility networks to energy grids. Artificial intelligence has become a cornerstone technology for managing these complexities, offering automation, predictive analytics, and real-time optimization that improve both efficiency and sustainability. For instance, AI-enabled traffic systems are reducing congestion in densely populated cities, while predictive energy management platforms are balancing renewable supply with fluctuating demand. In rapidly expanding economies across Asia-Pacific, large-scale government programs are embedding AI directly into new urban infrastructure, positioning smart technologies as essential to long-term city resilience and livability.
Restraint
Cost and Legacy System Limitations
Despite its transformative potential, widespread adoption of AI in smart cities continues to be hindered by high upfront implementation costs and infrastructure challenges. Deploying advanced AI systems requires significant investment in IoT sensors, high-speed networks, and data centers—resources that many municipalities, particularly in emerging markets, struggle to finance. Moreover, integrating AI into aging legacy infrastructure often demands extensive upgrades, creating additional financial and technical barriers. These constraints slow down deployment cycles and exacerbate the digital divide between advanced and developing urban regions.
Opportunity
AI-Driven Sustainability and IoT Integration
The convergence of AI with IoT is unlocking major opportunities for sustainability-focused urban development. Smart grids powered by AI are enabling efficient energy distribution, while AI-enhanced water and waste management platforms are reducing resource consumption and operational costs. Cities are also piloting AI-driven environmental monitoring systems that track air quality, carbon emissions, and climate risks, helping governments align with net-zero and climate resilience objectives. As regulatory pressure for sustainable urbanization intensifies, technology providers that deliver AI-enabled green solutions are well positioned to capture long-term growth.
Trend
Convergence of AI with Digital Twins and Edge Computing
A defining trend in 2025 is the integration of AI with digital twin models and edge computing capabilities. Digital twins—virtual replicas of physical city assets—are being combined with AI to simulate scenarios ranging from traffic flows to disaster response, enabling more informed planning decisions. Simultaneously, edge AI is allowing cities to process data closer to its source, reducing latency in applications such as autonomous mobility and public safety surveillance. This convergence is accelerating the shift from reactive to predictive urban management, marking a pivotal step toward fully data-driven smart city ecosystems.
Recent Developments
December 2024 – Smart Cities Summit: During a December event, leaders shared compelling AI-driven use cases across transportation, infrastructure, and urban services, signalling growing maturity and interest in integrated AI smart city systems. This highlights accelerating attention and readiness among urban planners for deploying AI technologies that enhance operational and environmental efficiency.
June 2025 – OpenAI & IndiaAI Mission (Government of India): OpenAI signed an MoU with the IndiaAI Mission to launch the OpenAI Academy, offering GenAI-based training in multiple Indian languages and providing API credits to 50 startups or fellows. This initiative supports AI capacity-building across education, smart cities, and sustainability sectors. This move enhances local generative AI skills and fosters ecosystem growth for smart city applications in India.
July 2025 – MLA Proposal for AI Traffic Management in Lucknow (India): A comprehensive proposal was submitted to implement an AI-driven Intelligent Traffic Management System (AI-ITMS) in Lucknow, aiming to reduce travel times by 25%, cut fuel consumption by 20%, and improve ambulance response by 40%. The initiative envisions creating an AI commission and assembling stakeholders—including IIT Kanpur and C-DAC—for pilot implementation. This positions Lucknow as a potential national benchmark for AI-enabled urban mobility and governance modernization.
July 2025 – Brisbane, Australia – ‘Smarter Suburban Corridors’ Traffic Trial: Brisbane launched plans for an AI-enabled traffic management trial to modernize legacy infrastructure. The system aims to reduce commute times by over 20%, with phased deployment starting in August 2026 in anticipation of population growth and the 2032 Olympics. This demonstrates proactive infrastructure modernization through AI, laying groundwork for scalable smart mobility ahead of major urban expansions.
August 2025 – San Francisco Adopts Microsoft Copilot: The City of San Francisco became the largest U.S. city client to roll out Microsoft Copilot (powered by GPT-4o), after a successful pilot involving over 2,000 city employees. The tool streamlines administrative tasks like document summarization and data analysis, freeing staff to focus on service delivery. This underscores AI’s growing role in municipal operations and sets a model for intelligent public-sector service automation.