AI in Space Exploration Market Size 2025–2034 | CAGR 33.2%
Global AI in Space Exploration Market Size, Share & Growth Analysis By Type (Rovers, Robotic Arms, Space Probes), By Application (Robotics, Remote Sensing & Monitoring, Data Analytics, Asteroid Mining, Manned Vehicles & Reusable Launch Systems, Communications, Remote Missions), By End-User (Government, Commercial), By Region & Key Players – Industry Overview, Market Dynamics, Technology Trends, Competitive Landscape & Forecast 2026–2034
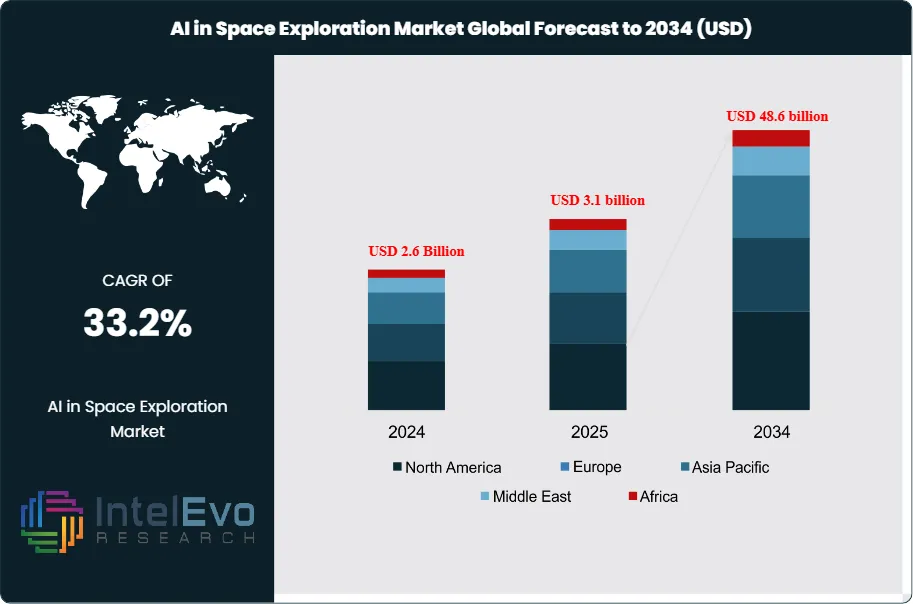
The AI in Space Exploration Market is estimated to reach approximately USD 3.1 billion in 2025 and is projected to expand to around USD 48.6 billion by 2034, registering a very strong compound annual growth rate (CAGR) of about 33.2% during the forecast period from 2026 to 2034. Market growth is fueled by rising deployment of AI-driven autonomous navigation, mission planning, and data analytics across satellite operations, deep-space missions, and planetary exploration programs. Space agencies and private players increasingly rely on AI to process massive volumes of satellite imagery, optimize spacecraft performance, and enable real-time decision-making in remote environments. Additionally, growing investments in space commercialization, defense space programs, and AI-enabled robotics are accelerating adoption, positioning AI as a critical enabler of next-generation space exploration and long-term market expansion.
This growth reflects the rapid integration of artificial intelligence into mission planning, spacecraft operations, and data analysis, and the broader digitalization of space infrastructure. In 2023, the market stood at USD 2.0 Billion, with North America accounting for over 40% of global revenue, supported by strong space agency budgets and early adoption of autonomous mission technologies.
AI-enabled autonomy has become a core response to rising mission complexity and the limitations of real-time human control. As of 2022, approximately 5,500 operational satellites were in orbit, and projections indicate that about 58,000 additional satellites could launch by 2030, intensifying demand for AI-driven traffic management, health monitoring, and payload optimization. AI systems already improve asteroid detection accuracy by around 10%, map roughly 90% of the Martian surface, and can classify maritime vessels in satellite imagery with over 95% accuracy, underscoring their role in data-intensive use cases.
On the supply side, advances in on-board processing, edge AI chips, and resilient software stacks enable higher autonomy at lower power and weight. Analysts estimate that AI adoption in the space industry has grown 29,300% over the past five years, while the broader AI segment within space technology is expected to reach around USD 342 Billion by 2025. These trends support new business models in automated Earth observation, in-orbit servicing, and predictive maintenance, while also driving ecosystem consolidation around key platform and analytics providers.
Regulatory and risk considerations remain material. Space agencies and regulators focus on spectrum management, orbital debris mitigation, and safety assurance for autonomous decision-making, especially as deep space missions depend on AI to operate beyond practical communication windows. Cybersecurity, algorithm transparency, and liability for AI-led decisions present growing concerns for investors. Regionally, North America and Europe lead deployment, reinforced by NASA and the European Space Agency, while Asia Pacific, led by China, India, and Japan, is emerging as a key investment hotspot. Across stakeholders, an estimated 70% of industry professionals expect AI to exert significant impact on space missions over the next decade, supporting a strong long-term outlook for this market.
Market Growth: The Global AI in Space Exploration Market stood at USD 3.1 billion and is projected to reach USD 48.6 billion by 2034, implying a compound annual growth rate of 33.2% over 2026-2034. This growth trajectory reflects accelerating integration of AI across mission planning, operations, and data analysis over 2024-2034.
Segment Dominance: The Rovers segment led the market with over 35.0% share, 2023, supported by intensive use of AI for navigation, hazard avoidance, and scientific data collection. This segment continues to anchor AI deployments as agencies prioritize autonomous surface exploration missions through 2024-2034.
Segment Dominance: The Robotics segment accounted for more than 30.0% share, 2023, as AI-enabled manipulators and robotic platforms supported in-orbit servicing, assembly, and maintenance. Vendors expand AI-driven robotic capabilities to raise operational uptime and efficiency across missions over 2024-2034.
Driver: Government customers represented over 73.0% share, 2023, providing stable funding for AI-driven exploration, defense, and scientific programs. Long-term public space budgets and mission roadmaps underpin demand visibility for AI solutions over 2024-2034.
Restraint: High mission development, testing, and AI-integration costs, estimated: 0.8 billion USD, 2024, limit participation by smaller commercial operators. Complex qualification and reliability requirements for AI algorithms in harsh space environments further slow deployment over 2024-2034.
Opportunity: Expanding use of AI for autonomous operations, data analytics, and on-board decision-making in commercial constellations creates new revenue pools, estimated: 5.0 billion USD, 2030. Vendors that deliver modular, space-qualified AI platforms can address both government and private missions across 2024-2034.
Trend: Mission planners increasingly deploy AI-driven rovers and robotics, which together controlled over 65.0% combined share, 2023, across key mission hardware categories. This shift signals a steady move toward higher autonomy levels in both planetary and orbital operations over 2024-2034.
Regional Analysis: North America held more than 40.0% share, 2023, reflecting strong investment by leading space agencies and prime contractors in AI-enabled missions. Other regions, led by Europe and Asia, are expected to narrow the gap with rising AI-in-space budgets, estimated: 3.0 billion USD, 2030, over 2024-2034.
By Type
The market for AI-enabled systems in space exploration continues to shift toward hardware platforms that can operate with minimal human control. Rovers account for the largest share of deployments. They represented more than 35 percent of global installations in 2023 and continue to expand in missions planned for 2025 and beyond. Agencies rely on rovers for surface mobility, subsurface analysis, and atmospheric monitoring on the Moon and Mars. Their role grows as mission planners prioritize long-duration operations and higher data output.
AI integration strengthens rover performance. Modern rovers process sensor data in real time, classify terrain features, avoid hazards, and adjust travel paths without assistance from Earth. These capabilities reduce downtime caused by communication delays. They also raise mission productivity by enabling continuous sampling and autonomous field decisions. Several programs under NASA, ESA, and ISRO now require onboard AI packages as a baseline specification for future rover fleets.
Space probes and robotic arms form the next largest categories. Probes equipped with onboard analytics handle deep-space observations and data filtering, which reduces downlink loads. Robotic arms support repair, docking, and cargo handling. Both segments gain importance as governments prepare for lunar infrastructure projects and early commercial activity in cislunar space. As missions scale in complexity, demand grows for AI-supported systems that maintain accuracy and operational continuity.
By Application
Robotics remains the leading application area for AI in space exploration, maintaining more than 30 percent of total market share in 2023. Robots equipped with AI conduct maintenance, assembly, inspection, and sampling across orbits and planetary surfaces. Their use reduces the exposure of astronauts to hazardous conditions and limits the cost of sending crewed missions for tasks that can be completed autonomously.
Remote sensing and monitoring continue to expand as satellite constellations grow. AI filters raw imagery, detects anomalies, and prioritizes datasets for scientific analysis. Missions targeting climate research, planetary geology, and near-Earth object tracking depend on machine-learning models to raise accuracy and shorten processing cycles. Data analytics also accelerates. Operators deploy AI tools to manage high-volume sensor streams, run predictive diagnostics, and support mission planning.
Asteroid mining and reusable launch operations represent emerging fields. Early feasibility studies indicate that autonomous excavation and material sorting will require high-precision AI systems. Reusable launch vehicles also integrate AI for health monitoring and rapid turnaround. As commercial space companies scale their operations through 2030, these applications are expected to shift from experimental to operational status.
By End-Use
Government agencies remain the dominant end-users of AI in space exploration. They accounted for more than 73 percent of total spending in 2023. Public programs supply long-term funding cycles and large-scale missions, which creates steady demand for AI-based navigation, data processing, and mission-control systems. Agencies use AI to extend satellite lifetimes, manage large constellations, and support deep-space exploration.
The public sector also drives early research. Programs under NASA, ESA, JAXA, and CNSA invest in autonomous spacecraft operations and onboard analytics. These initiatives form the foundation for upcoming missions to Mars, Jupiter’s moons, and cislunar infrastructure. Governments increasingly collaborate with commercial suppliers to accelerate development timelines and reduce operational risk.
Commercial adoption is rising as private firms scale constellations for communications and Earth observation. AI improves image classification, reduces operational costs, and supports predictive maintenance. As launch costs decline and new business models emerge, commercial operators are expected to take a larger share of AI deployments between 2025 and 2035.
By Region
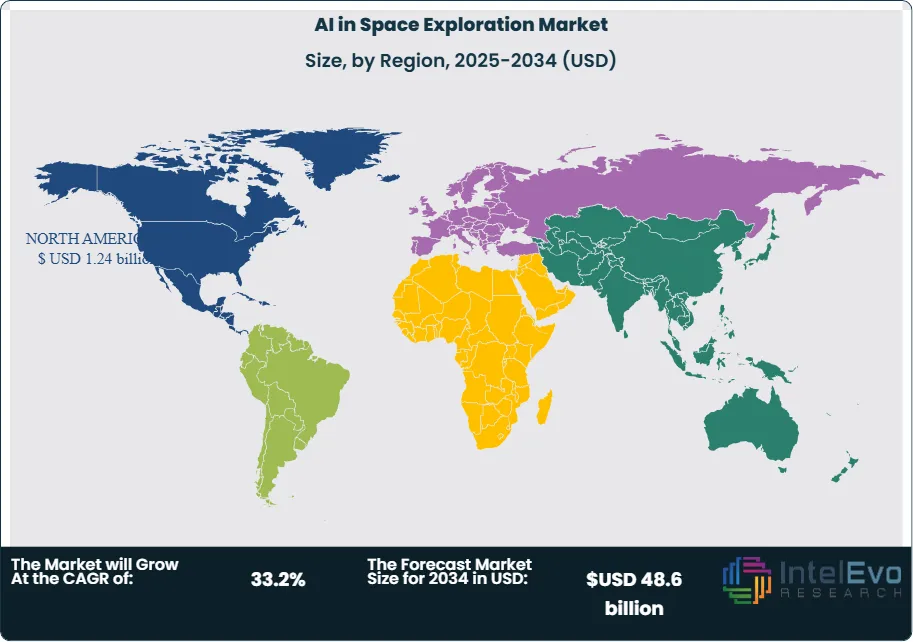
North America maintains the largest regional share, exceeding 40 percent in 2023. The region benefits from strong investment by NASA, the U.S. Department of Defense, and commercial firms such as SpaceX, Blue Origin, Lockheed Martin, and Northrop Grumman. These organizations embed AI in mission-critical systems, from capsule guidance to satellite analytics. The regional market exceeded 0.8 billion USD in 2023 and is projected to expand steadily as new lunar and planetary missions move into development.
Europe holds the second-largest share. ESA programs adopt AI to improve orbital management, robotic landers, and Earth observation workflows. The region also emphasizes AI for sustainability applications, including climate monitoring and debris tracking. Asia Pacific advances quickly. China, India, and Japan invest in lunar probes, reusable launch platforms, and autonomous spacecraft systems, creating strong demand for AI-enabled operations.
Latin America and the Middle East & Africa remain smaller but grow as governments increase participation in satellite programs. Several countries explore public-private partnerships to build local space capabilities using AI-driven monitoring, telecommunications, and climate research solutions. These regions are expected to move from early adoption to structured investment through 2030.
By Type (Rovers, Robotic Arms, Space Probes, Other Types), By Application (Robotics, Remote Sensing and Monitoring, Data Analytics, Asteroid Mining, Manned Vehicles and Reusable Launch, Communications, Remote Missions), By End-user (Government, Commercial)
Research Methodology
Primary Research- 100 Interviews of Stakeholders
Secondary Research
Desk Research
Regional scope
North America (United States, Canada, Mexico)
Latin America (Brazil, Argentina, Columbia)
East Asia And Pacific (China, Japan, South Korea, Australia, Cambodia, Fiji, Indonesia)
Sea And South Asia (India, Singapore, Thailand, Taiwan, Malaysia)
Eastern Europe (Poland, Russia, Czech Republic, Romania)
Western Europe (Germany, U.K., France, Spain, Itlay)
Middle East & Africa (GCC Countries, Egypt, Nigeria, South Africa, Israel)
Customization for segments, region/country-level will be provided. Moreover, additional customization can be done based on the requirements.
Pricing and Purchase Options
Avail customized purchase options to meet your exact research needs. We have three licenses to opt for: Single User License, Multi-User License (Up to 5 Users), Corporate Use License (Unlimited User and Printable PDF).
TABLE OF CONTENTS
1. EXECUTIVE SUMMARY
1.1. MARKET SNAPSHOT
1.2. KEY FINDINGS & INSIGHTS
1.3. ANALYST RECOMMENDATIONS
1.4. FUTURE OUTLOOK
2. RESEARCH METHODOLOGY
2.1. MARKET DEFINITION & SCOPE
2.2. RESEARCH OBJECTIVES: PRIMARY & SECONDARY DATA SOURCES
2.3. DATA COLLECTION SOURCES
2.3.1. COVERAGE OF 100+ PRIMARY RESEARCH/CONSULTATION CALLS WITH INDUSTRY STAKEHOLDERS
FIGURE 17 NORTH AMERICA AI IN SPACE EXPLORATION CURRENT AND FUTURE TYPE ANALYSIS, 2025–2034, (USD MILLION)
FIGURE 18 NORTH AMERICA AI IN SPACE EXPLORATION CURRENT AND FUTURE END USER ANALYSIS, 2025–2034, (USD MILLION)
FIGURE 19 MARKET SHARE BY COUNTRY
FIGURE 20 LATIN AMERICA AI IN SPACE EXPLORATION CURRENT AND FUTURE TYPE ANALYSIS, 2025–2034, (USD MILLION)
FIGURE 21 LATIN AMERICA AI IN SPACE EXPLORATION CURRENT AND FUTURE END USER ANALYSIS, 2025–2034, (USD MILLION)
FIGURE 22 MARKET SHARE BY COUNTRY
FIGURE 23 EASTERN EUROPE AI IN SPACE EXPLORATION CURRENT AND FUTURE TYPE ANALYSIS, 2025–2034, (USD MILLION)
FIGURE 24 EASTERN EUROPE AI IN SPACE EXPLORATION CURRENT AND FUTURE END USER ANALYSIS, 2025–2034, (USD MILLION)
FIGURE 25 MARKET SHARE BY COUNTRY
FIGURE 26 WESTERN EUROPE AI IN SPACE EXPLORATION CURRENT AND FUTURE TYPE ANALYSIS, 2025–2034, (USD MILLION)
FIGURE 27 WESTERN EUROPE AI IN SPACE EXPLORATION CURRENT AND FUTURE END USER ANALYSIS, 2025–2034, (USD MILLION)
FIGURE 28 MARKET SHARE BY COUNTRY
FIGURE 29 EAST ASIA AND PACIFIC AI IN SPACE EXPLORATION CURRENT AND FUTURE TYPE ANALYSIS, 2025–2034, (USD MILLION)
FIGURE 30 EAST ASIA AND PACIFIC AI IN SPACE EXPLORATION CURRENT AND FUTURE END USER ANALYSIS, 2025–2034, (USD MILLION)
FIGURE 31 MARKET SHARE BY COUNTRY
FIGURE 32 SEA AND SOUTH ASIA AI IN SPACE EXPLORATION CURRENT AND FUTURE TYPE ANALYSIS, 2025–2034, (USD MILLION)
FIGURE 33 SEA AND SOUTH ASIA AI IN SPACE EXPLORATION CURRENT AND FUTURE END USER ANALYSIS, 2025–2034, (USD MILLION)
FIGURE 34 MARKET SHARE BY COUNTRY
FIGURE 35 MIDDLE EAST AND AFRICA AI IN SPACE EXPLORATION CURRENT AND FUTURE TYPE ANALYSIS, 2025–2034, (USD MILLION)
FIGURE 36 MIDDLE EAST AND AFRICA AI IN SPACE EXPLORATION CURRENT AND FUTURE END USER ANALYSIS, 2025–2034, (USD MILLION)
FIGURE 37 NORTH AMERICA AI IN SPACE EXPLORATION CURRENT AND FUTURE MARKET VOLUME SHARE REGIONAL ANALYSIS, 2025–2034, (USD MILLION)
FIGURE 38 U.S. AI IN SPACE EXPLORATION CURRENT AND FUTURE TYPE ANALYSIS, 2025–2034, (USD MILLION)
FIGURE 39 U.S. AI IN SPACE EXPLORATION CURRENT AND FUTURE END USER ANALYSIS, 2025–2034, (USD MILLION)
FIGURE 40 CANADA AI IN SPACE EXPLORATION CURRENT AND FUTURE TYPE ANALYSIS, 2025–2034, (USD MILLION)
FIGURE 41 CANADA AI IN SPACE EXPLORATION CURRENT AND FUTURE END USER ANALYSIS, 2025–2034, (USD MILLION)
FIGURE 42 LATIN AMERICA AI IN SPACE EXPLORATION CURRENT AND FUTURE MARKET VOLUME SHARE REGIONAL ANALYSIS, 2025–2034, (USD MILLION)
FIGURE 43 MEXICO AI IN SPACE EXPLORATION CURRENT AND FUTURE TYPE ANALYSIS, 2025–2034, (USD MILLION)
FIGURE 44 MEXICO AI IN SPACE EXPLORATION CURRENT AND FUTURE END USER ANALYSIS, 2025–2034, (USD MILLION)
FIGURE 45 BRAZIL AI IN SPACE EXPLORATION CURRENT AND FUTURE TYPE ANALYSIS, 2025–2034, (USD MILLION)
FIGURE 46 BRAZIL AI IN SPACE EXPLORATION CURRENT AND FUTURE END USER ANALYSIS, 2025–2034, (USD MILLION)
FIGURE 47 ARGENTINA AI IN SPACE EXPLORATION CURRENT AND FUTURE TYPE ANALYSIS, 2025–2034, (USD MILLION)
FIGURE 48 ARGENTINA AI IN SPACE EXPLORATION CURRENT AND FUTURE END USER ANALYSIS, 2025–2034, (USD MILLION)
FIGURE 49 COLUMBIA AI IN SPACE EXPLORATION CURRENT AND FUTURE TYPE ANALYSIS, 2025–2034, (USD MILLION)
FIGURE 50 COLUMBIA AI IN SPACE EXPLORATION CURRENT AND FUTURE END USER ANALYSIS, 2025–2034, (USD MILLION)
FIGURE 51 REST OF LATIN AMERICA AI IN SPACE EXPLORATION CURRENT AND FUTURE TYPE ANALYSIS, 2025–2034, (USD MILLION)
FIGURE 52 REST OF LATIN AMERICA AI IN SPACE EXPLORATION CURRENT AND FUTURE END USER ANALYSIS, 2025–2034, (USD MILLION)
FIGURE 53 EASTERN EUROPE AI IN SPACE EXPLORATION CURRENT AND FUTURE MARKET VOLUME SHARE REGIONAL ANALYSIS, 2025–2034, (USD MILLION)
FIGURE 54 POLAND AI IN SPACE EXPLORATION CURRENT AND FUTURE TYPE ANALYSIS, 2025–2034, (USD MILLION)
FIGURE 55 POLAND AI IN SPACE EXPLORATION CURRENT AND FUTURE END USER ANALYSIS, 2025–2034, (USD MILLION)
FIGURE 56 RUSSIA AI IN SPACE EXPLORATION CURRENT AND FUTURE TYPE ANALYSIS, 2025–2034, (USD MILLION)
FIGURE 57 RUSSIA AI IN SPACE EXPLORATION CURRENT AND FUTURE END USER ANALYSIS, 2025–2034, (USD MILLION)
FIGURE 58 CZECH REPUBLIC AI IN SPACE EXPLORATION CURRENT AND FUTURE TYPE ANALYSIS, 2025–2034, (USD MILLION)
FIGURE 59 CZECH REPUBLIC AI IN SPACE EXPLORATION CURRENT AND FUTURE END USER ANALYSIS, 2025–2034, (USD MILLION)
FIGURE 60 ROMANIA AI IN SPACE EXPLORATION CURRENT AND FUTURE TYPE ANALYSIS, 2025–2034, (USD MILLION)
FIGURE 61 ROMANIA AI IN SPACE EXPLORATION CURRENT AND FUTURE END USER ANALYSIS, 2025–2034, (USD MILLION)
FIGURE 62 REST OF EASTERN EUROPE AI IN SPACE EXPLORATION CURRENT AND FUTURE TYPE ANALYSIS, 2025–2034, (USD MILLION)
FIGURE 63 REST OF EASTERN EUROPE AI IN SPACE EXPLORATION CURRENT AND FUTURE END USER ANALYSIS, 2025–2034, (USD MILLION)
FIGURE 64 WESTERN EUROPE AI IN SPACE EXPLORATION CURRENT AND FUTURE MARKET VOLUME SHARE REGIONAL ANALYSIS, 2025–2034, (USD MILLION)
FIGURE 65 GERMANY AI IN SPACE EXPLORATION CURRENT AND FUTURE TYPE ANALYSIS, 2025–2034, (USD MILLION)
FIGURE 66 GERMANY AI IN SPACE EXPLORATION CURRENT AND FUTURE END USER ANALYSIS, 2025–2034, (USD MILLION)
FIGURE 67 FRANCE AI IN SPACE EXPLORATION CURRENT AND FUTURE TYPE ANALYSIS, 2025–2034, (USD MILLION)
FIGURE 68 FRANCE AI IN SPACE EXPLORATION CURRENT AND FUTURE END USER ANALYSIS, 2025–2034, (USD MILLION)
FIGURE 69 UK AI IN SPACE EXPLORATION CURRENT AND FUTURE TYPE ANALYSIS, 2025–2034, (USD MILLION)
FIGURE 70 UK AI IN SPACE EXPLORATION CURRENT AND FUTURE END USER ANALYSIS, 2025–2034, (USD MILLION)
FIGURE 71 SPAIN AI IN SPACE EXPLORATION CURRENT AND FUTURE TYPE ANALYSIS, 2025–2034, (USD MILLION)
FIGURE 72 SPAIN AI IN SPACE EXPLORATION CURRENT AND FUTURE END USER ANALYSIS, 2025–2034, (USD MILLION)
FIGURE 73 ITALY AI IN SPACE EXPLORATION CURRENT AND FUTURE TYPE ANALYSIS, 2025–2034, (USD MILLION)
FIGURE 74 ITALY AI IN SPACE EXPLORATION CURRENT AND FUTURE END USER ANALYSIS, 2025–2034, (USD MILLION)
FIGURE 75 REST OF WESTERN EUROPE AI IN SPACE EXPLORATION CURRENT AND FUTURE TYPE ANALYSIS, 2025–2034, (USD MILLION)
FIGURE 76 REST OF WESTERN EUROPE AI IN SPACE EXPLORATION CURRENT AND FUTURE END USER ANALYSIS, 2025–2034, (USD MILLION)
FIGURE 77 EAST ASIA AND PACIFIC AI IN SPACE EXPLORATION CURRENT AND FUTURE MARKET VOLUME SHARE REGIONAL ANALYSIS, 2025–2034, (USD MILLION)
FIGURE 78 CHINA AI IN SPACE EXPLORATION CURRENT AND FUTURE TYPE ANALYSIS, 2025–2034, (USD MILLION)
FIGURE 79 CHINA AI IN SPACE EXPLORATION CURRENT AND FUTURE END USER ANALYSIS, 2025–2034, (USD MILLION)
FIGURE 80 JAPAN AI IN SPACE EXPLORATION CURRENT AND FUTURE TYPE ANALYSIS, 2025–2034, (USD MILLION)
FIGURE 81 JAPAN AI IN SPACE EXPLORATION CURRENT AND FUTURE END USER ANALYSIS, 2025–2034, (USD MILLION)
FIGURE 82 AUSTRALIA AI IN SPACE EXPLORATION CURRENT AND FUTURE TYPE ANALYSIS, 2025–2034, (USD MILLION)
FIGURE 83 AUSTRALIA AI IN SPACE EXPLORATION CURRENT AND FUTURE END USER ANALYSIS, 2025–2034, (USD MILLION)
FIGURE 84 CAMBODIA AI IN SPACE EXPLORATION CURRENT AND FUTURE TYPE ANALYSIS, 2025–2034, (USD MILLION)
FIGURE 85 CAMBODIA AI IN SPACE EXPLORATION CURRENT AND FUTURE END USER ANALYSIS, 2025–2034, (USD MILLION)
FIGURE 86 FIJI AI IN SPACE EXPLORATION CURRENT AND FUTURE TYPE ANALYSIS, 2025–2034, (USD MILLION)
FIGURE 87 FIJI AI IN SPACE EXPLORATION CURRENT AND FUTURE END USER ANALYSIS, 2025–2034, (USD MILLION)
FIGURE 88 INDONESIA AI IN SPACE EXPLORATION CURRENT AND FUTURE TYPE ANALYSIS, 2025–2034, (USD MILLION)
FIGURE 89 INDONESIA AI IN SPACE EXPLORATION CURRENT AND FUTURE END USER ANALYSIS, 2025–2034, (USD MILLION)
FIGURE 90 SOUTH KOREA AI IN SPACE EXPLORATION CURRENT AND FUTURE TYPE ANALYSIS, 2025–2034, (USD MILLION)
FIGURE 91 SOUTH KOREA AI IN SPACE EXPLORATION CURRENT AND FUTURE END USER ANALYSIS, 2025–2034, (USD MILLION)
FIGURE 92 REST OF EAST ASIA AND PACIFIC AI IN SPACE EXPLORATION CURRENT AND FUTURE TYPE ANALYSIS, 2025–2034, (USD MILLION)
FIGURE 93 REST OF EAST ASIA AND PACIFIC AI IN SPACE EXPLORATION CURRENT AND FUTURE END USER ANALYSIS, 2025–2034, (USD MILLION)
FIGURE 94 SEA AND SOUTH ASIA AI IN SPACE EXPLORATION CURRENT AND FUTURE MARKET VOLUME SHARE REGIONAL ANALYSIS, 2025–2034, (USD MILLION)
FIGURE 95 BANGLADESH AI IN SPACE EXPLORATION CURRENT AND FUTURE TYPE ANALYSIS, 2025–2034, (USD MILLION)
FIGURE 96 BANGLADESH AI IN SPACE EXPLORATION CURRENT AND FUTURE END USER ANALYSIS, 2025–2034, (USD MILLION)
FIGURE 97 NEW ZEALAND AI IN SPACE EXPLORATION CURRENT AND FUTURE TYPE ANALYSIS, 2025–2034, (USD MILLION)
FIGURE 98 NEW ZEALAND AI IN SPACE EXPLORATION CURRENT AND FUTURE END USER ANALYSIS, 2025–2034, (USD MILLION)
FIGURE 99 INDIA AI IN SPACE EXPLORATION CURRENT AND FUTURE TYPE ANALYSIS, 2025–2034, (USD MILLION)
FIGURE 100 INDIA AI IN SPACE EXPLORATION CURRENT AND FUTURE END USER ANALYSIS, 2025–2034, (USD MILLION)
FIGURE 101 SINGAPORE AI IN SPACE EXPLORATION CURRENT AND FUTURE TYPE ANALYSIS, 2025–2034, (USD MILLION)
FIGURE 102 SINGAPORE AI IN SPACE EXPLORATION CURRENT AND FUTURE END USER ANALYSIS, 2025–2034, (USD MILLION)
FIGURE 103 THAILAND AI IN SPACE EXPLORATION CURRENT AND FUTURE TYPE ANALYSIS, 2025–2034, (USD MILLION)
FIGURE 104 THAILAND AI IN SPACE EXPLORATION CURRENT AND FUTURE END USER ANALYSIS, 2025–2034, (USD MILLION)
FIGURE 105 TAIWAN AI IN SPACE EXPLORATION CURRENT AND FUTURE TYPE ANALYSIS, 2025–2034, (USD MILLION)
FIGURE 106 TAIWAN AI IN SPACE EXPLORATION CURRENT AND FUTURE END USER ANALYSIS, 2025–2034, (USD MILLION)
FIGURE 107 MALAYSIA AI IN SPACE EXPLORATION CURRENT AND FUTURE TYPE ANALYSIS, 2025–2034, (USD MILLION)
FIGURE 108 MALAYSIA AI IN SPACE EXPLORATION CURRENT AND FUTURE END USER ANALYSIS, 2025–2034, (USD MILLION)
FIGURE 109 REST OF SEA AND SOUTH ASIA AI IN SPACE EXPLORATION CURRENT AND FUTURE TYPE ANALYSIS, 2025–2034, (USD MILLION)
FIGURE 110 REST OF SEA AND SOUTH ASIA AI IN SPACE EXPLORATION CURRENT AND FUTURE END USER ANALYSIS, 2025–2034, (USD MILLION)
FIGURE 111 MIDDLE EAST AND AFRICA AI IN SPACE EXPLORATION CURRENT AND FUTURE MARKET VOLUME SHARE REGIONAL ANALYSIS, 2025–2034, (USD MILLION)
FIGURE 112 GCC COUNTRIES AI IN SPACE EXPLORATION CURRENT AND FUTURE TYPE ANALYSIS, 2025–2034, (USD MILLION)
FIGURE 113 GCC COUNTRIES AI IN SPACE EXPLORATION CURRENT AND FUTURE END USER ANALYSIS, 2025–2034, (USD MILLION)
FIGURE 114 SAUDI ARABIA AI IN SPACE EXPLORATION CURRENT AND FUTURE TYPE ANALYSIS, 2025–2034, (USD MILLION)
FIGURE 115 SAUDI ARABIA AI IN SPACE EXPLORATION CURRENT AND FUTURE END USER ANALYSIS, 2025–2034, (USD MILLION)
FIGURE 116 UAE AI IN SPACE EXPLORATION CURRENT AND FUTURE TYPE ANALYSIS, 2025–2034, (USD MILLION)
FIGURE 117 UAE AI IN SPACE EXPLORATION CURRENT AND FUTURE END USER ANALYSIS, 2025–2034, (USD MILLION)
FIGURE 118 BAHRAIN AI IN SPACE EXPLORATION CURRENT AND FUTURE TYPE ANALYSIS, 2025–2034, (USD MILLION)
FIGURE 119 BAHRAIN AI IN SPACE EXPLORATION CURRENT AND FUTURE END USER ANALYSIS, 2025–2034, (USD MILLION)
FIGURE 120 KUWAIT AI IN SPACE EXPLORATION CURRENT AND FUTURE TYPE ANALYSIS, 2025–2034, (USD MILLION)
FIGURE 121 KUWAIT AI IN SPACE EXPLORATION CURRENT AND FUTURE END USER ANALYSIS, 2025–2034, (USD MILLION)
FIGURE 122 OMAN AI IN SPACE EXPLORATION CURRENT AND FUTURE TYPE ANALYSIS, 2025–2034, (USD MILLION)
FIGURE 123 OMAN AI IN SPACE EXPLORATION CURRENT AND FUTURE END USER ANALYSIS, 2025–2034, (USD MILLION)
FIGURE 124 QATAR AI IN SPACE EXPLORATION CURRENT AND FUTURE TYPE ANALYSIS, 2025–2034, (USD MILLION)
FIGURE 125 QATAR AI IN SPACE EXPLORATION CURRENT AND FUTURE END USER ANALYSIS, 2025–2034, (USD MILLION)
FIGURE 126 EGYPT AI IN SPACE EXPLORATION CURRENT AND FUTURE TYPE ANALYSIS, 2025–2034, (USD MILLION)
FIGURE 127 EGYPT AI IN SPACE EXPLORATION CURRENT AND FUTURE END USER ANALYSIS, 2025–2034, (USD MILLION)
FIGURE 128 NIGERIA AI IN SPACE EXPLORATION CURRENT AND FUTURE TYPE ANALYSIS, 2025–2034, (USD MILLION)
FIGURE 129 NIGERIA AI IN SPACE EXPLORATION CURRENT AND FUTURE END USER ANALYSIS, 2025–2034, (USD MILLION)
FIGURE 130 SOUTH AFRICA AI IN SPACE EXPLORATION CURRENT AND FUTURE TYPE ANALYSIS, 2025–2034, (USD MILLION)
FIGURE 131 SOUTH AFRICA AI IN SPACE EXPLORATION CURRENT AND FUTURE END USER ANALYSIS, 2025–2034, (USD MILLION)
FIGURE 132 ISRAEL AI IN SPACE EXPLORATION CURRENT AND FUTURE TYPE ANALYSIS, 2025–2034, (USD MILLION)
FIGURE 133 ISRAEL AI IN SPACE EXPLORATION CURRENT AND FUTURE END USER ANALYSIS, 2025–2034, (USD MILLION)
FIGURE 134 REST OF MEA AI IN SPACE EXPLORATION CURRENT AND FUTURE TYPE ANALYSIS, 2025–2034, (USD MILLION)
FIGURE 135 REST OF MEA AI IN SPACE EXPLORATION CURRENT AND FUTURE END USER ANALYSIS, 2025–2034, (USD MILLION)
FIGURE 136 U. S. MARKET SHARE ANALYSIS BY TYPE (2024)
FIGURE 137 U. S. MARKET SHARE ANALYSIS BY END USER (2024)
FIGURE 138 CANADA MARKET SHARE ANALYSIS BY TYPE (2024)
FIGURE 139 CANADA MARKET SHARE ANALYSIS BY END USER (2024)
FIGURE 140 MEXICO MARKET SHARE ANALYSIS BY TYPE (2024)
FIGURE 141 MEXICO MARKET SHARE ANALYSIS BY END USER (2024)
FIGURE 142 CHINA MARKET SHARE ANALYSIS BY TYPE (2024)
FIGURE 143 CHINA MARKET SHARE ANALYSIS BY END USER (2024)
FIGURE 144 JAPAN MARKET SHARE ANALYSIS BY TYPE (2024)
FIGURE 145 JAPAN MARKET SHARE ANALYSIS BY END USER (2024)
FIGURE 146 INDIA MARKET SHARE ANALYSIS BY TYPE (2024)
FIGURE 147 INDIA MARKET SHARE ANALYSIS BY END USER (2024)
FIGURE 148 SOUTH KOREA MARKET SHARE ANALYSIS BY TYPE (2024)
FIGURE 149 SOUTH KOREA MARKET SHARE ANALYSIS BY END USER (2024)
FIGURE 150 SAUDI ARABIA MARKET SHARE ANALYSIS BY TYPE (2024)
FIGURE 151 SAUDI ARABIA MARKET SHARE ANALYSIS BY END USER (2024)
FIGURE 152 UAE MARKET SHARE ANALYSIS BY TYPE (2024)
FIGURE 153 UAE MARKET SHARE ANALYSIS BY END USER (2024)
FIGURE 154 EGYPT MARKET SHARE ANALYSIS BY TYPE (2024)
FIGURE 155 EGYPT MARKET SHARE ANALYSIS BY END USER (2024)
FIGURE 156 NIGERIA MARKET SHARE ANALYSIS BY TYPE (2024)
FIGURE 157 NIGERIA MARKET SHARE ANALYSIS BY END USER (2024)
FIGURE 158 SOUTH AFRICA MARKET SHARE ANALYSIS BY TYPE (2024)
FIGURE 159 SOUTH AFRICA MARKET SHARE ANALYSIS BY END USER (2024)
FIGURE 160 GERMANY MARKET SHARE ANALYSIS BY TYPE (2024)
FIGURE 161 GERMANY MARKET SHARE ANALYSIS BY END USER (2024)
FIGURE 162 FRANCE MARKET SHARE ANALYSIS BY TYPE (2024)
FIGURE 163 FRANCE MARKET SHARE ANALYSIS BY END USER (2024)
FIGURE 164 UK MARKET SHARE ANALYSIS BY TYPE (2024)
FIGURE 165 UK MARKET SHARE ANALYSIS BY END USER (2024)
FIGURE 166 SPAIN MARKET SHARE ANALYSIS BY TYPE (2024)
FIGURE 167 SPAIN MARKET SHARE ANALYSIS BY END USER (2024)
FIGURE 168 ITALY MARKET SHARE ANALYSIS BY TYPE (2024)
FIGURE 169 ITALY MARKET SHARE ANALYSIS BY END USER (2024)
FIGURE 170 BRAZIL MARKET SHARE ANALYSIS BY TYPE (2024)
FIGURE 171 BRAZIL MARKET SHARE ANALYSIS BY END USER (2024)
FIGURE 172 ARGENTINA MARKET SHARE ANALYSIS BY TYPE (2024)
FIGURE 173 ARGENTINA MARKET SHARE ANALYSIS BY END USER (2024)
FIGURE 174 COLUMBIA MARKET SHARE ANALYSIS BY TYPE (2024)
FIGURE 175 COLUMBIA MARKET SHARE ANALYSIS BY END USER (2024)
FIGURE 176 GLOBAL AI IN SPACE EXPLORATION CURRENT AND FUTURE MARKET KEY COUNTRY LEVEL ANALYSIS, 2024–2034, (USD MILLION)
FIGURE 177 FINANCIAL OVERVIEW:
Key Player Analysis
Thales Group: Thales Group positions itself as a leader in AI-enabled space systems. The company supplies mission control platforms, satellite payload technologies, and onboard data processing units that support high-autonomy missions. By 2025, Thales expands its AI roadmap through investments in embedded analytics and automated decision-support systems for satellite operations. The firm strengthens its market position through partnerships with European space agencies and regional operators seeking to raise data throughput and reduce mission latency. Its differentiator lies in its integrated hardware and AI software stack, which allows customers to run real-time analytics directly on spacecraft. This approach supports faster imaging cycles, more efficient navigation, and reduced ground-station dependencies.
Booz Allen Hamilton: Booz Allen Hamilton operates as a strategic advisor and technology integrator within the AI in space exploration market. The firm supports government agencies with mission planning tools, AI-enabled analytics, and cybersecurity frameworks for space assets. Its client base includes defense and civil agencies that require reliable command-and-control systems backed by machine-learning models. Booz Allen invests heavily in AI model validation and risk-monitoring capabilities that meet federal security standards. This strengthens its role as a trusted partner for large-scale space programs. The firm’s advantage stems from its ability to merge mission analytics with secure cloud architectures, which helps agencies manage high-volume telemetry and improve predictive maintenance accuracy.
SpaceX: SpaceX acts as a major challenger and ecosystem driver in AI-enabled space activity. Its launch platforms and reusable vehicles rely on machine-learning systems for trajectory planning, fault detection, and autonomous landing. By 2025, SpaceX expands AI use within Starship operations and Starlink constellation management. This supports higher launch cadence and lower operational cost per mission. The company maintains a strong edge through vertical integration. It controls launch services, spacecraft design, and satellite manufacturing, which allows rapid deployment of AI upgrades across its fleet. SpaceX continues to attract commercial partners seeking AI-supported transport services and real-time communications capacity.
Maxar Technologies Inc.: Maxar Technologies positions itself as an analytics and imaging specialist within the market. The company produces high-resolution Earth observation data and integrates AI models to classify terrain features, detect changes, and support mission planning for government and commercial clients. By 2025, Maxar invests in automated image-generation pipelines to handle the growing volume of satellite imagery produced by new constellations. It also advances onboard processing capabilities, which reduce downlink bandwidth and deliver time-sensitive intelligence. Maxar’s differentiator lies in its large historical imagery archive combined with proprietary AI models. This gives customers more accurate insights for climate analysis, security missions, and planetary observation.
Market Key Players
D-Orbit
Iceye
Lockheed Martin
Hawkeye 360
Thales Group
Blacksky Global
Planet Labs Inc.
Maxar Technologies Inc.
Spire Global
Airbus
Astroscale
Capella Space
Hewlett Packard Enterprise (HPE)
SpaceX
IBM
Booz Allen Hamilton
Northrop Grumman
Other Key Players
Driver
Autonomous Systems Drive AI Adoption in Deep-Space Missions
By 2025, space programs will increasingly rely on autonomous systems as mission distances grow and communication delays lengthen. AI now supports critical operations across spacecraft, rovers, and orbital platforms by processing sensor data quickly and reducing reliance on ground intervention. These capabilities improve hazard detection, route planning, and real-time decision-making, making missions safer and more efficient.
Public and Commercial Missions Accelerate Platform Demand
Space agencies focusing on Mars exploration, lunar bases, and asteroid missions depend on AI to manage long-duration operations with minimal human involvement. At the same time, commercial operators use AI to enhance mission continuity and reliability. This combined demand from public and private programs drives steady growth in AI platform use across exploration, observation, and in-orbit service missions.
Restraint
High Cost of Space-Grade AI Hardware Limits Adoption
AI deployment in space is limited by high development and integration costs. Space-grade hardware must withstand radiation, extreme temperatures, and prolonged operational stress, leading to significant expenses in design, testing, and validation. Consequently, AI-related systems often consume over 20 percent of total mission budgets.
Budget Pressure Restricts Participation to Large Operators
Retrofitting older spacecraft with AI modules brings additional costs and schedule delays, which raises financial barriers. These limitations hinder adoption among smaller operators and startups, mostly allowing participation by government agencies and well-funded commercial firms. Budget pressure remains a major factor influencing deployment timelines and system scope.
Opportunity
Commercial Space Expansion Creates High-Value AI Use Cases
The rapid growth of commercial space activity through 2025 presents a strong chance for AI adoption. Companies expanding satellite constellations, cargo missions, and lunar logistics increasingly use AI to shorten mission timelines, automate inspections, and optimize flight operations. These applications improve uptime while reducing reliance on ground control teams.
Autonomous Navigation and Analytics Drive ROI
The commercial sector is expected to account for several billion USD in annual AI spending by 2030 as operators focus on operational efficiency. Companies achieve strong returns by partnering with providers that offer autonomous navigation, predictive maintenance, and onboard analytics tailored for high launch frequency and fast mission turnover.
AI-driven robotics are growing in capability as mission scope and complexity increase. Robotic systems now handle inspection, sample collection, maintenance, and early construction tasks in orbit and on planetary surfaces. Deep learning models support large-scale imaging analysis, object recognition, and anomaly detection, boosting both scientific output and satellite operations.
Predictive Maintenance and Remote Sensing Advance Rapidly
Predictive maintenance powered by AI is increasingly integrated into spacecraft health monitoring systems, especially in new satellite constellations. Remote sensing also progresses as AI improves classification accuracy and decreases processing time. At the same time, efforts to enhance coordination between AI systems and human operators continue, particularly for missions that need remote oversight and adaptive decision-making.
Recent Developments
Dec 2024 – TakeMe2Space & ISRO: Hyderabad-based TakeMe2Space announced the launch of MOI-TD, India’s first dedicated AI laboratory in space, scheduled on an ISRO PSLV mission, to test real-time AI processing on orbiting payloads.The mission positions India as an emerging hub for in-orbit AI experimentation and strengthens its role in low-cost AI infrastructure for future exploration programs.
Feb 2025 – ASAP / ESA-led Consortium: The ASAP Horizon Europe project hosted the “AI for Space Applications” workshop, bringing together European agencies, primes, and startups to align on AI use cases for spacecraft autonomy and in-orbit operations. The event accelerates pipeline formation for EU-funded AI demonstration missions and deepens Europe’s competitive stance in autonomous exploration platforms.
Apr 2025 – ESA: ESA confirmed final preparations for the Biomass mission, a radar probe set to launch in April 2025, which will use advanced processing and machine learning to generate 3D maps of tropical forests and quantify carbon stocks from orbit.
Jul 2025 – NASA: NASA reported a successful test in which an Earth-observing satellite used onboard AI to scan ahead along its orbit, process imagery in less than 90 seconds, and autonomously decide where to retarget its instrument without human input.=
Jul 2025 – China / ADA Space: China launched the first 12 satellites of its “Three-Body Computing Constellation,” an AI supercomputing network in space, with each unit hosting an 8-billion-parameter model delivering about 744 TOPS and a cluster output of roughly 5 POPS.
Sep 2025 – Maxar Intelligence & Ecopia AI: Maxar and Ecopia AI announced Vivid Features, an AI-powered global mapping product that converts 30 cm satellite imagery into detailed 2D and 3D vector maps, with a commitment to generate over one billion mapped features worldwide. The partnership broadens commercial demand for AI-enhanced geospatial data and reinforces Maxar’s role as a key data and analytics supplier to exploration, defense, and infrastructure customers.