AI in Sports Market 2034 Size, Innovation & Forecast | 33.8% CAGR
Global AI in Sports Market Size, Share & Analysis By Component (Software, Service), By Deployment Mode (Cloud, On-premise), By Technology (Machine Learning, Natural Language Processing, Computer Vision, Others), By Application(Player Analysis, Fan Engagement, Data Interpretation & Analysis, Other Applications), Industry Adoption Trends, Investment Hotspots & Forecast 2025–2034
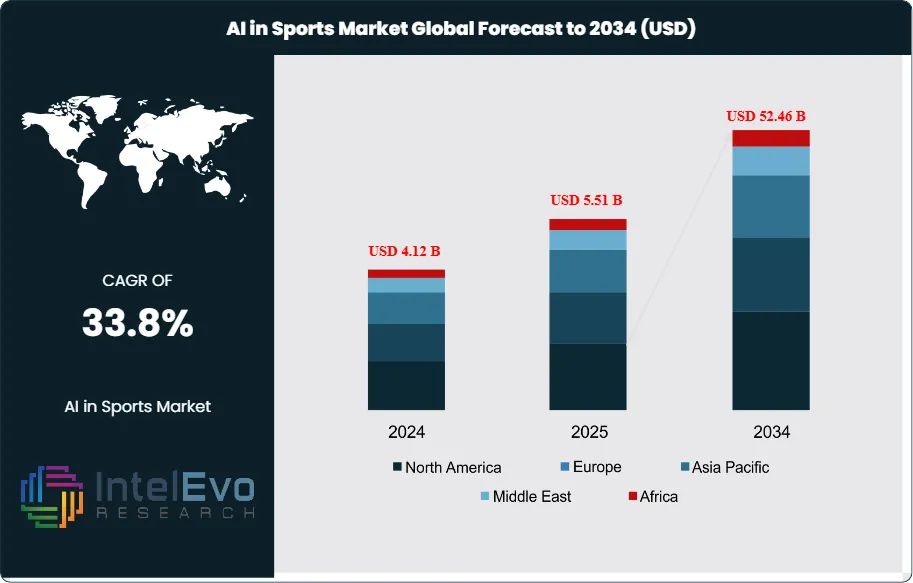
The AI in Sports Market was valued at approximately USD 4.12 Billion in 2024 and is projected to reach nearly USD 52.46 Billion by 2034, growing at an estimated CAGR of around 33.8% from 2025 to 2034. AI-powered performance analytics, injury-risk detection, and real-time game insights are transforming how clubs, leagues, and broadcasters operate. From computer-vision scouting to predictive coaching systems, AI is redefining competitive strategy and fan engagement. The next decade marks a technology-driven revolution in global sports, unlocking massive commercial, athletic, and media-innovation opportunities.
Market development has accelerated from early analytics pilots to enterprise-scale deployments across teams, leagues, broadcasters, sportsbooks, and venue operators. Between 2019 and 2023, adoption shifted from isolated performance-analysis tools to integrated data stacks combining computer vision, wearables, tracking systems, and cloud-based model ops; software now accounts for an estimated 60–65% of spend, with services and integration comprising the balance.
Solutions for performance and tactics analytics represent roughly 45–50% of current revenue, followed by fan-engagement and media automation (25–30%) and operations and integrity applications (15–20%). As rights holders monetize data more effectively, average spend per top-tier club has risen at double-digit rates, while broadcasters report uplifts of 8–12% in engagement on AI-personalized OTT feeds.
Demand-side growth is underpinned by the pursuit of competitive advantage, measurable ROI from injury-risk reduction and conditioning (often 10–20% reductions in soft-tissue incidents where programs are mature), and the premium on differentiated fan experiences. On the supply side, lower inference costs, edge AI in wearables, and the availability of pretrained vision and language models have reduced time-to-value. Key risks include athlete-data governance and consent (biometric data increasingly treated as personally identifiable), model bias and explainability in selection decisions, IP ownership of derived data, and cybersecurity across interconnected venue systems. Regulatory scrutiny is tightening around betting-linked use cases and GDPR/CCPA compliance, raising integration and compliance costs for multi-jurisdiction operators.
Technology innovation is reshaping adoption: multimodal tracking that fuses optical, LPS/UWB, and inertial signals; reinforcement learning for strategy optimization; digital twins of players and training loads; automated highlights and synthetic commentary; and AI-driven ad insertion for virtualized signage. North America currently leads with ~40% revenue share, supported by deep investments in the NFL, NBA, MLB, and collegiate programs; Europe follows at ~30% on the back of data-rich football leagues. Asia–Pacific is the fastest-growing region (estimated >35% CAGR) as cricket, football, and basketball franchises scale analytics, while the Middle East accelerates smart-venue builds tied to mega-events. Investment hotspots include computer-vision platforms, athlete-wellness analytics, and fan-personalization layers embedded into OTT and betting ecosystems.
Key Takeaways
Market Growth: The global AI in Sports market was USD 4.12 Billion in 2024 and is projected to reach USD 52.46 Billion by 2034 (33.8% CAGR), propelled by measurable performance gains, personalized fan engagement, and falling edge-inference costs.
Segment Dominance – Component: Software led with ~72% revenue share in 2024 as value concentrates in analytics platforms, computer-vision pipelines, and MLOps; leading vendors include Stats Perform, Genius Sports (Second Spectrum), Catapult, Hudl, WSC Sports, and Pixellot.
Segment Dominance – Deployment: On-premise accounted for ~57% of spend in 2024 due to data control, latency, and compliance needs in elite competitions; hybrid models are expanding as cloud and federated learning narrow security and jurisdictional gaps.
Segment Dominance – Technology: Machine Learning was the top technology with >26% share in 2024, underpinned by player-tracking models, injury-risk classifiers, and recommendation engines; rapid gains are expected in computer vision and NLP as multimodal models scale.
Segment Dominance – Application: Data Interpretation & Analysis dominated at ~34% share in 2024, reflecting demand for tactical insights and workload optimization; adjacent use cases in broadcasting and fan personalization expanded ~40% in 2024, while athlete health monitoring/injury prevention adoption is projected to grow ~25% in 2024.
Driver: Accelerating enterprise adoption—over 30% of sports governing bodies had implemented AI by 2024—combines with macro AI momentum (global AI market expected to reach ~USD 2,745 billion by 2034) to sustain investment in performance analytics, media automation, and betting integrity solutions.
Restraint: Athlete-data privacy, IP ownership, and explainability requirements elevate integration and legal costs and keep workloads on-prem (57% share), slowing cloud-native scaling and cross-league data sharing.
Opportunity: Smart-venue operations (crowd flow, security, energy) and digital twins for training are poised for outsized growth, with AI-optimized venue initiatives estimated to rise ~30% in 2024 and VR-based training expected to become mainstream from 2024; talent-scouting adoption is projected to exceed 60% by 2024.
Trend: Generative and multimodal AI are reshaping media—automated highlights, synthetic commentary, and virtualized signage—driving double-digit engagement uplifts; broadcasters and leagues increasingly deploy solutions from WSC Sports, Pixellot, Hawk-Eye, and AWS to differentiate OTT experiences.
Regional Analysis: North America led with ~39% share in 2024 on deep tech stacks across the NFL, NBA, MLB, and college sports; Europe follows on data-rich football ecosystems, while Asia-Pacific is the fastest-growing region (expected >35% CAGR) and the Middle East is an investment hotspot via smart-venue builds tied to mega-events.
Component Analysis
Software remains the revenue anchor of AI in Sports in 2025, accounting for an estimated 70–73% of spend as clubs, leagues, broadcasters, and sportsbooks prioritize analytics platforms, computer-vision pipelines, and MLOps. Value concentrates in feature-rich stacks that fuse tracking data, video, and contextual metadata to drive player optimization and media automation; leading providers include Stats Perform, Genius Sports (Second Spectrum), Catapult, Hudl, WSC Sports, Pixellot, and Sportlogiq. As of 2025, platform contracts increasingly bundle SDKs and APIs for personalization, raising software ARPU and stickiness.
Services—consulting, systems integration, model tuning, and managed operations—represent the remaining 27–30% but are expanding faster (high-20s CAGR through 2030) as buyers move from pilots to multi-property rollouts and seek hybrid data governance. Demand is strongest for edge deployment design, data rights/compliance advisory, and reliability engineering for live workflows, particularly around injury-risk models and automated content production at scale.
Deployment Mode Analysis
On-premise retains a slight majority in 2025 (≈55–58% share) due to latency-sensitive use cases, sovereign data mandates, and the competitive sensitivity of biometric and tactical datasets. Elite teams value deterministic performance for in-stadium decisioning and prefer keeping model weights and player data within club-controlled environments, often leveraging HCI appliances and GPU clusters.
Cloud and hybrid models are the fastest-rising, projected to surpass on-prem around 2028–2029 as confidential computing, federated learning, and fine-grained access controls reduce risk. Cloud economics favor bursty workloads (e.g., generative highlight creation, large-scale simulation), while CDNs and edge inference mitigate round-trip delays for broadcast overlays and OTT personalization.
By Technology
Machine Learning remains the largest technology bucket in 2025 with ~26–28% share, underpinning workload management, injury-risk scoring, scouting, and pricing/integrity analytics. Clubs report double-digit reductions in soft-tissue injuries where ML-led load management is mature, supporting continued budget allocation.
Computer Vision is close behind (~24–26% share) and outgrowing the overall market, driven by multi-camera optical tracking, pose estimation, and automated officiating. Vendors such as Second Spectrum, Hawk-Eye Innovations, Veo, and Pixellot scale lower-cost capture that broadens adoption from tier-one leagues to academies. NLP/GenAI (≈18–22%) accelerates synthetic commentary, automated metadata, and conversational analytics for coaches and fans, while “Others” (reinforcement learning, knowledge graphs, anomaly detection) power strategy simulation and betting integrity.
Application Analysis
Data Interpretation & Analysis remains the core application in 2025 (~33–35% share), transforming heterogeneous data—tracking, biosignals, video, and context—into actionable insights for selection, tactics, and recovery. Mature programs report 5–10% improvements in player availability and 3–5% uplift in points gained per season tied to decision-support adoption.
Fan Engagement and media automation is the fastest-growing cluster (often >35% CAGR), with AI-generated highlights, personalized feeds, and virtualized signage delivering 8–12% increases in watch time and ad yield for rights holders. Player Analysis continues to scale via wearables and edge inference; in top-tier environments, sensor penetration exceeds two-thirds of rosters, enabling real-time feedback loops and individualized training. “Other” uses—venue operations, safety, and officiating—gain momentum as smart-venue programs mature.
Regional Analysis
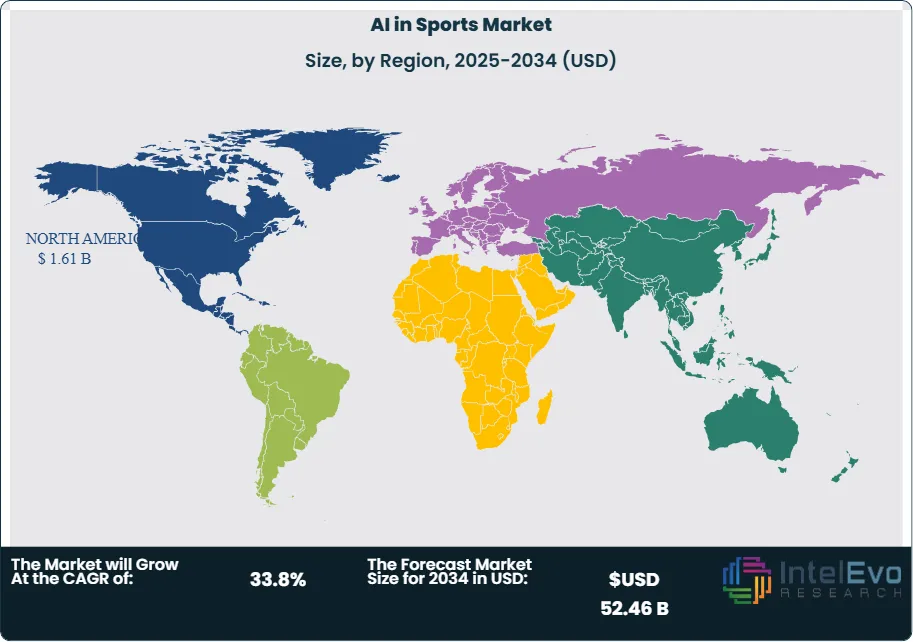
North America remains the largest market in 2025 with ~38–40% share (≈USD 1.6–1.8 billion), supported by data-rich ecosystems across the NFL, NBA, MLB, NHL, and NCAA, and deep partnerships between leagues, broadcasters, and AI vendors. Europe follows (~28–30%) on sustained adoption in football (EPL, Bundesliga, La Liga) and tennis/cricket, with GDPR-aligned data architectures shaping deployment choices and vendor selection.
Asia Pacific is the fastest-growing region (projected ~30–35% CAGR through 2030) as cricket, football, and basketball franchises scale tracking and content automation; APAC’s share is poised to rise from the low-20s in 2025 toward ~28–30% by 2030. Latin America expands on football analytics and cost-efficient CV capture, while the Middle East & Africa accelerates via government-backed sports investments and smart-venue builds linked to mega-events, making the Gulf a near-term innovation hotspot despite a smaller installed base.
By Component (Software, Service), By Deployment Mode (Cloud, On-premise), By Technology (Machine Learning, Natural Language Processing, Computer Vision, Others), By Application(Player Analysis, Fan Engagement, Data Interpretation & Analysis, Other Applications)
Research Methodology
Primary Research- 100 Interviews of Stakeholders
Secondary Research
Desk Research
Regional scope
North America (United States, Canada, Mexico)
Latin America (Brazil, Argentina, Columbia)
East Asia And Pacific (China, Japan, South Korea, Australia, Cambodia, Fiji, Indonesia)
Sea And South Asia (India, Singapore, Thailand, Taiwan, Malaysia)
Eastern Europe (Poland, Russia, Czech Republic, Romania)
Western Europe (Germany, U.K., France, Spain, Itlay)
Middle East & Africa (GCC Countries, Egypt, Nigeria, South Africa, Israel)
Competitive Landscape
SAP SE, SAS Institute Inc, Opta Sports (Perform Group), Catapult Group International Ltd, TruMedia Networks, Salesforce.com Inc., IBM Corporation, Sportradar AG, Microsoft Corporation, Genius Sports Group, WSC Sports, Hawk-Eye Innovations, Pixellot Ltd., Zebra Technologies, Oracle Corporation, Stats Perform, ShotTracker Inc., Zebra-Motorola Solutions, Kognitiv Spark
Customization Scope
Customization for segments, region/country-level will be provided. Moreover, additional customization can be done based on the requirements.
Pricing and Purchase Options
Avail customized purchase options to meet your exact research needs. We have three licenses to opt for: Single User License, Multi-User License (Up to 5 Users), Corporate Use License (Unlimited User and Printable PDF).
TABLE OF CONTENTS
1. EXECUTIVE SUMMARY
1.1. MARKET SNAPSHOT
1.2. KEY FINDINGS & INSIGHTS
1.3. ANALYST RECOMMENDATIONS
1.4. FUTURE OUTLOOK
2. RESEARCH METHODOLOGY
2.1. MARKET DEFINITION & SCOPE
2.2. RESEARCH OBJECTIVES: PRIMARY & SECONDARY DATA SOURCES
2.3. DATA COLLECTION SOURCES
2.3.1. COVERAGE OF 100+ PRIMARY RESEARCH/CONSULTATION CALLS WITH INDUSTRY STAKEHOLDERS
FIGURE 17 NORTH AMERICA AI IN SPORTS CURRENT AND FUTURE TYPE ANALYSIS, 2025–2034, (USD MILLION)
FIGURE 18 NORTH AMERICA AI IN SPORTS CURRENT AND FUTURE END USER ANALYSIS, 2025–2034, (USD MILLION)
FIGURE 19 MARKET SHARE BY COUNTRY
FIGURE 20 LATIN AMERICA AI IN SPORTS CURRENT AND FUTURE TYPE ANALYSIS, 2025–2034, (USD MILLION)
FIGURE 21 LATIN AMERICA AI IN SPORTS CURRENT AND FUTURE END USER ANALYSIS, 2025–2034, (USD MILLION)
FIGURE 22 MARKET SHARE BY COUNTRY
FIGURE 23 EASTERN EUROPE AI IN SPORTS CURRENT AND FUTURE TYPE ANALYSIS, 2025–2034, (USD MILLION)
FIGURE 24 EASTERN EUROPE AI IN SPORTS CURRENT AND FUTURE END USER ANALYSIS, 2025–2034, (USD MILLION)
FIGURE 25 MARKET SHARE BY COUNTRY
FIGURE 26 WESTERN EUROPE AI IN SPORTS CURRENT AND FUTURE TYPE ANALYSIS, 2025–2034, (USD MILLION)
FIGURE 27 WESTERN EUROPE AI IN SPORTS CURRENT AND FUTURE END USER ANALYSIS, 2025–2034, (USD MILLION)
FIGURE 28 MARKET SHARE BY COUNTRY
FIGURE 29 EAST ASIA AND PACIFIC AI IN SPORTS CURRENT AND FUTURE TYPE ANALYSIS, 2025–2034, (USD MILLION)
FIGURE 30 EAST ASIA AND PACIFIC AI IN SPORTS CURRENT AND FUTURE END USER ANALYSIS, 2025–2034, (USD MILLION)
FIGURE 31 MARKET SHARE BY COUNTRY
FIGURE 32 SEA AND SOUTH ASIA AI IN SPORTS CURRENT AND FUTURE TYPE ANALYSIS, 2025–2034, (USD MILLION)
FIGURE 33 SEA AND SOUTH ASIA AI IN SPORTS CURRENT AND FUTURE END USER ANALYSIS, 2025–2034, (USD MILLION)
FIGURE 34 MARKET SHARE BY COUNTRY
FIGURE 35 MIDDLE EAST AND AFRICA AI IN SPORTS CURRENT AND FUTURE TYPE ANALYSIS, 2025–2034, (USD MILLION)
FIGURE 36 MIDDLE EAST AND AFRICA AI IN SPORTS CURRENT AND FUTURE END USER ANALYSIS, 2025–2034, (USD MILLION)
FIGURE 37 NORTH AMERICA AI IN SPORTS CURRENT AND FUTURE MARKET VOLUME SHARE REGIONAL ANALYSIS, 2025–2034, (USD MILLION)
FIGURE 38 U.S. AI IN SPORTS CURRENT AND FUTURE TYPE ANALYSIS, 2025–2034, (USD MILLION)
FIGURE 39 U.S. AI IN SPORTS CURRENT AND FUTURE END USER ANALYSIS, 2025–2034, (USD MILLION)
FIGURE 40 CANADA AI IN SPORTS CURRENT AND FUTURE TYPE ANALYSIS, 2025–2034, (USD MILLION)
FIGURE 41 CANADA AI IN SPORTS CURRENT AND FUTURE END USER ANALYSIS, 2025–2034, (USD MILLION)
FIGURE 42 LATIN AMERICA AI IN SPORTS CURRENT AND FUTURE MARKET VOLUME SHARE REGIONAL ANALYSIS, 2025–2034, (USD MILLION)
FIGURE 43 MEXICO AI IN SPORTS CURRENT AND FUTURE TYPE ANALYSIS, 2025–2034, (USD MILLION)
FIGURE 44 MEXICO AI IN SPORTS CURRENT AND FUTURE END USER ANALYSIS, 2025–2034, (USD MILLION)
FIGURE 45 BRAZIL AI IN SPORTS CURRENT AND FUTURE TYPE ANALYSIS, 2025–2034, (USD MILLION)
FIGURE 46 BRAZIL AI IN SPORTS CURRENT AND FUTURE END USER ANALYSIS, 2025–2034, (USD MILLION)
FIGURE 47 ARGENTINA AI IN SPORTS CURRENT AND FUTURE TYPE ANALYSIS, 2025–2034, (USD MILLION)
FIGURE 48 ARGENTINA AI IN SPORTS CURRENT AND FUTURE END USER ANALYSIS, 2025–2034, (USD MILLION)
FIGURE 49 COLUMBIA AI IN SPORTS CURRENT AND FUTURE TYPE ANALYSIS, 2025–2034, (USD MILLION)
FIGURE 50 COLUMBIA AI IN SPORTS CURRENT AND FUTURE END USER ANALYSIS, 2025–2034, (USD MILLION)
FIGURE 51 REST OF LATIN AMERICA AI IN SPORTS CURRENT AND FUTURE TYPE ANALYSIS, 2025–2034, (USD MILLION)
FIGURE 52 REST OF LATIN AMERICA AI IN SPORTS CURRENT AND FUTURE END USER ANALYSIS, 2025–2034, (USD MILLION)
FIGURE 53 EASTERN EUROPE AI IN SPORTS CURRENT AND FUTURE MARKET VOLUME SHARE REGIONAL ANALYSIS, 2025–2034, (USD MILLION)
FIGURE 54 POLAND AI IN SPORTS CURRENT AND FUTURE TYPE ANALYSIS, 2025–2034, (USD MILLION)
FIGURE 55 POLAND AI IN SPORTS CURRENT AND FUTURE END USER ANALYSIS, 2025–2034, (USD MILLION)
FIGURE 56 RUSSIA AI IN SPORTS CURRENT AND FUTURE TYPE ANALYSIS, 2025–2034, (USD MILLION)
FIGURE 57 RUSSIA AI IN SPORTS CURRENT AND FUTURE END USER ANALYSIS, 2025–2034, (USD MILLION)
FIGURE 58 CZECH REPUBLIC AI IN SPORTS CURRENT AND FUTURE TYPE ANALYSIS, 2025–2034, (USD MILLION)
FIGURE 59 CZECH REPUBLIC AI IN SPORTS CURRENT AND FUTURE END USER ANALYSIS, 2025–2034, (USD MILLION)
FIGURE 60 ROMANIA AI IN SPORTS CURRENT AND FUTURE TYPE ANALYSIS, 2025–2034, (USD MILLION)
FIGURE 61 ROMANIA AI IN SPORTS CURRENT AND FUTURE END USER ANALYSIS, 2025–2034, (USD MILLION)
FIGURE 62 REST OF EASTERN EUROPE AI IN SPORTS CURRENT AND FUTURE TYPE ANALYSIS, 2025–2034, (USD MILLION)
FIGURE 63 REST OF EASTERN EUROPE AI IN SPORTS CURRENT AND FUTURE END USER ANALYSIS, 2025–2034, (USD MILLION)
FIGURE 64 WESTERN EUROPE AI IN SPORTS CURRENT AND FUTURE MARKET VOLUME SHARE REGIONAL ANALYSIS, 2025–2034, (USD MILLION)
FIGURE 65 GERMANY AI IN SPORTS CURRENT AND FUTURE TYPE ANALYSIS, 2025–2034, (USD MILLION)
FIGURE 66 GERMANY AI IN SPORTS CURRENT AND FUTURE END USER ANALYSIS, 2025–2034, (USD MILLION)
FIGURE 67 FRANCE AI IN SPORTS CURRENT AND FUTURE TYPE ANALYSIS, 2025–2034, (USD MILLION)
FIGURE 68 FRANCE AI IN SPORTS CURRENT AND FUTURE END USER ANALYSIS, 2025–2034, (USD MILLION)
FIGURE 69 UK AI IN SPORTS CURRENT AND FUTURE TYPE ANALYSIS, 2025–2034, (USD MILLION)
FIGURE 70 UK AI IN SPORTS CURRENT AND FUTURE END USER ANALYSIS, 2025–2034, (USD MILLION)
FIGURE 71 SPAIN AI IN SPORTS CURRENT AND FUTURE TYPE ANALYSIS, 2025–2034, (USD MILLION)
FIGURE 72 SPAIN AI IN SPORTS CURRENT AND FUTURE END USER ANALYSIS, 2025–2034, (USD MILLION)
FIGURE 73 ITALY AI IN SPORTS CURRENT AND FUTURE TYPE ANALYSIS, 2025–2034, (USD MILLION)
FIGURE 74 ITALY AI IN SPORTS CURRENT AND FUTURE END USER ANALYSIS, 2025–2034, (USD MILLION)
FIGURE 75 REST OF WESTERN EUROPE AI IN SPORTS CURRENT AND FUTURE TYPE ANALYSIS, 2025–2034, (USD MILLION)
FIGURE 76 REST OF WESTERN EUROPE AI IN SPORTS CURRENT AND FUTURE END USER ANALYSIS, 2025–2034, (USD MILLION)
FIGURE 77 EAST ASIA AND PACIFIC AI IN SPORTS CURRENT AND FUTURE MARKET VOLUME SHARE REGIONAL ANALYSIS, 2025–2034, (USD MILLION)
FIGURE 78 CHINA AI IN SPORTS CURRENT AND FUTURE TYPE ANALYSIS, 2025–2034, (USD MILLION)
FIGURE 79 CHINA AI IN SPORTS CURRENT AND FUTURE END USER ANALYSIS, 2025–2034, (USD MILLION)
FIGURE 80 JAPAN AI IN SPORTS CURRENT AND FUTURE TYPE ANALYSIS, 2025–2034, (USD MILLION)
FIGURE 81 JAPAN AI IN SPORTS CURRENT AND FUTURE END USER ANALYSIS, 2025–2034, (USD MILLION)
FIGURE 82 AUSTRALIA AI IN SPORTS CURRENT AND FUTURE TYPE ANALYSIS, 2025–2034, (USD MILLION)
FIGURE 83 AUSTRALIA AI IN SPORTS CURRENT AND FUTURE END USER ANALYSIS, 2025–2034, (USD MILLION)
FIGURE 84 CAMBODIA AI IN SPORTS CURRENT AND FUTURE TYPE ANALYSIS, 2025–2034, (USD MILLION)
FIGURE 85 CAMBODIA AI IN SPORTS CURRENT AND FUTURE END USER ANALYSIS, 2025–2034, (USD MILLION)
FIGURE 86 FIJI AI IN SPORTS CURRENT AND FUTURE TYPE ANALYSIS, 2025–2034, (USD MILLION)
FIGURE 87 FIJI AI IN SPORTS CURRENT AND FUTURE END USER ANALYSIS, 2025–2034, (USD MILLION)
FIGURE 88 INDONESIA AI IN SPORTS CURRENT AND FUTURE TYPE ANALYSIS, 2025–2034, (USD MILLION)
FIGURE 89 INDONESIA AI IN SPORTS CURRENT AND FUTURE END USER ANALYSIS, 2025–2034, (USD MILLION)
FIGURE 90 SOUTH KOREA AI IN SPORTS CURRENT AND FUTURE TYPE ANALYSIS, 2025–2034, (USD MILLION)
FIGURE 91 SOUTH KOREA AI IN SPORTS CURRENT AND FUTURE END USER ANALYSIS, 2025–2034, (USD MILLION)
FIGURE 92 REST OF EAST ASIA AND PACIFIC AI IN SPORTS CURRENT AND FUTURE TYPE ANALYSIS, 2025–2034, (USD MILLION)
FIGURE 93 REST OF EAST ASIA AND PACIFIC AI IN SPORTS CURRENT AND FUTURE END USER ANALYSIS, 2025–2034, (USD MILLION)
FIGURE 94 SEA AND SOUTH ASIA AI IN SPORTS CURRENT AND FUTURE MARKET VOLUME SHARE REGIONAL ANALYSIS, 2025–2034, (USD MILLION)
FIGURE 95 BANGLADESH AI IN SPORTS CURRENT AND FUTURE TYPE ANALYSIS, 2025–2034, (USD MILLION)
FIGURE 96 BANGLADESH AI IN SPORTS CURRENT AND FUTURE END USER ANALYSIS, 2025–2034, (USD MILLION)
FIGURE 97 NEW ZEALAND AI IN SPORTS CURRENT AND FUTURE TYPE ANALYSIS, 2025–2034, (USD MILLION)
FIGURE 98 NEW ZEALAND AI IN SPORTS CURRENT AND FUTURE END USER ANALYSIS, 2025–2034, (USD MILLION)
FIGURE 99 INDIA AI IN SPORTS CURRENT AND FUTURE TYPE ANALYSIS, 2025–2034, (USD MILLION)
FIGURE 100 INDIA AI IN SPORTS CURRENT AND FUTURE END USER ANALYSIS, 2025–2034, (USD MILLION)
FIGURE 101 SINGAPORE AI IN SPORTS CURRENT AND FUTURE TYPE ANALYSIS, 2025–2034, (USD MILLION)
FIGURE 102 SINGAPORE AI IN SPORTS CURRENT AND FUTURE END USER ANALYSIS, 2025–2034, (USD MILLION)
FIGURE 103 THAILAND AI IN SPORTS CURRENT AND FUTURE TYPE ANALYSIS, 2025–2034, (USD MILLION)
FIGURE 104 THAILAND AI IN SPORTS CURRENT AND FUTURE END USER ANALYSIS, 2025–2034, (USD MILLION)
FIGURE 105 TAIWAN AI IN SPORTS CURRENT AND FUTURE TYPE ANALYSIS, 2025–2034, (USD MILLION)
FIGURE 106 TAIWAN AI IN SPORTS CURRENT AND FUTURE END USER ANALYSIS, 2025–2034, (USD MILLION)
FIGURE 107 MALAYSIA AI IN SPORTS CURRENT AND FUTURE TYPE ANALYSIS, 2025–2034, (USD MILLION)
FIGURE 108 MALAYSIA AI IN SPORTS CURRENT AND FUTURE END USER ANALYSIS, 2025–2034, (USD MILLION)
FIGURE 109 REST OF SEA AND SOUTH ASIA AI IN SPORTS CURRENT AND FUTURE TYPE ANALYSIS, 2025–2034, (USD MILLION)
FIGURE 110 REST OF SEA AND SOUTH ASIA AI IN SPORTS CURRENT AND FUTURE END USER ANALYSIS, 2025–2034, (USD MILLION)
FIGURE 111 MIDDLE EAST AND AFRICA AI IN SPORTS CURRENT AND FUTURE MARKET VOLUME SHARE REGIONAL ANALYSIS, 2025–2034, (USD MILLION)
FIGURE 112 GCC COUNTRIES AI IN SPORTS CURRENT AND FUTURE TYPE ANALYSIS, 2025–2034, (USD MILLION)
FIGURE 113 GCC COUNTRIES AI IN SPORTS CURRENT AND FUTURE END USER ANALYSIS, 2025–2034, (USD MILLION)
FIGURE 114 SAUDI ARABIA AI IN SPORTS CURRENT AND FUTURE TYPE ANALYSIS, 2025–2034, (USD MILLION)
FIGURE 115 SAUDI ARABIA AI IN SPORTS CURRENT AND FUTURE END USER ANALYSIS, 2025–2034, (USD MILLION)
FIGURE 116 UAE AI IN SPORTS CURRENT AND FUTURE TYPE ANALYSIS, 2025–2034, (USD MILLION)
FIGURE 117 UAE AI IN SPORTS CURRENT AND FUTURE END USER ANALYSIS, 2025–2034, (USD MILLION)
FIGURE 118 BAHRAIN AI IN SPORTS CURRENT AND FUTURE TYPE ANALYSIS, 2025–2034, (USD MILLION)
FIGURE 119 BAHRAIN AI IN SPORTS CURRENT AND FUTURE END USER ANALYSIS, 2025–2034, (USD MILLION)
FIGURE 120 KUWAIT AI IN SPORTS CURRENT AND FUTURE TYPE ANALYSIS, 2025–2034, (USD MILLION)
FIGURE 121 KUWAIT AI IN SPORTS CURRENT AND FUTURE END USER ANALYSIS, 2025–2034, (USD MILLION)
FIGURE 122 OMAN AI IN SPORTS CURRENT AND FUTURE TYPE ANALYSIS, 2025–2034, (USD MILLION)
FIGURE 123 OMAN AI IN SPORTS CURRENT AND FUTURE END USER ANALYSIS, 2025–2034, (USD MILLION)
FIGURE 124 QATAR AI IN SPORTS CURRENT AND FUTURE TYPE ANALYSIS, 2025–2034, (USD MILLION)
FIGURE 125 QATAR AI IN SPORTS CURRENT AND FUTURE END USER ANALYSIS, 2025–2034, (USD MILLION)
FIGURE 126 EGYPT AI IN SPORTS CURRENT AND FUTURE TYPE ANALYSIS, 2025–2034, (USD MILLION)
FIGURE 127 EGYPT AI IN SPORTS CURRENT AND FUTURE END USER ANALYSIS, 2025–2034, (USD MILLION)
FIGURE 128 NIGERIA AI IN SPORTS CURRENT AND FUTURE TYPE ANALYSIS, 2025–2034, (USD MILLION)
FIGURE 129 NIGERIA AI IN SPORTS CURRENT AND FUTURE END USER ANALYSIS, 2025–2034, (USD MILLION)
FIGURE 130 SOUTH AFRICA AI IN SPORTS CURRENT AND FUTURE TYPE ANALYSIS, 2025–2034, (USD MILLION)
FIGURE 131 SOUTH AFRICA AI IN SPORTS CURRENT AND FUTURE END USER ANALYSIS, 2025–2034, (USD MILLION)
FIGURE 132 ISRAEL AI IN SPORTS CURRENT AND FUTURE TYPE ANALYSIS, 2025–2034, (USD MILLION)
FIGURE 133 ISRAEL AI IN SPORTS CURRENT AND FUTURE END USER ANALYSIS, 2025–2034, (USD MILLION)
FIGURE 134 REST OF MEA AI IN SPORTS CURRENT AND FUTURE TYPE ANALYSIS, 2025–2034, (USD MILLION)
FIGURE 135 REST OF MEA AI IN SPORTS CURRENT AND FUTURE END USER ANALYSIS, 2025–2034, (USD MILLION)
FIGURE 136 U. S. MARKET SHARE ANALYSIS BY TYPE (2024)
FIGURE 137 U. S. MARKET SHARE ANALYSIS BY END USER (2024)
FIGURE 138 CANADA MARKET SHARE ANALYSIS BY TYPE (2024)
FIGURE 139 CANADA MARKET SHARE ANALYSIS BY END USER (2024)
FIGURE 140 MEXICO MARKET SHARE ANALYSIS BY TYPE (2024)
FIGURE 141 MEXICO MARKET SHARE ANALYSIS BY END USER (2024)
FIGURE 142 CHINA MARKET SHARE ANALYSIS BY TYPE (2024)
FIGURE 143 CHINA MARKET SHARE ANALYSIS BY END USER (2024)
FIGURE 144 JAPAN MARKET SHARE ANALYSIS BY TYPE (2024)
FIGURE 145 JAPAN MARKET SHARE ANALYSIS BY END USER (2024)
FIGURE 146 INDIA MARKET SHARE ANALYSIS BY TYPE (2024)
FIGURE 147 INDIA MARKET SHARE ANALYSIS BY END USER (2024)
FIGURE 148 SOUTH KOREA MARKET SHARE ANALYSIS BY TYPE (2024)
FIGURE 149 SOUTH KOREA MARKET SHARE ANALYSIS BY END USER (2024)
FIGURE 150 SAUDI ARABIA MARKET SHARE ANALYSIS BY TYPE (2024)
FIGURE 151 SAUDI ARABIA MARKET SHARE ANALYSIS BY END USER (2024)
FIGURE 152 UAE MARKET SHARE ANALYSIS BY TYPE (2024)
FIGURE 153 UAE MARKET SHARE ANALYSIS BY END USER (2024)
FIGURE 154 EGYPT MARKET SHARE ANALYSIS BY TYPE (2024)
FIGURE 155 EGYPT MARKET SHARE ANALYSIS BY END USER (2024)
FIGURE 156 NIGERIA MARKET SHARE ANALYSIS BY TYPE (2024)
FIGURE 157 NIGERIA MARKET SHARE ANALYSIS BY END USER (2024)
FIGURE 158 SOUTH AFRICA MARKET SHARE ANALYSIS BY TYPE (2024)
FIGURE 159 SOUTH AFRICA MARKET SHARE ANALYSIS BY END USER (2024)
FIGURE 160 GERMANY MARKET SHARE ANALYSIS BY TYPE (2024)
FIGURE 161 GERMANY MARKET SHARE ANALYSIS BY END USER (2024)
FIGURE 162 FRANCE MARKET SHARE ANALYSIS BY TYPE (2024)
FIGURE 163 FRANCE MARKET SHARE ANALYSIS BY END USER (2024)
FIGURE 164 UK MARKET SHARE ANALYSIS BY TYPE (2024)
FIGURE 165 UK MARKET SHARE ANALYSIS BY END USER (2024)
FIGURE 166 SPAIN MARKET SHARE ANALYSIS BY TYPE (2024)
FIGURE 167 SPAIN MARKET SHARE ANALYSIS BY END USER (2024)
FIGURE 168 ITALY MARKET SHARE ANALYSIS BY TYPE (2024)
FIGURE 169 ITALY MARKET SHARE ANALYSIS BY END USER (2024)
FIGURE 170 BRAZIL MARKET SHARE ANALYSIS BY TYPE (2024)
FIGURE 171 BRAZIL MARKET SHARE ANALYSIS BY END USER (2024)
FIGURE 172 ARGENTINA MARKET SHARE ANALYSIS BY TYPE (2024)
FIGURE 173 ARGENTINA MARKET SHARE ANALYSIS BY END USER (2024)
FIGURE 174 COLUMBIA MARKET SHARE ANALYSIS BY TYPE (2024)
FIGURE 175 COLUMBIA MARKET SHARE ANALYSIS BY END USER (2024)
FIGURE 176 GLOBAL AI IN SPORTS CURRENT AND FUTURE MARKET KEY COUNTRY LEVEL ANALYSIS, 2024–2034, (USD MILLION)
FIGURE 177 FINANCIAL OVERVIEW:
Key Player Analysis
Veg India Exports:Niche/Out-of-scope. Veg India Exports is an Indian exporter of moringa derivatives and spices, with no publicly disclosed products, partnerships, or R&D related to AI in sports. Given its core portfolio (moringa oil, seeds, powders, spice blends), the company does not participate in athlete tracking, computer vision, data platforms, or fan-engagement technologies that define this market. For investors, the firm should not be weighted in competitive landscapes for AI in Sports, and its inclusion reflects a classification mismatch rather than adjacency.
SAS Institute Inc:Leader / Innovator. SAS has deep traction in sports with its Viya® data and AI platform, positioning as an enterprise analytics backbone for rights holders and venues. In 2025, SAS announced new club and venue deals—e.g., Los Angeles Football Club (LAFC) to apply real-time analytics to player performance and fan behavior—and expanded its work with the Orlando Magic to personalize gameday and digital experiences. These moves underline SAS’s differentiation in end-to-end pipelines (data ingestion, model ops, decisioning) and cross-functional use cases that blend performance, ticketing/CRM, and media analytics. Strategically, SAS’s partnerships support sticky, multi-year platform contracts and reinforce its status as a safe, compliance-ready choice for tier-one organizations.
Opta Sports (Perform Group):Leader / Disruptor (as part of Stats Perform). Opta is the flagship data brand of Stats Perform and a reference standard for real-time sports data used by teams, broadcasters, and betting operators. The company’s Opta Vision product fuses computer vision with generative AI to generate uninterrupted XY tracking for all 22 players—enriching event data with positional context and enabling new layers of analysis and storytelling. In 2025, industry recognition for OptaAI/OptaAI Studio in broadcast workflows underscored the brand’s pace of productization in generative and multimodal data. Opta’s differentiators are scale, latency, and the fusion of human coding with AI enrichment, which together expand monetization for rights holders across highlights, personalization, and advanced performance metrics.
Catapult Group International Ltd:Leader / Category Specialist. Catapult is a top provider of athlete-performance wearables and analytics (e.g., Vector GPS units, ClearSky LPS, and OpenField software) used across elite teams globally. Financially, the company entered 2025 with improving fundamentals: revenue rose ~19% to about US$100 million for the year to March, gross margin expanded to ~81%, and free cash flow turned positive; management cited a base of 3,300+ franchises with ~US$25k average annual contract value. Strategically, Catapult is leaning into operating leverage and product breadth—integrating video, workload, and return-to-play analytics—to defend share while women’s sport and streaming-era properties expand budgets for performance tech. Its edge lies in validated on-field outcomes, hardware-software integration, and a large installed base that raises switching costs for customers.
Key Market Players
SAP SE
SAS Institute Inc
Opta Sports (Perform Group)
Catapult Group International Ltd
TruMedia Networks
Salesforce.com Inc.
IBM Corporation
Sportradar AG
Microsoft Corporation
Genius Sports Group
WSC Sports
Hawk-Eye Innovations
Pixellot Ltd.
Zebra Technologies
Oracle Corporation
Stats Perform
ShotTracker Inc.
Zebra-Motorola Solutions
Kognitiv Spark
Driver:
AI-Driven Performance and Media Optimization Accelerating Market Growth
As of 2025, rights holders are scaling AI from pilots to core workflows to extract measurable on-field and media ROI. With the market tracking toward ~USD 4.4 billion in 2025 (on a path to USD 36.7 billion by 2034; ~30% CAGR), budgets are concentrating in computer vision–led tracking, predictive player availability, and automated media production. Top-tier clubs report double-digit gains from AI-enabled load management—often 10–20% reductions in soft-tissue injuries—while broadcasters see 8–12% uplifts in watch time from personalized feeds and automated highlights. Falling inference costs at the edge and vendor ecosystems (e.g., Genius Sports/Second Spectrum, WSC Sports, Pixellot, Catapult, Hawk-Eye, AWS) further compress time-to-value, making AI a strategic differentiator across performance, content, and integrity operations.
Restraint:
Data Governance and Regulatory Complexity Restricting AI Scalability
Data governance is the primary brake on scaling. Athlete biometrics, tracking data, and tactical IP are increasingly treated as sensitive personal and competitive assets, driving a persistent on-prem/hybrid bias and adding 10–15% to total cost of ownership for compliance, access control, and auditability. Fragmented regulations (e.g., GDPR in Europe, state privacy laws in the U.S.) complicate cross-border datasets needed for model generalization; in parallel, explainability requirements in selection and injury-risk models slow deployment at academies and federations. Integration debt—retrofitting multi-venue camera estates and harmonizing legacy data—extends rollout timelines and diverts spend from innovation to foundational data engineering.
Opportunity:
Smart Venues, Mid-Market Teams, and APAC Expansion Unlocking Major Opportunities
The next wave of growth sits at the intersection of smart venues, mid-market clubs, and APAC expansion. AI-orchestrated operations—crowd flow, safety, and energy—are moving from proofs to portfolio programs, creating a multi-billion-dollar addressable pool by 2030 as stadiums standardize sensors and edge inference. In sport media, generative personalization layers (context-aware highlights, synthetic commentary, virtual signage) are compounding monetization, with early adopters reporting mid-single-digit ad-yield lifts that scale materially at league audiences. Regionally, Asia Pacific is the fastest-growing corridor (often ~30–35% CAGR through 2030) as cricket, football, and basketball franchises adopt low-cost optical capture and cloud-delivered analytics; vendors that package CV hardware, SaaS analytics, and compliance playbooks will outgrow the category.
Trend:
Multimodal and Generative AI Transforming Coaching, Content, and Infrastructure
Multimodal and generative AI are redefining both coaching and content. On the performance side, models now fuse optical tracking, inertial wearables, and contextual event data to build athlete digital twins and reinforcement-learning strategy simulators—elevating scenario planning and opponent prep. On the media side, GenAI automates metadata, creates chapterized highlights, and enables real-time, localized overlays at scale; rights holders are shifting from tool experiments to platform contracts that bundle SDKs/APIs into OTT and betting ecosystems. Under the hood, confidential computing, federated learning, and policy-based access controls are catalyzing a shift from pure on-prem (still ~55–58% in 2025) toward hybrid architectures expected to dominate before decade’s end, compressing deployment cycles and broadening adoption beyond elite teams.
Recent Developments
Dec 2024 – Stats Perform: Expanded its long-term exclusive official media data agreement with Football DataCo, confirming Opta as the official insights provider across Premier League, EFL, SPFL and SWPL; AI-powered Opta insights will be integrated into broadcast and digital coverage from the 2025/26 season. Strengthens Opta’s data moat and accelerates AI-enriched storytelling and monetization for top-tier football properties.
Feb 2025 – Stats Perform (Grand Slam Track): Selected as the exclusive global data and betting rights distributor—and integrity partner—for Michael Johnson’s new Grand Slam Track series, launching with four events in 2025 and 90+ contracted athletes, with U.S. distribution via Peacock/CW. Extends Stats Perform’s rights and integrity footprint into elite athletics, creating a new AI-ready dataset for media and betting partners.
Apr 2025 – UFC & Meta Platforms: Announced a multiyear “fan technology” partnership giving UFC access to Meta AI, Meta Glasses, Meta Quest and social platforms (Facebook, Instagram, WhatsApp, Threads), including plans to incorporate AI glasses at events; financial terms undisclosed. Embeds big-tech AI and mixed-reality hardware into a global combat-sports IP, setting the pace for immersive, data-rich fan experiences.
Jun 2025 – IBM & AELTC (Wimbledon): Launched “Match Chat,” a real-time GenAI assistant built on watsonx, and upgraded “Likelihood to Win” for Wimbledon’s app and site, enabling instant, context-aware insights during live singles matches. Validates LLM-driven, event-time analytics at one of sport’s biggest global stages, reinforcing IBM’s role in AI-enabled fan engagement.
Jul 2025 – Microsoft & Premier League: Entered a five-year strategic partnership naming Microsoft the Premier League’s official cloud and AI partner; launched a Copilot-powered “Premier League Companion” and began migrating league infrastructure to Azure to support generative, multilingual and archive-aware experiences. Expands Microsoft’s end-to-end stack presence in global football and sets a template for league-wide AI platforms.
Sep 2025 – Meta (Oakley & Ray-Ban): Unveiled Oakley “Vanguard” smart glasses for athletes at $499 (9-hour battery, Garmin/Strava integrations) alongside the Ray-Ban Display with an in-lens screen; U.S./Canada retail begins Oct 21. Intensifies competition in AI wearables for training and content capture, opening new data streams for teams, broadcasters, and sponsors.