
- Home
- Industries
 Aerospace And Defence
 Agriculture
 Automotive And Transportation
 Banking And Finance
 Business
 Chemicals And Materials
 Consumer And Retail
 Electronics And Semiconductors
 Food And Beverages
 Machinery & Equipments
 Manufacturing And Construction
 Medical Devices
 Others
 Pharmaceuticals And Healthcare
 Power And Energy
 Sports
 Technology
- Services
- News Room
- About us
- Contact Us
-
AI in Supply Chain Market Size, Growth & Forecast | CAGR of 41.9%
Global AI in Supply Chain Market Size, Share & Digital Logistics Analysis By Component (Software, Hardware, Services), By Technology (Machine Learning, Computer Vision, Natural Language Processing), Application (Inventory Management, Demand Forecasting, Fleet Management, Supplier Management), End-Use (Retail, Transportation & Logistics, Automotive, Food & Beverage, Consumer Goods & Electronics, Healthcare), ROI Impact, Key Vendors & Forecast 2025–2034

Report Overview
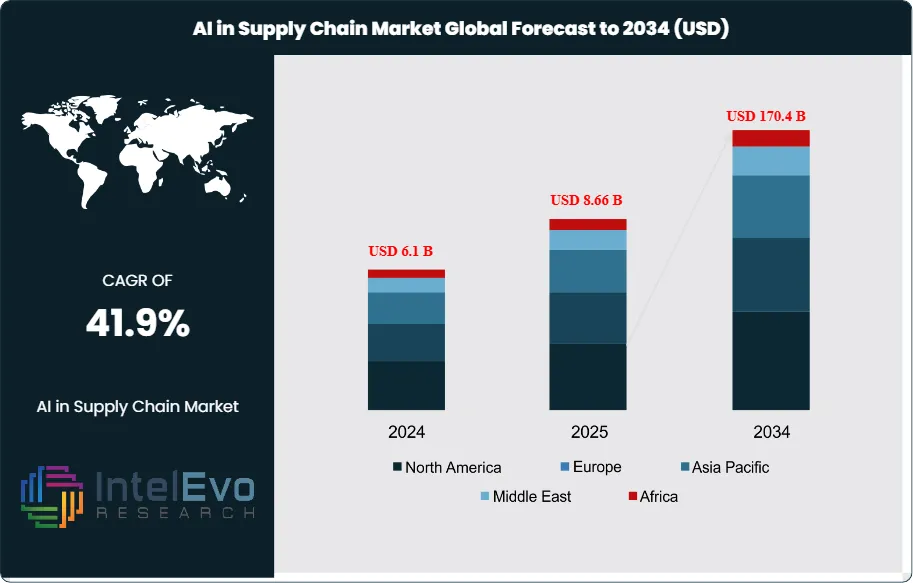
The AI in Supply Chain Market is estimated at USD 6.1 billion in 2024 and is projected to reach approximately USD 170.4 billion by 2034, registering a robust CAGR of about 41.9% during 2025–2034. This exceptional growth reflects accelerating adoption of AI-driven demand forecasting, inventory optimization, and autonomous planning tools as enterprises respond to persistent supply disruptions and cost pressures. Integration of generative AI, real-time analytics, and digital twins is enabling faster decision-making across procurement, logistics, and warehousing. As global supply chains prioritize resilience, visibility, and efficiency, AI is rapidly shifting from pilot deployments to mission-critical infrastructure across manufacturing, retail, and logistics networks.
Get More Information about this report -
Request Free Sample ReportAI adoption in supply chains has accelerated sharply over the past five years. Companies are shifting from manual workflows to intelligent systems that automate planning, forecasting, and execution. This shift is driven by rising demand for real-time visibility, predictive analytics, and cost control across manufacturing, logistics, and retail. In 2023, 75% of supply chain professionals used AI-powered analytics to uncover actionable insights. These tools helped reduce decision latency and improve responsiveness to market shifts.
AI-enabled traceability and visibility solutions have reached 68% adoption, resulting in a 22% boost in operational efficiency. Predictive maintenance, used by 70% of manufacturers, has lowered downtime and extended asset life. Quality control systems powered by AI have cut product defects by 18%, while AI-driven planning tools have reduced inventory levels by 35% and logistics costs by 15%. Early adopters also report a 65% improvement in service levels.
The market’s growth is supported by expanding data availability and the integration of AI with IoT, ERP, and sensor networks. Vendors are tailoring solutions to specific pain points—whether it's demand forecasting, warehouse automation, or supplier risk management. This has created a competitive landscape of tech firms, integrators, and consultancies offering modular and interoperable platforms.
North America leads in AI deployment, driven by large-scale investments and mature digital infrastructure. Europe follows closely, with strong regulatory support for AI in logistics and manufacturing. Asia Pacific is emerging as a high-growth region, especially in China and India, where supply chain modernization is accelerating. Investors should monitor Southeast Asia and Latin America, where rising e-commerce and industrial automation are creating new demand pockets.
As AI becomes embedded across supply chain functions, your organization must assess where automation can deliver the highest returns. The next decade will favor firms that act decisively, integrate AI into core operations, and build adaptive supply networks that respond to volatility with speed and precision.
, By Technology (Machine Learning, Computer Vision, Natural Language Processing), Application (Inventory Management, Demand Forecasting, Fleet Management, Supplier Management), End-Use (Retail, Transportation & Logistics, Automotive, Food & Beverage, Consumer Goods & Electronics, Healthcare), ROI Impact, Key Vendors & Forecast 2025–2034")
Key Takeaways
- Market Growth: The global AI in supply chain market was valued at USD 6.1 billion in 2024 and is projected to reach USD 170.4 billion by 2034, expanding at a CAGR of 41.9%. Growth is driven by rising demand for automation, predictive analytics, and real-time visibility across industries.
- Component: Software accounted for 64.8% of total revenue in 2023. AI-driven platforms are central to integrating predictive analytics, automation, and decision-support tools into supply chain operations.
- Technology: Machine learning held 44% share in 2023. Its ability to improve demand forecasting, inventory optimization, and anomaly detection makes it the most widely adopted AI technology in supply chains.
- Application: Demand forecasting led with 35.3% share in 2023. Companies using AI-based forecasting reported up to 35% reductions in inventory levels and 15% lower logistics costs, highlighting its direct financial impact.
- End Use: The retail sector captured 24.1% share in 2023. Retailers deploy AI to manage stock levels, enhance supply chain visibility, and deliver personalized customer experiences, making it the largest end-use industry.
- Driver: High adoption of AI-enabled visibility and traceability solutions is reshaping supply chains. In 2023, 68% of organizations deployed such tools, achieving a 22% efficiency gain across operations.
- Restraint: High implementation costs and integration challenges remain barriers. Small and mid-sized enterprises face limited budgets, slowing adoption despite proven efficiency gains.
- Opportunity: Asia Pacific is emerging as a high-growth region, with China and India accelerating AI adoption in logistics and manufacturing. The region is expected to post a CAGR above 45% through 2033, creating strong investment potential.
- Trend: AI-powered quality control and predictive maintenance are gaining traction. In 2023, 82% of organizations used AI for inspection, reducing product defects by 18%, while 70% of manufacturers applied predictive maintenance to cut downtime.
- Regional Analysis: North America led with 37.9% share in 2023, supported by strong R&D investments and early adoption. Europe follows with regulatory support for AI in logistics, while Asia Pacific is the fastest-growing region, driven by rapid industrial digitalization.
By Component
In 2025, software continues to dominate the AI in supply chain market, accounting for more than 65% of total revenue. Its leadership reflects the central role of AI-driven platforms in automating planning, forecasting, and logistics execution. Companies are increasingly deploying predictive analytics, route optimization tools, and AI-enabled freight brokerage systems to reduce costs and improve decision accuracy. Cloud-based deployments are accelerating adoption by lowering upfront capital requirements and making advanced solutions accessible to mid-sized enterprises.
The software segment is also benefiting from rapid advances in machine learning and natural language processing, which enhance the precision of demand forecasting and supplier risk assessment. Vendors are embedding AI into enterprise resource planning (ERP) and warehouse management systems, creating integrated platforms that deliver real-time visibility across global supply chains. This integration is critical as organizations seek to manage volatility in demand, transportation bottlenecks, and supplier disruptions.
Hardware and services, while smaller in share, are gaining traction as complementary components. AI-enabled sensors, IoT devices, and robotics are expanding in warehouses and logistics hubs, while consulting and integration services are in demand to support large-scale digital transformation projects. Together, these segments are expected to grow at double-digit rates through 2030, reinforcing the software-led ecosystem.
By Technology
Machine learning remains the largest technology segment in 2025, representing more than 45% of market revenue. Its strength lies in the ability to process vast datasets and generate actionable insights for forecasting, inventory optimization, and logistics planning. Companies using ML-based forecasting tools report inventory reductions of up to 30% and service-level improvements exceeding 60%.
Computer vision is expanding rapidly, particularly in quality inspection, warehouse automation, and cargo monitoring. Adoption is being driven by e-commerce and automotive industries, where real-time defect detection and automated sorting are critical. Natural language processing is also gaining ground, enabling AI-driven supplier communications, contract analysis, and customer service automation.
Investment from global technology leaders is accelerating the development of specialized AI models for supply chain use cases. These include reinforcement learning for adaptive logistics planning and hybrid AI systems that combine ML with IoT data streams. Such advancements are expected to expand the addressable market and deepen AI integration across industries.
By Application
Demand forecasting continues to lead applications in 2025, holding more than 36% of market share. AI-driven forecasting models integrate sales history, macroeconomic indicators, and real-time consumer behavior to improve accuracy. This capability reduces the risks of overstocking and understocking, which remain costly challenges for manufacturers and retailers.
Inventory management and fleet optimization are also expanding rapidly. AI-enabled systems are helping logistics providers cut fuel consumption by up to 12% through route optimization, while predictive maintenance reduces downtime by 20% in transportation fleets. Supplier management applications are gaining traction as companies seek to mitigate risks from geopolitical instability and raw material shortages.
The growing use of IoT-enabled data streams is enhancing the precision of AI applications across all categories. Real-time monitoring of shipments, warehouse conditions, and supplier performance is enabling faster adjustments to disruptions, strengthening resilience in global supply chains.
By End-Use Industry
Retail remains the largest end-use sector in 2025, accounting for more than 25% of total adoption. Retailers are deploying AI to align inventory with consumer demand, reduce logistics costs, and personalize customer engagement. AI-driven demand forecasting has become a standard tool for large retailers, while smaller players are adopting cloud-based solutions to remain competitive.
Transportation and logistics companies are the second-largest adopters, using AI for fleet management, predictive maintenance, and route optimization. The sector is under pressure to reduce costs and emissions, making AI adoption a strategic priority. Automotive and consumer electronics manufacturers are also scaling AI deployments to manage complex supplier networks and ensure quality control.
Healthcare and food and beverage industries are emerging as high-growth adopters. AI is being used to monitor cold chain logistics, ensure regulatory compliance, and manage demand fluctuations in sensitive product categories. These industries are expected to post above-average growth rates through 2030.
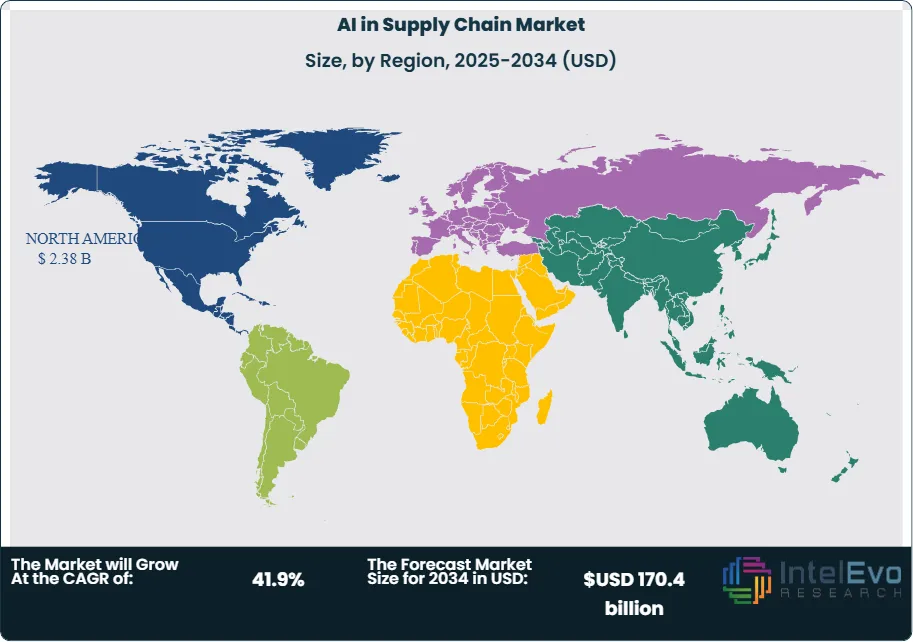
By Region
North America continues to lead the global market in 2025, holding more than 38% share. The region benefits from strong digital infrastructure, early adoption by Fortune 500 companies, and sustained investment in AI research and development. The United States remains the largest single market, supported by technology leaders and a mature logistics sector.
Europe follows with significant adoption in Germany, the UK, and France, where regulatory support for digital supply chains and sustainability initiatives is driving AI integration. Asia Pacific, however, is the fastest-growing region, with China and India leading adoption in manufacturing, e-commerce, and logistics. The region is projected to grow at a CAGR above 45% through 2030, fueled by rapid industrial digitalization and government-backed AI initiatives.
Latin America and the Middle East & Africa are emerging markets with rising adoption in retail and logistics. Brazil, Mexico, and the UAE are investing in AI-enabled infrastructure to improve supply chain resilience. While their market shares remain smaller, these regions represent untapped opportunities for technology providers seeking expansion beyond mature economies.
Get More Information about this report -
Request Free Sample ReportMarket Key Segments
By Component
- Software
- Hardware
- Services
By Technology
- Machine Learning
- Computer Vision
- Natural Language Processing (NLP)
- Other Technologies
Application
- Inventory Management
- Demand Forecasting
- Fleet Management
- Supplier Management
- Other Applications
End-Use Industry
- Retail
- Transportation & Logistics
- Automotive
- Food & Beverage
- Consumer Goods & Electronics
- Healthcare
- Other End-Use Industries
Regions
- North America
- Latin America
- East Asia And Pacific
- Sea And South Asia
- Eastern Europe
- Western Europe
- Middle East & Africa
| Report Attribute | Details |
| Market size (2024) | USD 6.1 billion |
| Forecast Revenue (2034) | USD 170.4 billion |
| CAGR (2024-2034) | 41.9% |
| Historical data | 2020-2023 |
| Base Year For Estimation | 2024 |
| Forecast Period | 2025-2034 |
| Report coverage | Revenue Forecast, Competitive Landscape, Market Dynamics, Growth Factors, Trends and Recent Developments |
| Segments covered | By Component (Software, Hardware, Services), By Technology (Machine Learning, Computer Vision, Natural Language Processing (NLP), Other Technologies), Application (Inventory Management, Demand Forecasting, Fleet Management, Supplier Management, Other Applications), End-Use Industry (Retail, Transportation & Logistics, Automotive, Food & Beverage, Consumer Goods & Electronics, Healthcare, Other End-Use Industries) |
| Research Methodology |
|
| Regional scope |
|
| Competitive Landscape | NVIDIA Corporation, Kinaxis Inc., Oracle Corporation, IBM Corporation, Anaplan Inc., Google LLC, Blue Yonder Group Inc., Amazon Web Services Inc., SAP SE, C3.ai Inc., Microsoft Corporation, Coupa Software, Other Key Players |
| Customization Scope | Customization for segments, region/country-level will be provided. Moreover, additional customization can be done based on the requirements. |
| Pricing and Purchase Options | Avail customized purchase options to meet your exact research needs. We have three licenses to opt for: Single User License, Multi-User License (Up to 5 Users), Corporate Use License (Unlimited User and Printable PDF). |
, By Technology (Machine Learning, Computer Vision, Natural Language Processing), Application (Inventory Management, Demand Forecasting, Fleet Management, Supplier Management), End-Use (Retail, Transportation & Logistics, Automotive, Food & Beverage, Consumer Goods & Electronics, Healthcare), ROI Impact, Key Vendors & Forecast 2025–2034")
, By Technology (Machine Learning, Computer Vision, Natural Language Processing), Application (Inventory Management, Demand Forecasting, Fleet Management, Supplier Management), End-Use (Retail, Transportation & Logistics, Automotive, Food & Beverage, Consumer Goods & Electronics, Healthcare), ROI Impact, Key Vendors & Forecast 2025–2034")
, By Technology (Machine Learning, Computer Vision, Natural Language Processing), Application (Inventory Management, Demand Forecasting, Fleet Management, Supplier Management), End-Use (Retail, Transportation & Logistics, Automotive, Food & Beverage, Consumer Goods & Electronics, Healthcare), ROI Impact, Key Vendors & Forecast 2025–2034")
Frequently Asked Questions
How big is the AI in Supply Chain Market?
The AI in Supply Chain Market is projected to grow from USD 6.1 billion in 2024 to USD 170.4 billion by 2034, at a 41.9% CAGR. Growth is driven by AI-powered demand forecasting, inventory optimization, digital twins, and real-time analytics improving resilience, visibility, and efficiency across global supply chains.
Who are the major players in the AI in Supply Chain Market?
NVIDIA Corporation, Kinaxis Inc., Oracle Corporation, IBM Corporation, Anaplan Inc., Google LLC, Blue Yonder Group Inc., Amazon Web Services Inc., SAP SE, C3.ai Inc., Microsoft Corporation, Coupa Software, Other Key Players
Which segments covered the AI in Supply Chain Market?
By Component (Software, Hardware, Services), By Technology (Machine Learning, Computer Vision, Natural Language Processing (NLP), Other Technologies), Application (Inventory Management, Demand Forecasting, Fleet Management, Supplier Management, Other Applications), End-Use Industry (Retail, Transportation & Logistics, Automotive, Food & Beverage, Consumer Goods & Electronics, Healthcare, Other End-Use Industries)
How can this market research report help my business make strategic decisions?
Our market research reports provide actionable intelligence, including verified market size data, CAGR projections, competitive benchmarking, and segment-level opportunity analysis. These insights support strategic planning, investment decisions, product development, and market entry strategies for enterprises and startups alike.
How frequently is the data updated?
We continuously monitor industry developments and update our reports to reflect regulatory changes, technological advancements, and macroeconomic shifts. Updated editions ensure you receive the latest market intelligence.

Select Licence Type
Connect with our sales team
Why IntelEvoResearch
100%
Customer
Satisfaction
24x7+
Availability - we are always
there when you need us
200+
Fortune 50 Companies trust
IntelEvoResearch
80%
of our reports are exclusive
and first in the industry
100%
more data
and analysis
1000+
reports published
till date