AI in Ultrasound Imaging Market Size & Forecast 2024–2034 | 8.8% CAGR
Global AI in Ultrasound Imaging Market Size, Share & Industry Analysis By Solution (Hardware, Software, Services), By Technology (Machine Learning, Natural Language Processing, Computer Vision, Context-Aware Computing), By Application (Radiology, Cardiovascular, Obstetrics, Gastroenterology, Breast Screening, Gynecology), By End User (Hospitals, Clinics), Regional Insights, Competitive Landscape, Innovation Trends & Forecast 2025–2034
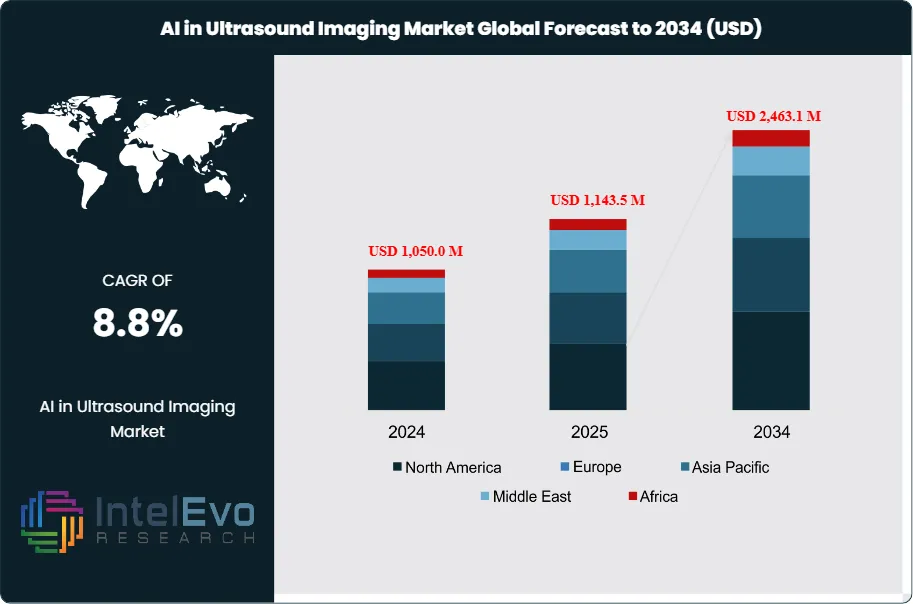
The AI in Ultrasound Imaging Market was valued at USD 1,050.0 Million in 2024 and is projected to reach approximately USD 2,463.1 Million by 2034. The market is estimated to grow to around USD 1,143.5 Million in 2025. Based on projected expansion from 2026 onward, the industry is expected to register a compound annual growth rate (CAGR) of approximately 8.8% during 2026–2034.
Demand rises as disease burden lifts imaging volumes and forces providers to do more with limited specialist capacity. Ultrasound remains a front-line tool across obstetrics, cardiology, abdominal imaging, and point-of-care triage, and AI adoption accelerates where it shortens exam time and tightens diagnostic consistency. Cancer screening and follow-up also support utilization; the American Cancer Society estimated 238,810 new lung and bronchus cancer cases in the United States in 2023, which reinforces sustained demand for earlier detection pathways that include imaging. Hospitals and imaging centers should represent about 55% of 2024 revenue, while portable and point-of-care systems post the fastest unit growth as ultrasound use expands into emergency, critical care, and community settings.
On the supply side, vendors prioritize software layers that integrate with existing scanners and deliver real-time guidance, automated measurements, segmentation, and structured reporting. Integrated automation reduces operator dependence and improves repeatability, which increases the economic case for deployment at scale. Software and services are projected to rise from roughly 32% of revenue in 2024 to about 40% by 2034 as subscriptions, model updates, and workflow analytics gain share. Cloud-based interoperability also shapes purchasing decisions, and initiatives such as Google Cloud’s Medical Imaging Suite introduced in October 2022 highlight the push to make imaging data easier to exchange across PACS, EHRs, and analytics environments.
Regulatory and reimbursement dynamics set constraints and create differentiation. U.S. FDA pathways and CE marking remain essential gates, and procurement teams demand stronger evidence for clinical benefit, dataset representativeness, and post-market monitoring. Data privacy requirements under HIPAA and GDPR add compliance cost and elevate cybersecurity as a selection factor. Key risks include algorithm drift, medico-legal exposure from missed findings, workflow friction during integration, and uneven reimbursement coverage for AI-enabled functions.
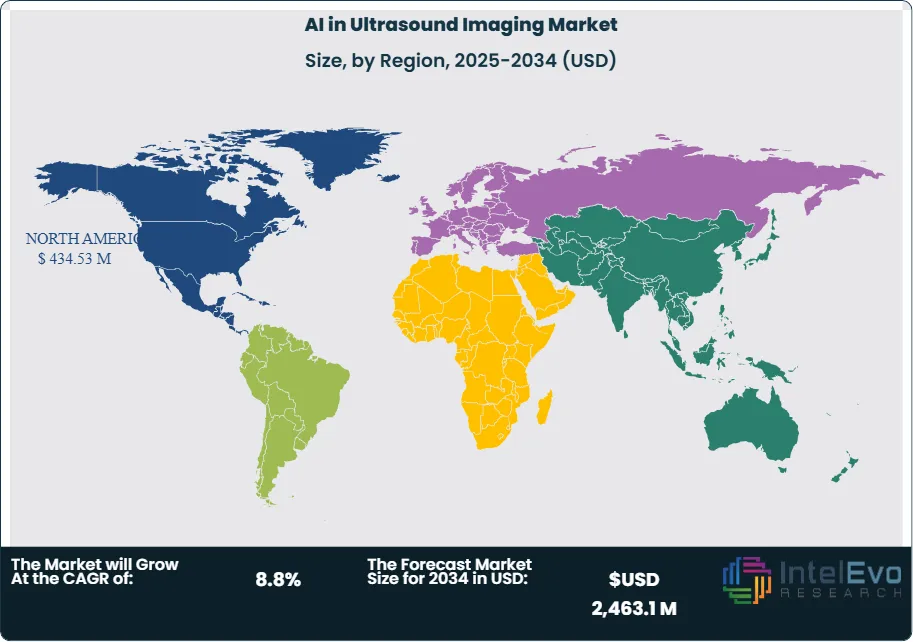
Regionally, North America is expected to hold about 38% of 2034 revenue due to established digital imaging infrastructure and faster enterprise rollout. Asia-Pacific should deliver the highest growth, near 10–11%, with investment hotspots in China, India, Japan, and Southeast Asia as systems scale maternal care, cardiometabolic screening, and mobile diagnostics. Europe remains a steady adopter, led by Germany, the U.K., and France, where providers focus on standardization and workforce productivity.
Key Takeaways
Market Growth: The market expanded strongly, reaching estimated: 1.0 billion USD, 2024, supported by rising clinical throughput needs. It sustains estimated: 8.9% CAGR, 2024-2034.
Segment Dominance : Solution software led adoption with a 61.3% share, 2023, reflecting rapid deployment across imaging workflows. This position implies estimated: 0.7 billion USD, 2024.
Segment Dominance: Deep learning captured the largest model share, estimated: 58.0% share, 2023, driven by performance in complex image interpretation. It represents estimated: 0.6 billion USD, 2024.
Driver: Neurology use cases accelerated demand as providers applied AI to neurological disorder workflows, estimated: 28.0% share, 2024. This driver supports higher utilization across 2024-2034 at estimated: 9.2% CAGR, 2024-2034.
Restraint: Clinical validation and regulatory clearance cycles slow scale-up, extending time-to-market to estimated: 18.0 months, 2024. Compliance and data-governance costs pressure margins at estimated: 12.0% of revenue, 2024.
Opportunity: Hospitals accelerate procurement for early detection and triage, representing estimated: 55.0% share, 2024. Enterprise rollouts can lift software attach rates to estimated: 40.0% share, 2034.
Trend: Ultrasound workflow automation increases adoption via real-time guidance and automatic measurements, reducing scan time by estimated: 20.0%, 2024. Digital deployment expands via device-integrated and cloud-enabled delivery at estimated: 35.0% penetration, 2024.
Regional Analysis: North America led performance in 2023 with estimated: 38.0% share, 2023, supported by higher digital imaging maturity. Regional investment sustains growth at estimated: 8.5% CAGR, 2024-2034.
By Solution
Software remains the primary revenue contributor within AI-enabled ultrasound systems as the market moves deeper into 2025. Software platforms accounted for about 61.3% of global revenue in 2023 and continue to dominate due to recurring license models and subscription-based upgrades. You see strong adoption where software integrates directly with existing ultrasound equipment, reducing capital expenditure while improving diagnostic consistency. Cloud deployment and wider broadband access across healthcare systems support faster implementation, particularly in multi-site hospital networks.
Hardware demand grows at a steadier pace, driven by AI-ready scanners and edge-computing devices deployed in emergency and point-of-care settings. Growth remains moderate because many providers prefer software retrofits over full system replacement. Services, however, show the fastest expansion outlook through 2034. Workforce shortages in AI system training, validation, and maintenance push providers to rely on third-party implementation and managed services. Service revenue is projected to grow at over 10% CAGR as hospitals prioritize operational continuity and compliance.
By Application
Neurology leads application-level revenue, holding roughly 39.5% share in 2023. AI-assisted ultrasound supports stroke triage, neuro-oncology monitoring, vascular assessment, and traumatic brain injury screening. You benefit from faster interpretation and reduced dependence on specialist availability, which remains limited in many regions. Radiology follows closely as AI improves lesion detection, image segmentation, and workflow throughput across high-volume imaging departments.
Breast screening records the strongest growth trajectory beyond 2025, supported by rising breast cancer incidence and public screening programs. Early-stage detection tools using AI-assisted ultrasound gain traction in regions with limited access to mammography. Government-backed initiatives such as India’s state-level screening programs accelerate adoption by expanding access and lowering diagnostic delays. Obstetrics and gynecology also post steady growth as maternal risk monitoring becomes more data-driven.
By End-User
Hospitals represent the largest end-user group, accounting for an estimated 55% of market revenue in 2024. You see higher uptake in tertiary and teaching hospitals where imaging volumes justify AI investment. Hospitals prioritize AI tools that shorten scan times, improve diagnostic accuracy, and support multidisciplinary care pathways.
Clinics show faster percentage growth, particularly diagnostic and specialty centers focused on women’s health and neurology. Lower-cost software solutions and portable ultrasound systems make AI adoption viable outside large hospital settings. This shift expands market reach and supports decentralized care models.
By Region
North America remains the leading regional market with about 32.1% share in 2023. High healthcare spending, rapid technology adoption, and a growing elderly population drive sustained demand. In the United States, adults aged over 65 are projected to exceed 80 million by 2040, increasing chronic disease imaging needs.
Asia Pacific records the fastest growth through 2034, supported by cost-sensitive healthcare expansion and rising demand for accurate prenatal and neurological diagnostics. You see strong momentum in China, India, and Southeast Asia as providers adopt AI to manage volume pressure at lower cost. Europe shows stable growth with emphasis on regulatory compliance, while Latin America and the Middle East and Africa remain emerging markets with improving infrastructure and targeted public health investments.
By Solution (Hardware, Software, Services), By Technology (Machine Learning, Natural Language Processing, Context Aware Computing, Computer Vision), By Applications (Radiology, Cardiovascular, Gastroenterology, Obstetrics, Breast screening, Gynecology), By End User (Hospitals, Clinics)
Research Methodology
Primary Research- 100 Interviews of Stakeholders
Secondary Research
Desk Research
Regional scope
North America (United States, Canada, Mexico)
Latin America (Brazil, Argentina, Columbia)
East Asia And Pacific (China, Japan, South Korea, Australia, Cambodia, Fiji, Indonesia)
Sea And South Asia (India, Singapore, Thailand, Taiwan, Malaysia)
Eastern Europe (Poland, Russia, Czech Republic, Romania)
Western Europe (Germany, U.K., France, Spain, Itlay)
Middle East & Africa (GCC Countries, Egypt, Nigeria, South Africa, Israel)
Competitive Landscape
Butterfly Network, Inc., Micron Technology, Inc., Imagia Cybernetics, Inc., Intel Corporation, Samsung, CloudMedX, Inc., GENERAL ELECTRIC COMPANY, EchoNous, Inc., Microsoft, General Vision, Inc.
Customization Scope
Customization for segments, region/country-level will be provided. Moreover, additional customization can be done based on the requirements.
Pricing and Purchase Options
Avail customized purchase options to meet your exact research needs. We have three licenses to opt for: Single User License, Multi-User License (Up to 5 Users), Corporate Use License (Unlimited User and Printable PDF).
TABLE OF CONTENTS
1. EXECUTIVE SUMMARY
1.1. MARKET SNAPSHOT
1.2. KEY FINDINGS & INSIGHTS
1.3. ANALYST RECOMMENDATIONS
1.4. FUTURE OUTLOOK
2. RESEARCH METHODOLOGY
2.1. MARKET DEFINITION & SCOPE
2.2. RESEARCH OBJECTIVES: PRIMARY & SECONDARY DATA SOURCES
2.3. DATA COLLECTION SOURCES
2.3.1. COVERAGE OF 100+ PRIMARY RESEARCH/CONSULTATION CALLS WITH INDUSTRY STAKEHOLDERS
FIGURE 17 NORTH AMERICA AI IN ULTRASOUND IMAGINGCURRENT AND FUTURE TYPE ANALYSIS, 2025–2034, (USD MILLION)
FIGURE 18 NORTH AMERICA AI IN ULTRASOUND IMAGINGCURRENT AND FUTURE END USER ANALYSIS, 2025–2034, (USD MILLION)
FIGURE 19 MARKET SHARE BY COUNTRY
FIGURE 20 LATIN AMERICA AI IN ULTRASOUND IMAGINGCURRENT AND FUTURE TYPE ANALYSIS, 2025–2034, (USD MILLION)
FIGURE 21 LATIN AMERICA AI IN ULTRASOUND IMAGINGCURRENT AND FUTURE END USER ANALYSIS, 2025–2034, (USD MILLION)
FIGURE 22 MARKET SHARE BY COUNTRY
FIGURE 23 EASTERN EUROPE AI IN ULTRASOUND IMAGINGCURRENT AND FUTURE TYPE ANALYSIS, 2025–2034, (USD MILLION)
FIGURE 24 EASTERN EUROPE AI IN ULTRASOUND IMAGINGCURRENT AND FUTURE END USER ANALYSIS, 2025–2034, (USD MILLION)
FIGURE 25 MARKET SHARE BY COUNTRY
FIGURE 26 WESTERN EUROPE AI IN ULTRASOUND IMAGINGCURRENT AND FUTURE TYPE ANALYSIS, 2025–2034, (USD MILLION)
FIGURE 27 WESTERN EUROPE AI IN ULTRASOUND IMAGINGCURRENT AND FUTURE END USER ANALYSIS, 2025–2034, (USD MILLION)
FIGURE 28 MARKET SHARE BY COUNTRY
FIGURE 29 EAST ASIA AND PACIFIC AI IN ULTRASOUND IMAGINGCURRENT AND FUTURE TYPE ANALYSIS, 2025–2034, (USD MILLION)
FIGURE 30 EAST ASIA AND PACIFIC AI IN ULTRASOUND IMAGINGCURRENT AND FUTURE END USER ANALYSIS, 2025–2034, (USD MILLION)
FIGURE 31 MARKET SHARE BY COUNTRY
FIGURE 32 SEA AND SOUTH ASIA AI IN ULTRASOUND IMAGINGCURRENT AND FUTURE TYPE ANALYSIS, 2025–2034, (USD MILLION)
FIGURE 33 SEA AND SOUTH ASIA AI IN ULTRASOUND IMAGINGCURRENT AND FUTURE END USER ANALYSIS, 2025–2034, (USD MILLION)
FIGURE 34 MARKET SHARE BY COUNTRY
FIGURE 35 MIDDLE EAST AND AFRICA AI IN ULTRASOUND IMAGINGCURRENT AND FUTURE TYPE ANALYSIS, 2025–2034, (USD MILLION)
FIGURE 36 MIDDLE EAST AND AFRICA AI IN ULTRASOUND IMAGINGCURRENT AND FUTURE END USER ANALYSIS, 2025–2034, (USD MILLION)
FIGURE 37 NORTH AMERICA AI IN ULTRASOUND IMAGINGCURRENT AND FUTURE MARKET VOLUME SHARE REGIONAL ANALYSIS, 2025–2034, (USD MILLION)
FIGURE 38 U.S. AI IN ULTRASOUND IMAGINGCURRENT AND FUTURE TYPE ANALYSIS, 2025–2034, (USD MILLION)
FIGURE 39 U.S. AI IN ULTRASOUND IMAGINGCURRENT AND FUTURE END USER ANALYSIS, 2025–2034, (USD MILLION)
FIGURE 40 CANADA AI IN ULTRASOUND IMAGINGCURRENT AND FUTURE TYPE ANALYSIS, 2025–2034, (USD MILLION)
FIGURE 41 CANADA AI IN ULTRASOUND IMAGINGCURRENT AND FUTURE END USER ANALYSIS, 2025–2034, (USD MILLION)
FIGURE 42 LATIN AMERICA AI IN ULTRASOUND IMAGINGCURRENT AND FUTURE MARKET VOLUME SHARE REGIONAL ANALYSIS, 2025–2034, (USD MILLION)
FIGURE 43 MEXICO AI IN ULTRASOUND IMAGINGCURRENT AND FUTURE TYPE ANALYSIS, 2025–2034, (USD MILLION)
FIGURE 44 MEXICO AI IN ULTRASOUND IMAGINGCURRENT AND FUTURE END USER ANALYSIS, 2025–2034, (USD MILLION)
FIGURE 45 BRAZIL AI IN ULTRASOUND IMAGINGCURRENT AND FUTURE TYPE ANALYSIS, 2025–2034, (USD MILLION)
FIGURE 46 BRAZIL AI IN ULTRASOUND IMAGINGCURRENT AND FUTURE END USER ANALYSIS, 2025–2034, (USD MILLION)
FIGURE 47 ARGENTINA AI IN ULTRASOUND IMAGINGCURRENT AND FUTURE TYPE ANALYSIS, 2025–2034, (USD MILLION)
FIGURE 48 ARGENTINA AI IN ULTRASOUND IMAGINGCURRENT AND FUTURE END USER ANALYSIS, 2025–2034, (USD MILLION)
FIGURE 49 COLUMBIA AI IN ULTRASOUND IMAGINGCURRENT AND FUTURE TYPE ANALYSIS, 2025–2034, (USD MILLION)
FIGURE 50 COLUMBIA AI IN ULTRASOUND IMAGINGCURRENT AND FUTURE END USER ANALYSIS, 2025–2034, (USD MILLION)
FIGURE 51 REST OF LATIN AMERICA AI IN ULTRASOUND IMAGINGCURRENT AND FUTURE TYPE ANALYSIS, 2025–2034, (USD MILLION)
FIGURE 52 REST OF LATIN AMERICA AI IN ULTRASOUND IMAGINGCURRENT AND FUTURE END USER ANALYSIS, 2025–2034, (USD MILLION)
FIGURE 53 EASTERN EUROPE AI IN ULTRASOUND IMAGINGCURRENT AND FUTURE MARKET VOLUME SHARE REGIONAL ANALYSIS, 2025–2034, (USD MILLION)
FIGURE 54 POLAND AI IN ULTRASOUND IMAGINGCURRENT AND FUTURE TYPE ANALYSIS, 2025–2034, (USD MILLION)
FIGURE 55 POLAND AI IN ULTRASOUND IMAGINGCURRENT AND FUTURE END USER ANALYSIS, 2025–2034, (USD MILLION)
FIGURE 56 RUSSIA AI IN ULTRASOUND IMAGINGCURRENT AND FUTURE TYPE ANALYSIS, 2025–2034, (USD MILLION)
FIGURE 57 RUSSIA AI IN ULTRASOUND IMAGINGCURRENT AND FUTURE END USER ANALYSIS, 2025–2034, (USD MILLION)
FIGURE 58 CZECH REPUBLIC AI IN ULTRASOUND IMAGINGCURRENT AND FUTURE TYPE ANALYSIS, 2025–2034, (USD MILLION)
FIGURE 59 CZECH REPUBLIC AI IN ULTRASOUND IMAGINGCURRENT AND FUTURE END USER ANALYSIS, 2025–2034, (USD MILLION)
FIGURE 60 ROMANIA AI IN ULTRASOUND IMAGINGCURRENT AND FUTURE TYPE ANALYSIS, 2025–2034, (USD MILLION)
FIGURE 61 ROMANIA AI IN ULTRASOUND IMAGINGCURRENT AND FUTURE END USER ANALYSIS, 2025–2034, (USD MILLION)
FIGURE 62 REST OF EASTERN EUROPE AI IN ULTRASOUND IMAGINGCURRENT AND FUTURE TYPE ANALYSIS, 2025–2034, (USD MILLION)
FIGURE 63 REST OF EASTERN EUROPE AI IN ULTRASOUND IMAGINGCURRENT AND FUTURE END USER ANALYSIS, 2025–2034, (USD MILLION)
FIGURE 64 WESTERN EUROPE AI IN ULTRASOUND IMAGINGCURRENT AND FUTURE MARKET VOLUME SHARE REGIONAL ANALYSIS, 2025–2034, (USD MILLION)
FIGURE 65 GERMANY AI IN ULTRASOUND IMAGINGCURRENT AND FUTURE TYPE ANALYSIS, 2025–2034, (USD MILLION)
FIGURE 66 GERMANY AI IN ULTRASOUND IMAGINGCURRENT AND FUTURE END USER ANALYSIS, 2025–2034, (USD MILLION)
FIGURE 67 FRANCE AI IN ULTRASOUND IMAGINGCURRENT AND FUTURE TYPE ANALYSIS, 2025–2034, (USD MILLION)
FIGURE 68 FRANCE AI IN ULTRASOUND IMAGINGCURRENT AND FUTURE END USER ANALYSIS, 2025–2034, (USD MILLION)
FIGURE 69 UK AI IN ULTRASOUND IMAGINGCURRENT AND FUTURE TYPE ANALYSIS, 2025–2034, (USD MILLION)
FIGURE 70 UK AI IN ULTRASOUND IMAGINGCURRENT AND FUTURE END USER ANALYSIS, 2025–2034, (USD MILLION)
FIGURE 71 SPAIN AI IN ULTRASOUND IMAGINGCURRENT AND FUTURE TYPE ANALYSIS, 2025–2034, (USD MILLION)
FIGURE 72 SPAIN AI IN ULTRASOUND IMAGINGCURRENT AND FUTURE END USER ANALYSIS, 2025–2034, (USD MILLION)
FIGURE 73 ITALY AI IN ULTRASOUND IMAGINGCURRENT AND FUTURE TYPE ANALYSIS, 2025–2034, (USD MILLION)
FIGURE 74 ITALY AI IN ULTRASOUND IMAGINGCURRENT AND FUTURE END USER ANALYSIS, 2025–2034, (USD MILLION)
FIGURE 75 REST OF WESTERN EUROPE AI IN ULTRASOUND IMAGINGCURRENT AND FUTURE TYPE ANALYSIS, 2025–2034, (USD MILLION)
FIGURE 76 REST OF WESTERN EUROPE AI IN ULTRASOUND IMAGINGCURRENT AND FUTURE END USER ANALYSIS, 2025–2034, (USD MILLION)
FIGURE 77 EAST ASIA AND PACIFIC AI IN ULTRASOUND IMAGINGCURRENT AND FUTURE MARKET VOLUME SHARE REGIONAL ANALYSIS, 2025–2034, (USD MILLION)
FIGURE 78 CHINA AI IN ULTRASOUND IMAGINGCURRENT AND FUTURE TYPE ANALYSIS, 2025–2034, (USD MILLION)
FIGURE 79 CHINA AI IN ULTRASOUND IMAGINGCURRENT AND FUTURE END USER ANALYSIS, 2025–2034, (USD MILLION)
FIGURE 80 JAPAN AI IN ULTRASOUND IMAGINGCURRENT AND FUTURE TYPE ANALYSIS, 2025–2034, (USD MILLION)
FIGURE 81 JAPAN AI IN ULTRASOUND IMAGINGCURRENT AND FUTURE END USER ANALYSIS, 2025–2034, (USD MILLION)
FIGURE 82 AUSTRALIA AI IN ULTRASOUND IMAGINGCURRENT AND FUTURE TYPE ANALYSIS, 2025–2034, (USD MILLION)
FIGURE 83 AUSTRALIA AI IN ULTRASOUND IMAGINGCURRENT AND FUTURE END USER ANALYSIS, 2025–2034, (USD MILLION)
FIGURE 84 CAMBODIA AI IN ULTRASOUND IMAGINGCURRENT AND FUTURE TYPE ANALYSIS, 2025–2034, (USD MILLION)
FIGURE 85 CAMBODIA AI IN ULTRASOUND IMAGINGCURRENT AND FUTURE END USER ANALYSIS, 2025–2034, (USD MILLION)
FIGURE 86 FIJI AI IN ULTRASOUND IMAGINGCURRENT AND FUTURE TYPE ANALYSIS, 2025–2034, (USD MILLION)
FIGURE 87 FIJI AI IN ULTRASOUND IMAGINGCURRENT AND FUTURE END USER ANALYSIS, 2025–2034, (USD MILLION)
FIGURE 88 INDONESIA AI IN ULTRASOUND IMAGINGCURRENT AND FUTURE TYPE ANALYSIS, 2025–2034, (USD MILLION)
FIGURE 89 INDONESIA AI IN ULTRASOUND IMAGINGCURRENT AND FUTURE END USER ANALYSIS, 2025–2034, (USD MILLION)
FIGURE 90 SOUTH KOREA AI IN ULTRASOUND IMAGINGCURRENT AND FUTURE TYPE ANALYSIS, 2025–2034, (USD MILLION)
FIGURE 91 SOUTH KOREA AI IN ULTRASOUND IMAGINGCURRENT AND FUTURE END USER ANALYSIS, 2025–2034, (USD MILLION)
FIGURE 92 REST OF EAST ASIA AND PACIFIC AI IN ULTRASOUND IMAGINGCURRENT AND FUTURE TYPE ANALYSIS, 2025–2034, (USD MILLION)
FIGURE 93 REST OF EAST ASIA AND PACIFIC AI IN ULTRASOUND IMAGINGCURRENT AND FUTURE END USER ANALYSIS, 2025–2034, (USD MILLION)
FIGURE 94 SEA AND SOUTH ASIA AI IN ULTRASOUND IMAGINGCURRENT AND FUTURE MARKET VOLUME SHARE REGIONAL ANALYSIS, 2025–2034, (USD MILLION)
FIGURE 95 BANGLADESH AI IN ULTRASOUND IMAGINGCURRENT AND FUTURE TYPE ANALYSIS, 2025–2034, (USD MILLION)
FIGURE 96 BANGLADESH AI IN ULTRASOUND IMAGINGCURRENT AND FUTURE END USER ANALYSIS, 2025–2034, (USD MILLION)
FIGURE 97 NEW ZEALAND AI IN ULTRASOUND IMAGINGCURRENT AND FUTURE TYPE ANALYSIS, 2025–2034, (USD MILLION)
FIGURE 98 NEW ZEALAND AI IN ULTRASOUND IMAGINGCURRENT AND FUTURE END USER ANALYSIS, 2025–2034, (USD MILLION)
FIGURE 99 INDIA AI IN ULTRASOUND IMAGINGCURRENT AND FUTURE TYPE ANALYSIS, 2025–2034, (USD MILLION)
FIGURE 100 INDIA AI IN ULTRASOUND IMAGINGCURRENT AND FUTURE END USER ANALYSIS, 2025–2034, (USD MILLION)
FIGURE 101 SINGAPORE AI IN ULTRASOUND IMAGINGCURRENT AND FUTURE TYPE ANALYSIS, 2025–2034, (USD MILLION)
FIGURE 102 SINGAPORE AI IN ULTRASOUND IMAGINGCURRENT AND FUTURE END USER ANALYSIS, 2025–2034, (USD MILLION)
FIGURE 103 THAILAND AI IN ULTRASOUND IMAGINGCURRENT AND FUTURE TYPE ANALYSIS, 2025–2034, (USD MILLION)
FIGURE 104 THAILAND AI IN ULTRASOUND IMAGINGCURRENT AND FUTURE END USER ANALYSIS, 2025–2034, (USD MILLION)
FIGURE 105 TAIWAN AI IN ULTRASOUND IMAGINGCURRENT AND FUTURE TYPE ANALYSIS, 2025–2034, (USD MILLION)
FIGURE 106 TAIWAN AI IN ULTRASOUND IMAGINGCURRENT AND FUTURE END USER ANALYSIS, 2025–2034, (USD MILLION)
FIGURE 107 MALAYSIA AI IN ULTRASOUND IMAGINGCURRENT AND FUTURE TYPE ANALYSIS, 2025–2034, (USD MILLION)
FIGURE 108 MALAYSIA AI IN ULTRASOUND IMAGINGCURRENT AND FUTURE END USER ANALYSIS, 2025–2034, (USD MILLION)
FIGURE 109 REST OF SEA AND SOUTH ASIA AI IN ULTRASOUND IMAGINGCURRENT AND FUTURE TYPE ANALYSIS, 2025–2034, (USD MILLION)
FIGURE 110 REST OF SEA AND SOUTH ASIA AI IN ULTRASOUND IMAGINGCURRENT AND FUTURE END USER ANALYSIS, 2025–2034, (USD MILLION)
FIGURE 111 MIDDLE EAST AND AFRICA AI IN ULTRASOUND IMAGINGCURRENT AND FUTURE MARKET VOLUME SHARE REGIONAL ANALYSIS, 2025–2034, (USD MILLION)
FIGURE 112 GCC COUNTRIES AI IN ULTRASOUND IMAGINGCURRENT AND FUTURE TYPE ANALYSIS, 2025–2034, (USD MILLION)
FIGURE 113 GCC COUNTRIES AI IN ULTRASOUND IMAGINGCURRENT AND FUTURE END USER ANALYSIS, 2025–2034, (USD MILLION)
FIGURE 114 SAUDI ARABIA AI IN ULTRASOUND IMAGINGCURRENT AND FUTURE TYPE ANALYSIS, 2025–2034, (USD MILLION)
FIGURE 115 SAUDI ARABIA AI IN ULTRASOUND IMAGINGCURRENT AND FUTURE END USER ANALYSIS, 2025–2034, (USD MILLION)
FIGURE 116 UAE AI IN ULTRASOUND IMAGINGCURRENT AND FUTURE TYPE ANALYSIS, 2025–2034, (USD MILLION)
FIGURE 117 UAE AI IN ULTRASOUND IMAGINGCURRENT AND FUTURE END USER ANALYSIS, 2025–2034, (USD MILLION)
FIGURE 118 BAHRAIN AI IN ULTRASOUND IMAGINGCURRENT AND FUTURE TYPE ANALYSIS, 2025–2034, (USD MILLION)
FIGURE 119 BAHRAIN AI IN ULTRASOUND IMAGINGCURRENT AND FUTURE END USER ANALYSIS, 2025–2034, (USD MILLION)
FIGURE 120 KUWAIT AI IN ULTRASOUND IMAGINGCURRENT AND FUTURE TYPE ANALYSIS, 2025–2034, (USD MILLION)
FIGURE 121 KUWAIT AI IN ULTRASOUND IMAGINGCURRENT AND FUTURE END USER ANALYSIS, 2025–2034, (USD MILLION)
FIGURE 122 OMAN AI IN ULTRASOUND IMAGINGCURRENT AND FUTURE TYPE ANALYSIS, 2025–2034, (USD MILLION)
FIGURE 123 OMAN AI IN ULTRASOUND IMAGINGCURRENT AND FUTURE END USER ANALYSIS, 2025–2034, (USD MILLION)
FIGURE 124 QATAR AI IN ULTRASOUND IMAGINGCURRENT AND FUTURE TYPE ANALYSIS, 2025–2034, (USD MILLION)
FIGURE 125 QATAR AI IN ULTRASOUND IMAGINGCURRENT AND FUTURE END USER ANALYSIS, 2025–2034, (USD MILLION)
FIGURE 126 EGYPT AI IN ULTRASOUND IMAGINGCURRENT AND FUTURE TYPE ANALYSIS, 2025–2034, (USD MILLION)
FIGURE 127 EGYPT AI IN ULTRASOUND IMAGINGCURRENT AND FUTURE END USER ANALYSIS, 2025–2034, (USD MILLION)
FIGURE 128 NIGERIA AI IN ULTRASOUND IMAGINGCURRENT AND FUTURE TYPE ANALYSIS, 2025–2034, (USD MILLION)
FIGURE 129 NIGERIA AI IN ULTRASOUND IMAGINGCURRENT AND FUTURE END USER ANALYSIS, 2025–2034, (USD MILLION)
FIGURE 130 SOUTH AFRICA AI IN ULTRASOUND IMAGINGCURRENT AND FUTURE TYPE ANALYSIS, 2025–2034, (USD MILLION)
FIGURE 131 SOUTH AFRICA AI IN ULTRASOUND IMAGINGCURRENT AND FUTURE END USER ANALYSIS, 2025–2034, (USD MILLION)
FIGURE 132 ISRAEL AI IN ULTRASOUND IMAGINGCURRENT AND FUTURE TYPE ANALYSIS, 2025–2034, (USD MILLION)
FIGURE 133 ISRAEL AI IN ULTRASOUND IMAGINGCURRENT AND FUTURE END USER ANALYSIS, 2025–2034, (USD MILLION)
FIGURE 134 REST OF MEA AI IN ULTRASOUND IMAGINGCURRENT AND FUTURE TYPE ANALYSIS, 2025–2034, (USD MILLION)
FIGURE 135 REST OF MEA AI IN ULTRASOUND IMAGINGCURRENT AND FUTURE END USER ANALYSIS, 2025–2034, (USD MILLION)
FIGURE 136 U. S. MARKET SHARE ANALYSIS BY TYPE (2024)
FIGURE 137 U. S. MARKET SHARE ANALYSIS BY END USER (2024)
FIGURE 138 CANADA MARKET SHARE ANALYSIS BY TYPE (2024)
FIGURE 139 CANADA MARKET SHARE ANALYSIS BY END USER (2024)
FIGURE 140 MEXICO MARKET SHARE ANALYSIS BY TYPE (2024)
FIGURE 141 MEXICO MARKET SHARE ANALYSIS BY END USER (2024)
FIGURE 142 CHINA MARKET SHARE ANALYSIS BY TYPE (2024)
FIGURE 143 CHINA MARKET SHARE ANALYSIS BY END USER (2024)
FIGURE 144 JAPAN MARKET SHARE ANALYSIS BY TYPE (2024)
FIGURE 145 JAPAN MARKET SHARE ANALYSIS BY END USER (2024)
FIGURE 146 INDIA MARKET SHARE ANALYSIS BY TYPE (2024)
FIGURE 147 INDIA MARKET SHARE ANALYSIS BY END USER (2024)
FIGURE 148 SOUTH KOREA MARKET SHARE ANALYSIS BY TYPE (2024)
FIGURE 149 SOUTH KOREA MARKET SHARE ANALYSIS BY END USER (2024)
FIGURE 150 SAUDI ARABIA MARKET SHARE ANALYSIS BY TYPE (2024)
FIGURE 151 SAUDI ARABIA MARKET SHARE ANALYSIS BY END USER (2024)
FIGURE 152 UAE MARKET SHARE ANALYSIS BY TYPE (2024)
FIGURE 153 UAE MARKET SHARE ANALYSIS BY END USER (2024)
FIGURE 154 EGYPT MARKET SHARE ANALYSIS BY TYPE (2024)
FIGURE 155 EGYPT MARKET SHARE ANALYSIS BY END USER (2024)
FIGURE 156 NIGERIA MARKET SHARE ANALYSIS BY TYPE (2024)
FIGURE 157 NIGERIA MARKET SHARE ANALYSIS BY END USER (2024)
FIGURE 158 SOUTH AFRICA MARKET SHARE ANALYSIS BY TYPE (2024)
FIGURE 159 SOUTH AFRICA MARKET SHARE ANALYSIS BY END USER (2024)
FIGURE 160 GERMANY MARKET SHARE ANALYSIS BY TYPE (2024)
FIGURE 161 GERMANY MARKET SHARE ANALYSIS BY END USER (2024)
FIGURE 162 FRANCE MARKET SHARE ANALYSIS BY TYPE (2024)
FIGURE 163 FRANCE MARKET SHARE ANALYSIS BY END USER (2024)
FIGURE 164 UK MARKET SHARE ANALYSIS BY TYPE (2024)
FIGURE 165 UK MARKET SHARE ANALYSIS BY END USER (2024)
FIGURE 166 SPAIN MARKET SHARE ANALYSIS BY TYPE (2024)
FIGURE 167 SPAIN MARKET SHARE ANALYSIS BY END USER (2024)
FIGURE 168 ITALY MARKET SHARE ANALYSIS BY TYPE (2024)
FIGURE 169 ITALY MARKET SHARE ANALYSIS BY END USER (2024)
FIGURE 170 BRAZIL MARKET SHARE ANALYSIS BY TYPE (2024)
FIGURE 171 BRAZIL MARKET SHARE ANALYSIS BY END USER (2024)
FIGURE 172 ARGENTINA MARKET SHARE ANALYSIS BY TYPE (2024)
FIGURE 173 ARGENTINA MARKET SHARE ANALYSIS BY END USER (2024)
FIGURE 174 COLUMBIA MARKET SHARE ANALYSIS BY TYPE (2024)
FIGURE 175 COLUMBIA MARKET SHARE ANALYSIS BY END USER (2024)
FIGURE 176 GLOBAL AI IN ULTRASOUND IMAGINGCURRENT AND FUTURE MARKET KEY COUNTRY LEVEL ANALYSIS, 2024–2034, (USD MILLION)
FIGURE 177 FINANCIAL OVERVIEW:
Key Player Analysis
Intel Corporation: Intel Corporation positions itself as a market leader and infrastructure enabler within the AI in ultrasound imaging ecosystem. The company does not compete directly as an imaging OEM. Instead, it supplies high-performance processors, edge AI accelerators, and optimized software frameworks that power AI workloads embedded in ultrasound systems. By 2025, Intel-based architectures support a significant share of AI-enabled medical imaging deployments, particularly in hospital-grade systems requiring low latency and on-device inference. Healthcare and life sciences account for an estimated mid-single-digit percentage of Intel’s data-centric revenue, translating into several billion USD annually.
Strategically, Intel continues to expand its healthcare footprint through partnerships with ultrasound OEMs, cloud providers, and AI software vendors. Ongoing investments in edge AI and confidential computing address regulatory and data security requirements in clinical environments. Its differentiator lies in hardware-software co-design, which allows ultrasound vendors to run advanced computer vision models locally while controlling power consumption and cost. Strong presence in North America and Europe further reinforces its role in large-scale hospital deployments.
EchoNous, Inc.: EchoNous, Inc. operates as an innovator and focused challenger in AI-driven ultrasound systems. The company specializes in portable and point-of-care ultrasound devices integrated with real-time AI guidance and interpretation. Its flagship platforms target emergency care, critical care, and neurology use cases, where rapid decision-making is essential. By 2025, EchoNous devices see adoption growth above 15% annually within U.S. hospitals and ambulatory care settings, supported by rising demand for compact imaging tools.
The company prioritizes proprietary AI models that guide probe positioning and automate key measurements at the bedside. Strategic initiatives include clinical validation partnerships with academic medical centers and targeted expansions into trauma and stroke assessment workflows. EchoNous differentiates through ease of use and reduced operator dependency, which appeals to facilities facing sonographer shortages. Its customer base remains concentrated in North America, with early expansion efforts underway in select Asia-Pacific markets.
General Vision, Inc.: General Vision, Inc. positions itself as a niche technology provider focused on neuromorphic computing and low-power AI processing. Within the AI in ultrasound imaging market, the company supports specialized applications that require continuous image analysis with minimal energy consumption. Its hardware and algorithmic platforms appeal to manufacturers developing portable or battery-operated ultrasound systems. By 2025, adoption remains limited in volume but shows steady growth in research-driven and specialty device programs.
The company invests heavily in R&D to refine brain-inspired processing architectures suited for real-time pattern recognition. Partnerships with academic institutions and early-stage medical device firms shape its commercialization strategy. General Vision differentiates through ultra-low power consumption and on-device learning capabilities, which reduce reliance on cloud connectivity. This positioning aligns with emerging demand for decentralized diagnostics in remote and resource-constrained environments.
By 2025, AI-enabled ultrasound imaging benefits from steady gains in algorithm performance and clinical validation. Advances in deep learning and computer vision now support automated detection, segmentation, and quantification across complex scan types. You see higher diagnostic consistency as models process high-noise images and variable acquisition angles with accuracy levels exceeding 90% in selected use cases. These capabilities shorten exam times by an estimated 20% and reduce repeat scans, which directly improves department throughput.
Aging Population Increasing Imaging Workload Demand
Demographic pressure reinforces this technology-driven demand. Global populations aged 65 and above continue to expand, increasing imaging volumes for chronic and age-related conditions. Providers face sustained workload pressure, and AI-based automation absorbs part of this burden through real-time image analysis and decision support. This context positions AI ultrasound as a productivity tool rather than an optional enhancement, supporting market growth near 9% CAGR through the next decade.
Restraint:
Elevated Total Cost of Ownership Limiting Adoption
Cost remains a limiting factor for adoption in 2025, particularly among small and mid-sized providers. AI-enabled ultrasound software licenses, validation services, and ongoing model updates raise total ownership costs by an estimated 25 to 35% compared with conventional systems. You also face added expense when relying on external service providers for deployment, training, and compliance support due to limited in-house AI expertise.
Regulatory and Cybersecurity Burdens Slowing Deployment
These financial constraints slow penetration outside large hospital networks. Clinics and regional hospitals often delay investment despite clear clinical value. Regulatory compliance and cybersecurity requirements further add to operating costs. Together, these factors temper short-term adoption rates and widen the gap between advanced and resource-limited care settings.
Opportunity:
Expanding Clinical Applications in Obstetrics and Oncology
Clinical accuracy gains create a strong expansion path, particularly in obstetrics, neurology, and early cancer screening. AI-assisted ultrasound detects fetal anomalies and maternal complications earlier, supporting continuous monitoring and timely intervention. You gain value from longitudinal tracking tools that support personalized care and reduce adverse outcomes. Adoption in obstetrics alone is projected to grow above 10% CAGR through 2034.
AI-Driven Error Reduction and Decision Support Expansion
AI also reduces diagnostic oversight risk by flagging subtle abnormalities that human review may miss under time pressure. Decision support systems guide radiologists toward targeted assessment, lowering error rates and improving confidence in complex cases. These benefits strengthen the business case for enterprise-wide deployment and open recurring revenue opportunities for vendors.
Trend:
Tele-Ultrasound and Remote Interpretation Growth
Remote interpretation and tele-ultrasound expand rapidly as healthcare systems decentralize care delivery. By 2025, AI-assisted remote imaging supports rural and underserved regions where specialist access remains limited. You can transmit scans securely for centralized analysis, improving turnaround time and extending specialist reach without physical relocation.
Embedded AI Integration Within Imaging Platforms
At the same time, manufacturers increasingly embed AI directly into ultrasound platforms. Real-time analysis at the point of scan reduces dependence on post-processing and supports faster clinical decisions. This integration trend reshapes procurement priorities, favoring systems that combine imaging hardware with embedded intelligence and cloud connectivity.
Recent Developments
Dec 2024 – GE HealthCare: GE HealthCare launched an upgraded AI-enabled ultrasound software suite integrating real-time automated measurements and decision support across radiology and obstetrics workflows. The update rolled out to over 18,000 installed systems globally and is expected to lift ultrasound software-related revenue by approximately 6% in 2025. This move strengthens GE HealthCare’s installed-base monetization strategy and reinforces its leadership in AI-assisted imaging.
Feb 2025 – Siemens Healthineers: Siemens Healthineers announced a strategic partnership with a U.S.-based cloud AI provider to embed advanced deep learning models into its Acuson ultrasound portfolio. The collaboration targets enterprise hospital networks and aims to support over 30% of new ultrasound shipments in North America by year-end 2025. This partnership accelerates AI deployment at scale and improves Siemens’ competitiveness in data-driven imaging environments.
Apr 2025 – Philips Healthcare: Philips expanded its AI ultrasound platform into selected Asia-Pacific markets, including India and Southeast Asia, through regional manufacturing and distribution agreements valued at over USD 120 million. The expansion focuses on maternal health and cardiovascular screening applications. This development broadens Philips’ geographic footprint and captures demand in high-growth, cost-sensitive markets.
Jul 2025 – Samsung Medison: Samsung Medison introduced an AI-guided portable ultrasound system designed for point-of-care and emergency settings. Early pilot deployments across 150 hospitals in Europe showed scan time reductions of nearly 22%. This product launch positions Samsung Medison strongly in the portable ultrasound segment and supports adoption beyond traditional radiology departments.
Sep 2025 – Canon Medical Systems: Canon Medical Systems acquired a minority stake in a European AI imaging software firm for an estimated USD 85 million to accelerate algorithm development for oncology and neurology ultrasound use cases. The investment supports joint R&D and co-commercialization planned for 2026. This strategic move enhances Canon’s AI pipeline and strengthens differentiation in advanced clinical applications.