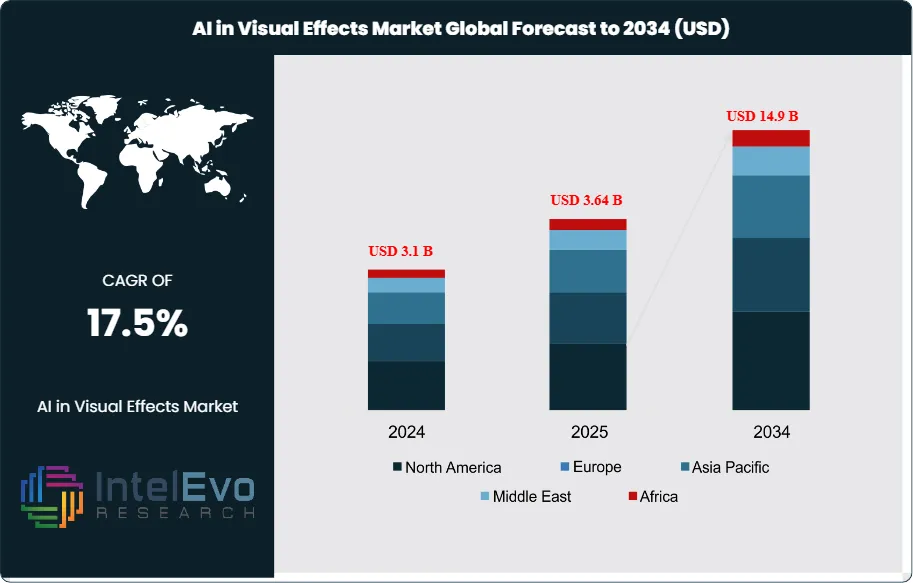
The AI in Visual Effects (VFX) Market is valued at USD 3.1 billion in 2024 and is projected to reach approximately USD 14.9 billion by 2034, expanding at a robust CAGR of about 17.5% from 2025–2034. Growth is accelerating as studios, OTT platforms, and gaming publishers adopt AI-driven pipelines for animation, compositing, motion capture, and digital doubling. With generative AI slashing rendering time by 40–60% and reducing VFX production costs by up to 25%, creators are pushing for faster content cycles and higher photorealism. The rise of virtual production, real-time engines, and AI-enhanced CGI is amplifying visibility across entertainment, advertising, and social media platforms.
This rapid expansion reflects both cyclical content demand and structural adoption of AI across the VFX pipeline. From a small but pivotal base—about 11% of the broader VFX spend in 2023 (the global VFX market was ~USD 15 billion and is projected to reach ~USD 40 billion by 2033 at a 10.7% CAGR)—AI-enabled tools are compressing timelines, elevating photorealism, and lowering unit costs per shot, thereby expanding the addressable project set for studios of all sizes.
Market dynamics are increasingly favorable. On the demand side, streaming platforms continue to prioritize VFX-heavy originals, while game studios, including mobile, seek more immersive, cinematic experiences. On the supply side, persistent labor constraints and cost inflation are catalyzing automation in rotoscoping, matchmoving, cleanup, denoising, and upscaling, with real-time rendering letting artists iterate “in the shot” and cut days from review cycles. AI’s impact on throughput and consistency is material: studios report faster asset turnover and fewer iteration loops, supporting both higher asset reuse and improved asset libraries. Key challenges remain—GPU availability and cloud costs, data licensing and IP provenance, and evolving labor agreements around AI-assisted workflows—but risk is increasingly manageable via hybrid compute strategies, secure data pipelines, and transparent tool governance.
Technology is the primary unlock. Neural Radiance Fields (NeRFs) and related novel-view-synthesis techniques accelerate environment capture and digital doubles with fewer plates; diffusion models streamline concepting, matte painting, and look-dev; physics-informed AI improves simulation fidelity for fluids, fire, and crowds; and ML-driven quality control flags continuity issues earlier in dailies. Toolchains are converging around real-time engines integrated with AI-assisted asset creation, enabling virtual production and previs to flow directly into final pixel.
Regionally, North America led in 2023 with a 38% share (≈USD 0.6 billion), underpinned by large studio pipelines and robust post-production ecosystems. Europe remains competitive, supported by tax incentives and mature vendor networks, while Asia–Pacific is the fastest-emerging hotspot, with expanding capabilities in India, China, and Korea. Investment attention should focus on cloud-native VFX platforms, AI-enabled asset management, and real-time pipeline integrations—areas most likely to capture outsized value as adoption scales through 2034.
Key Takeaways
Market Growth: The AI in Visual Effects (VFX) market stands at USD 3.1 billion in 2024 and is projected to reach USD 14.9 billion by 2034, a ~6x scale-up at a 17.5% CAGR, propelled by streaming-led content volume, real-time rendering, and automation across the post-production pipeline.
Offering: Services captured 56.1% of 2023 revenue as studios outsourced AI-assisted rotoscoping, cleanup, denoising, and upscaling to specialist vendors, accelerating turnaround and shifting spend from capex to opex.
Technology: Machine learning & deep learning techniques accounted for ~75.2% of revenue in 2023, reflecting fast adoption of diffusion models, NeRF-based environment capture, and ML-driven QC that improve photorealism while compressing iteration cycles.
Driver: Streaming platforms and premium episodic TV are intensifying VFX requirements; with the broader VFX market at ~USD 15 billion in 2023 (projected USD 40 billion by 2033, 10.7% CAGR), AI’s role expands as studios seek lower cost per shot and faster time-to-final pixel.
Restraint: Adoption remains early-stage—AI spend represented ~11% of total VFX outlays in 2023 (USD 1.6B of a USD 15B market)—with scale limited by GPU/cloud costs, data/IP provenance hurdles, and workflow retraining.
Opportunity: Rising AI attach rates to the broader VFX market (from ~11% in 2023 to ~24% implied by USD 9.6B on a USD 40B VFX market by 2033) create a net new USD ~8.0B revenue pool, with outsized upside in cloud-native pipelines, AI asset management, and real-time engine integrations.
Trend: Convergence of virtual production and AI—NeRFs for rapid scene reconstruction, diffusion-assisted look-dev/matte painting, and ML physics for fluids/fire/crowds—is moving previs assets closer to final pixel, reducing rework and enabling scalable, shot-level automation.
Regional Analysis: North America led with ~38% share in 2023 (≈USD 0.6B), supported by large studio pipelines and mature post ecosystems; Europe sustains competitiveness via incentives and vendor density, while Asia-Pacific is the fastest-emerging hotspot (India/China/Korea) and is expected to outpace the global CAGR as capacity and talent pools expand.
Component Analysis
The services layer remains the economic center of AI-driven VFX in 2025, accounting for an estimated ~55% of category revenue (vs. 56.1% in 2023) as studios lean on managed pipelines, show-specific model tuning, and MLOps/QA services to operationalize AI at scale. Engagements span roto/cleanup automation, denoise/upscale passes, and real-time look-dev, with leading vendors integrating directly into DCC and game-engine workflows to compress review cycles by 20–30%. Software is the fastest-expanding component, propelled by diffusion/NeRF toolsets, AI asset managers, and QC/continuity analytics; recurring licenses and usage-based pricing are shifting budgets from capex to opex. Hardware spend is increasingly cloud-centric as GPU scarcity and bursty render needs push productions to AWS/Azure/GCP and specialized render farms; hybrid strategies lower up-front capex while preserving on-prem control for sensitive assets.
Looking ahead, software is set to take incremental share through 2030 as model-assisted authoring and automated compositing mature, while services scale by packaging “shots-as-a-service” for mid-tier shows and regional studios. Hardware outlays grow in line with content volume, but unit costs per shot decline as model efficiency and inference-time optimizations improve.
Technology Analysis
AI remains the core technology, representing ~77% of 2025 spend (75.2% in 2023) and underpinning the end-to-end pipeline—from concept and previs to simulation, compositing, and final pixel. Diffusion models, NeRF-based environment capture, and ML physics shorten iteration loops and raise photorealism; studios report double-digit cuts in shot turnaround and fewer QC notes per sequence. Toolchains now combine model-assisted layout/matte painting with automated matchmove and object tracking, elevating both throughput and consistency.
AR’s role is expanding in on-set visualization, virtual production, and marketing assets, where AI-enhanced overlays improve blocking, lighting decisions, and client approvals. While a smaller base, AR is projected to outpace overall market growth through 2030 as broadcasters, advertisers, and live events adopt real-time, AI-assisted graphics.
Product Analysis
Animation is the largest product bucket in 2025, contributing an estimated ~28–30% of revenue as AI accelerates character/creature workflows, lip-sync, and crowd replication for streaming series and stylized features. Compositing remains foundational at ~20–22%, with ML-assisted keying, grain management, and continuity checks reducing manual passes and rework. Modelling benefits from generative base-mesh creation and topology suggestions, moving toward ~12–14% share as asset libraries scale.
Simulation FX (fluids, fire, destruction, cloth) is the fastest grower, supported by physics-informed networks and learned solvers that cut sim times materially; adoption is strongest in action/fantasy sequences and AAA game cinematics. Matte painting modernizes via diffusion-guided environment builds and control-net workflows, while “Others” (including QC analytics and pipeline orchestration) grows as studios formalize data/telemetry layers.
Application Analysis
Television/streaming remains the top application in 2025 with ~38–40% share, reflecting high series throughput and tighter delivery cadences where AI reduces cost per episode. Feature films account for ~27–29%, emphasizing large-format spectacle with heavier Simulation FX and complex compositing. Gaming comprises ~22–24% and is the fastest-growing use case as real-time engines integrate AI for cinematic pipelines, in-engine cutscenes, and promotional assets; mobile and cross-platform launches amplify demand.
Advertisements (~8–10%) adopt AI VFX for rapid, multi-variant creative and localized assets, while “Others” (OTT promos, episodic marketing, immersive installations) captures niche but rising spend as brands pursue real-time, personalized visuals.
Regional Analysis
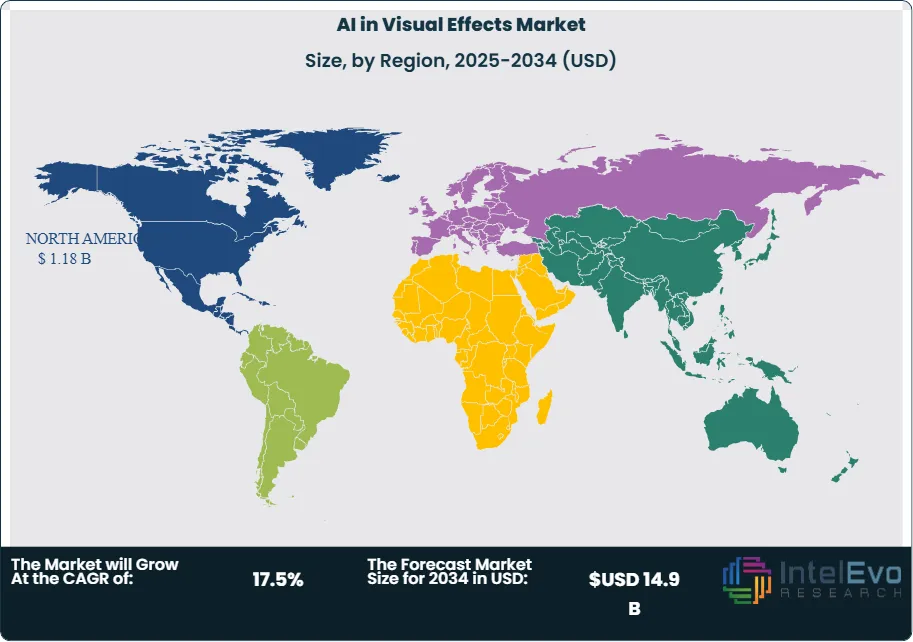
North America remains the largest regional market in 2025 with an estimated 36–38% share (≈USD 0.85 billion on a ~USD 2.29 billion global market), supported by studio pipelines, tax incentives, and close ties to hyperscale cloud/GPU providers. Europe holds ~25–27% on the back of strong vendor ecosystems in the UK, Germany, France, and Spain, with steady adoption of virtual production stages and incentive-driven post-work.
Asia Pacific is the fastest-advancing region at an expected growth rate above the global CAGR through 2030, reaching ~30–32% share by mid-decade as India expands service capacity, China invests in premium episodic and theatrical content, and Korea/Japan drive high-end animation and games. Latin America and the Middle East & Africa together contribute ~6% but are emerging outsourcing and virtual-production hubs as fiber connectivity and incentives improve, creating cost-competitive alternatives for select sequences.
Customization for segments, region/country-level will be provided. Moreover, additional customization can be done based on the requirements.
Pricing and Purchase Options
Avail customized purchase options to meet your exact research needs. We have three licenses to opt for: Single User License, Multi-User License (Up to 5 Users), Corporate Use License (Unlimited User and Printable PDF).
TABLE OF CONTENTS
1. EXECUTIVE SUMMARY
1.1. MARKET SNAPSHOT
1.2. KEY FINDINGS & INSIGHTS
1.3. ANALYST RECOMMENDATIONS
1.4. FUTURE OUTLOOK
2. RESEARCH METHODOLOGY
2.1. MARKET DEFINITION & SCOPE
2.2. RESEARCH OBJECTIVES: PRIMARY & SECONDARY DATA SOURCES
2.3. DATA COLLECTION SOURCES
2.3.1. COVERAGE OF 100+ PRIMARY RESEARCH/CONSULTATION CALLS WITH INDUSTRY STAKEHOLDERS
FIGURE 17 NORTH AMERICA AI IN VISUAL EFFECTS CURRENT AND FUTURE TYPE ANALYSIS, 2025–2034, (USD MILLION)
FIGURE 18 NORTH AMERICA AI IN VISUAL EFFECTS CURRENT AND FUTURE END USER ANALYSIS, 2025–2034, (USD MILLION)
FIGURE 19 MARKET SHARE BY COUNTRY
FIGURE 20 LATIN AMERICA AI IN VISUAL EFFECTS CURRENT AND FUTURE TYPE ANALYSIS, 2025–2034, (USD MILLION)
FIGURE 21 LATIN AMERICA AI IN VISUAL EFFECTS CURRENT AND FUTURE END USER ANALYSIS, 2025–2034, (USD MILLION)
FIGURE 22 MARKET SHARE BY COUNTRY
FIGURE 23 EASTERN EUROPE AI IN VISUAL EFFECTS CURRENT AND FUTURE TYPE ANALYSIS, 2025–2034, (USD MILLION)
FIGURE 24 EASTERN EUROPE AI IN VISUAL EFFECTS CURRENT AND FUTURE END USER ANALYSIS, 2025–2034, (USD MILLION)
FIGURE 25 MARKET SHARE BY COUNTRY
FIGURE 26 WESTERN EUROPE AI IN VISUAL EFFECTS CURRENT AND FUTURE TYPE ANALYSIS, 2025–2034, (USD MILLION)
FIGURE 27 WESTERN EUROPE AI IN VISUAL EFFECTS CURRENT AND FUTURE END USER ANALYSIS, 2025–2034, (USD MILLION)
FIGURE 28 MARKET SHARE BY COUNTRY
FIGURE 29 EAST ASIA AND PACIFIC AI IN VISUAL EFFECTS CURRENT AND FUTURE TYPE ANALYSIS, 2025–2034, (USD MILLION)
FIGURE 30 EAST ASIA AND PACIFIC AI IN VISUAL EFFECTS CURRENT AND FUTURE END USER ANALYSIS, 2025–2034, (USD MILLION)
FIGURE 31 MARKET SHARE BY COUNTRY
FIGURE 32 SEA AND SOUTH ASIA AI IN VISUAL EFFECTS CURRENT AND FUTURE TYPE ANALYSIS, 2025–2034, (USD MILLION)
FIGURE 33 SEA AND SOUTH ASIA AI IN VISUAL EFFECTS CURRENT AND FUTURE END USER ANALYSIS, 2025–2034, (USD MILLION)
FIGURE 34 MARKET SHARE BY COUNTRY
FIGURE 35 MIDDLE EAST AND AFRICA AI IN VISUAL EFFECTS CURRENT AND FUTURE TYPE ANALYSIS, 2025–2034, (USD MILLION)
FIGURE 36 MIDDLE EAST AND AFRICA AI IN VISUAL EFFECTS CURRENT AND FUTURE END USER ANALYSIS, 2025–2034, (USD MILLION)
FIGURE 37 NORTH AMERICA AI IN VISUAL EFFECTS CURRENT AND FUTURE MARKET VOLUME SHARE REGIONAL ANALYSIS, 2025–2034, (USD MILLION)
FIGURE 38 U.S. AI IN VISUAL EFFECTS CURRENT AND FUTURE TYPE ANALYSIS, 2025–2034, (USD MILLION)
FIGURE 39 U.S. AI IN VISUAL EFFECTS CURRENT AND FUTURE END USER ANALYSIS, 2025–2034, (USD MILLION)
FIGURE 40 CANADA AI IN VISUAL EFFECTS CURRENT AND FUTURE TYPE ANALYSIS, 2025–2034, (USD MILLION)
FIGURE 41 CANADA AI IN VISUAL EFFECTS CURRENT AND FUTURE END USER ANALYSIS, 2025–2034, (USD MILLION)
FIGURE 42 LATIN AMERICA AI IN VISUAL EFFECTS CURRENT AND FUTURE MARKET VOLUME SHARE REGIONAL ANALYSIS, 2025–2034, (USD MILLION)
FIGURE 43 MEXICO AI IN VISUAL EFFECTS CURRENT AND FUTURE TYPE ANALYSIS, 2025–2034, (USD MILLION)
FIGURE 44 MEXICO AI IN VISUAL EFFECTS CURRENT AND FUTURE END USER ANALYSIS, 2025–2034, (USD MILLION)
FIGURE 45 BRAZIL AI IN VISUAL EFFECTS CURRENT AND FUTURE TYPE ANALYSIS, 2025–2034, (USD MILLION)
FIGURE 46 BRAZIL AI IN VISUAL EFFECTS CURRENT AND FUTURE END USER ANALYSIS, 2025–2034, (USD MILLION)
FIGURE 47 ARGENTINA AI IN VISUAL EFFECTS CURRENT AND FUTURE TYPE ANALYSIS, 2025–2034, (USD MILLION)
FIGURE 48 ARGENTINA AI IN VISUAL EFFECTS CURRENT AND FUTURE END USER ANALYSIS, 2025–2034, (USD MILLION)
FIGURE 49 COLUMBIA AI IN VISUAL EFFECTS CURRENT AND FUTURE TYPE ANALYSIS, 2025–2034, (USD MILLION)
FIGURE 50 COLUMBIA AI IN VISUAL EFFECTS CURRENT AND FUTURE END USER ANALYSIS, 2025–2034, (USD MILLION)
FIGURE 51 REST OF LATIN AMERICA AI IN VISUAL EFFECTS CURRENT AND FUTURE TYPE ANALYSIS, 2025–2034, (USD MILLION)
FIGURE 52 REST OF LATIN AMERICA AI IN VISUAL EFFECTS CURRENT AND FUTURE END USER ANALYSIS, 2025–2034, (USD MILLION)
FIGURE 53 EASTERN EUROPE AI IN VISUAL EFFECTS CURRENT AND FUTURE MARKET VOLUME SHARE REGIONAL ANALYSIS, 2025–2034, (USD MILLION)
FIGURE 54 POLAND AI IN VISUAL EFFECTS CURRENT AND FUTURE TYPE ANALYSIS, 2025–2034, (USD MILLION)
FIGURE 55 POLAND AI IN VISUAL EFFECTS CURRENT AND FUTURE END USER ANALYSIS, 2025–2034, (USD MILLION)
FIGURE 56 RUSSIA AI IN VISUAL EFFECTS CURRENT AND FUTURE TYPE ANALYSIS, 2025–2034, (USD MILLION)
FIGURE 57 RUSSIA AI IN VISUAL EFFECTS CURRENT AND FUTURE END USER ANALYSIS, 2025–2034, (USD MILLION)
FIGURE 58 CZECH REPUBLIC AI IN VISUAL EFFECTS CURRENT AND FUTURE TYPE ANALYSIS, 2025–2034, (USD MILLION)
FIGURE 59 CZECH REPUBLIC AI IN VISUAL EFFECTS CURRENT AND FUTURE END USER ANALYSIS, 2025–2034, (USD MILLION)
FIGURE 60 ROMANIA AI IN VISUAL EFFECTS CURRENT AND FUTURE TYPE ANALYSIS, 2025–2034, (USD MILLION)
FIGURE 61 ROMANIA AI IN VISUAL EFFECTS CURRENT AND FUTURE END USER ANALYSIS, 2025–2034, (USD MILLION)
FIGURE 62 REST OF EASTERN EUROPE AI IN VISUAL EFFECTS CURRENT AND FUTURE TYPE ANALYSIS, 2025–2034, (USD MILLION)
FIGURE 63 REST OF EASTERN EUROPE AI IN VISUAL EFFECTS CURRENT AND FUTURE END USER ANALYSIS, 2025–2034, (USD MILLION)
FIGURE 64 WESTERN EUROPE AI IN VISUAL EFFECTS CURRENT AND FUTURE MARKET VOLUME SHARE REGIONAL ANALYSIS, 2025–2034, (USD MILLION)
FIGURE 65 GERMANY AI IN VISUAL EFFECTS CURRENT AND FUTURE TYPE ANALYSIS, 2025–2034, (USD MILLION)
FIGURE 66 GERMANY AI IN VISUAL EFFECTS CURRENT AND FUTURE END USER ANALYSIS, 2025–2034, (USD MILLION)
FIGURE 67 FRANCE AI IN VISUAL EFFECTS CURRENT AND FUTURE TYPE ANALYSIS, 2025–2034, (USD MILLION)
FIGURE 68 FRANCE AI IN VISUAL EFFECTS CURRENT AND FUTURE END USER ANALYSIS, 2025–2034, (USD MILLION)
FIGURE 69 UK AI IN VISUAL EFFECTS CURRENT AND FUTURE TYPE ANALYSIS, 2025–2034, (USD MILLION)
FIGURE 70 UK AI IN VISUAL EFFECTS CURRENT AND FUTURE END USER ANALYSIS, 2025–2034, (USD MILLION)
FIGURE 71 SPAIN AI IN VISUAL EFFECTS CURRENT AND FUTURE TYPE ANALYSIS, 2025–2034, (USD MILLION)
FIGURE 72 SPAIN AI IN VISUAL EFFECTS CURRENT AND FUTURE END USER ANALYSIS, 2025–2034, (USD MILLION)
FIGURE 73 ITALY AI IN VISUAL EFFECTS CURRENT AND FUTURE TYPE ANALYSIS, 2025–2034, (USD MILLION)
FIGURE 74 ITALY AI IN VISUAL EFFECTS CURRENT AND FUTURE END USER ANALYSIS, 2025–2034, (USD MILLION)
FIGURE 75 REST OF WESTERN EUROPE AI IN VISUAL EFFECTS CURRENT AND FUTURE TYPE ANALYSIS, 2025–2034, (USD MILLION)
FIGURE 76 REST OF WESTERN EUROPE AI IN VISUAL EFFECTS CURRENT AND FUTURE END USER ANALYSIS, 2025–2034, (USD MILLION)
FIGURE 77 EAST ASIA AND PACIFIC AI IN VISUAL EFFECTS CURRENT AND FUTURE MARKET VOLUME SHARE REGIONAL ANALYSIS, 2025–2034, (USD MILLION)
FIGURE 78 CHINA AI IN VISUAL EFFECTS CURRENT AND FUTURE TYPE ANALYSIS, 2025–2034, (USD MILLION)
FIGURE 79 CHINA AI IN VISUAL EFFECTS CURRENT AND FUTURE END USER ANALYSIS, 2025–2034, (USD MILLION)
FIGURE 80 JAPAN AI IN VISUAL EFFECTS CURRENT AND FUTURE TYPE ANALYSIS, 2025–2034, (USD MILLION)
FIGURE 81 JAPAN AI IN VISUAL EFFECTS CURRENT AND FUTURE END USER ANALYSIS, 2025–2034, (USD MILLION)
FIGURE 82 AUSTRALIA AI IN VISUAL EFFECTS CURRENT AND FUTURE TYPE ANALYSIS, 2025–2034, (USD MILLION)
FIGURE 83 AUSTRALIA AI IN VISUAL EFFECTS CURRENT AND FUTURE END USER ANALYSIS, 2025–2034, (USD MILLION)
FIGURE 84 CAMBODIA AI IN VISUAL EFFECTS CURRENT AND FUTURE TYPE ANALYSIS, 2025–2034, (USD MILLION)
FIGURE 85 CAMBODIA AI IN VISUAL EFFECTS CURRENT AND FUTURE END USER ANALYSIS, 2025–2034, (USD MILLION)
FIGURE 86 FIJI AI IN VISUAL EFFECTS CURRENT AND FUTURE TYPE ANALYSIS, 2025–2034, (USD MILLION)
FIGURE 87 FIJI AI IN VISUAL EFFECTS CURRENT AND FUTURE END USER ANALYSIS, 2025–2034, (USD MILLION)
FIGURE 88 INDONESIA AI IN VISUAL EFFECTS CURRENT AND FUTURE TYPE ANALYSIS, 2025–2034, (USD MILLION)
FIGURE 89 INDONESIA AI IN VISUAL EFFECTS CURRENT AND FUTURE END USER ANALYSIS, 2025–2034, (USD MILLION)
FIGURE 90 SOUTH KOREA AI IN VISUAL EFFECTS CURRENT AND FUTURE TYPE ANALYSIS, 2025–2034, (USD MILLION)
FIGURE 91 SOUTH KOREA AI IN VISUAL EFFECTS CURRENT AND FUTURE END USER ANALYSIS, 2025–2034, (USD MILLION)
FIGURE 92 REST OF EAST ASIA AND PACIFIC AI IN VISUAL EFFECTS CURRENT AND FUTURE TYPE ANALYSIS, 2025–2034, (USD MILLION)
FIGURE 93 REST OF EAST ASIA AND PACIFIC AI IN VISUAL EFFECTS CURRENT AND FUTURE END USER ANALYSIS, 2025–2034, (USD MILLION)
FIGURE 94 SEA AND SOUTH ASIA AI IN VISUAL EFFECTS CURRENT AND FUTURE MARKET VOLUME SHARE REGIONAL ANALYSIS, 2025–2034, (USD MILLION)
FIGURE 95 BANGLADESH AI IN VISUAL EFFECTS CURRENT AND FUTURE TYPE ANALYSIS, 2025–2034, (USD MILLION)
FIGURE 96 BANGLADESH AI IN VISUAL EFFECTS CURRENT AND FUTURE END USER ANALYSIS, 2025–2034, (USD MILLION)
FIGURE 97 NEW ZEALAND AI IN VISUAL EFFECTS CURRENT AND FUTURE TYPE ANALYSIS, 2025–2034, (USD MILLION)
FIGURE 98 NEW ZEALAND AI IN VISUAL EFFECTS CURRENT AND FUTURE END USER ANALYSIS, 2025–2034, (USD MILLION)
FIGURE 99 INDIA AI IN VISUAL EFFECTS CURRENT AND FUTURE TYPE ANALYSIS, 2025–2034, (USD MILLION)
FIGURE 100 INDIA AI IN VISUAL EFFECTS CURRENT AND FUTURE END USER ANALYSIS, 2025–2034, (USD MILLION)
FIGURE 101 SINGAPORE AI IN VISUAL EFFECTS CURRENT AND FUTURE TYPE ANALYSIS, 2025–2034, (USD MILLION)
FIGURE 102 SINGAPORE AI IN VISUAL EFFECTS CURRENT AND FUTURE END USER ANALYSIS, 2025–2034, (USD MILLION)
FIGURE 103 THAILAND AI IN VISUAL EFFECTS CURRENT AND FUTURE TYPE ANALYSIS, 2025–2034, (USD MILLION)
FIGURE 104 THAILAND AI IN VISUAL EFFECTS CURRENT AND FUTURE END USER ANALYSIS, 2025–2034, (USD MILLION)
FIGURE 105 TAIWAN AI IN VISUAL EFFECTS CURRENT AND FUTURE TYPE ANALYSIS, 2025–2034, (USD MILLION)
FIGURE 106 TAIWAN AI IN VISUAL EFFECTS CURRENT AND FUTURE END USER ANALYSIS, 2025–2034, (USD MILLION)
FIGURE 107 MALAYSIA AI IN VISUAL EFFECTS CURRENT AND FUTURE TYPE ANALYSIS, 2025–2034, (USD MILLION)
FIGURE 108 MALAYSIA AI IN VISUAL EFFECTS CURRENT AND FUTURE END USER ANALYSIS, 2025–2034, (USD MILLION)
FIGURE 109 REST OF SEA AND SOUTH ASIA AI IN VISUAL EFFECTS CURRENT AND FUTURE TYPE ANALYSIS, 2025–2034, (USD MILLION)
FIGURE 110 REST OF SEA AND SOUTH ASIA AI IN VISUAL EFFECTS CURRENT AND FUTURE END USER ANALYSIS, 2025–2034, (USD MILLION)
FIGURE 111 MIDDLE EAST AND AFRICA AI IN VISUAL EFFECTS CURRENT AND FUTURE MARKET VOLUME SHARE REGIONAL ANALYSIS, 2025–2034, (USD MILLION)
FIGURE 112 GCC COUNTRIES AI IN VISUAL EFFECTS CURRENT AND FUTURE TYPE ANALYSIS, 2025–2034, (USD MILLION)
FIGURE 113 GCC COUNTRIES AI IN VISUAL EFFECTS CURRENT AND FUTURE END USER ANALYSIS, 2025–2034, (USD MILLION)
FIGURE 114 SAUDI ARABIA AI IN VISUAL EFFECTS CURRENT AND FUTURE TYPE ANALYSIS, 2025–2034, (USD MILLION)
FIGURE 115 SAUDI ARABIA AI IN VISUAL EFFECTS CURRENT AND FUTURE END USER ANALYSIS, 2025–2034, (USD MILLION)
FIGURE 116 UAE AI IN VISUAL EFFECTS CURRENT AND FUTURE TYPE ANALYSIS, 2025–2034, (USD MILLION)
FIGURE 117 UAE AI IN VISUAL EFFECTS CURRENT AND FUTURE END USER ANALYSIS, 2025–2034, (USD MILLION)
FIGURE 118 BAHRAIN AI IN VISUAL EFFECTS CURRENT AND FUTURE TYPE ANALYSIS, 2025–2034, (USD MILLION)
FIGURE 119 BAHRAIN AI IN VISUAL EFFECTS CURRENT AND FUTURE END USER ANALYSIS, 2025–2034, (USD MILLION)
FIGURE 120 KUWAIT AI IN VISUAL EFFECTS CURRENT AND FUTURE TYPE ANALYSIS, 2025–2034, (USD MILLION)
FIGURE 121 KUWAIT AI IN VISUAL EFFECTS CURRENT AND FUTURE END USER ANALYSIS, 2025–2034, (USD MILLION)
FIGURE 122 OMAN AI IN VISUAL EFFECTS CURRENT AND FUTURE TYPE ANALYSIS, 2025–2034, (USD MILLION)
FIGURE 123 OMAN AI IN VISUAL EFFECTS CURRENT AND FUTURE END USER ANALYSIS, 2025–2034, (USD MILLION)
FIGURE 124 QATAR AI IN VISUAL EFFECTS CURRENT AND FUTURE TYPE ANALYSIS, 2025–2034, (USD MILLION)
FIGURE 125 QATAR AI IN VISUAL EFFECTS CURRENT AND FUTURE END USER ANALYSIS, 2025–2034, (USD MILLION)
FIGURE 126 EGYPT AI IN VISUAL EFFECTS CURRENT AND FUTURE TYPE ANALYSIS, 2025–2034, (USD MILLION)
FIGURE 127 EGYPT AI IN VISUAL EFFECTS CURRENT AND FUTURE END USER ANALYSIS, 2025–2034, (USD MILLION)
FIGURE 128 NIGERIA AI IN VISUAL EFFECTS CURRENT AND FUTURE TYPE ANALYSIS, 2025–2034, (USD MILLION)
FIGURE 129 NIGERIA AI IN VISUAL EFFECTS CURRENT AND FUTURE END USER ANALYSIS, 2025–2034, (USD MILLION)
FIGURE 130 SOUTH AFRICA AI IN VISUAL EFFECTS CURRENT AND FUTURE TYPE ANALYSIS, 2025–2034, (USD MILLION)
FIGURE 131 SOUTH AFRICA AI IN VISUAL EFFECTS CURRENT AND FUTURE END USER ANALYSIS, 2025–2034, (USD MILLION)
FIGURE 132 ISRAEL AI IN VISUAL EFFECTS CURRENT AND FUTURE TYPE ANALYSIS, 2025–2034, (USD MILLION)
FIGURE 133 ISRAEL AI IN VISUAL EFFECTS CURRENT AND FUTURE END USER ANALYSIS, 2025–2034, (USD MILLION)
FIGURE 134 REST OF MEA AI IN VISUAL EFFECTS CURRENT AND FUTURE TYPE ANALYSIS, 2025–2034, (USD MILLION)
FIGURE 135 REST OF MEA AI IN VISUAL EFFECTS CURRENT AND FUTURE END USER ANALYSIS, 2025–2034, (USD MILLION)
FIGURE 136 U. S. MARKET SHARE ANALYSIS BY TYPE (2024)
FIGURE 137 U. S. MARKET SHARE ANALYSIS BY END USER (2024)
FIGURE 138 CANADA MARKET SHARE ANALYSIS BY TYPE (2024)
FIGURE 139 CANADA MARKET SHARE ANALYSIS BY END USER (2024)
FIGURE 140 MEXICO MARKET SHARE ANALYSIS BY TYPE (2024)
FIGURE 141 MEXICO MARKET SHARE ANALYSIS BY END USER (2024)
FIGURE 142 CHINA MARKET SHARE ANALYSIS BY TYPE (2024)
FIGURE 143 CHINA MARKET SHARE ANALYSIS BY END USER (2024)
FIGURE 144 JAPAN MARKET SHARE ANALYSIS BY TYPE (2024)
FIGURE 145 JAPAN MARKET SHARE ANALYSIS BY END USER (2024)
FIGURE 146 INDIA MARKET SHARE ANALYSIS BY TYPE (2024)
FIGURE 147 INDIA MARKET SHARE ANALYSIS BY END USER (2024)
FIGURE 148 SOUTH KOREA MARKET SHARE ANALYSIS BY TYPE (2024)
FIGURE 149 SOUTH KOREA MARKET SHARE ANALYSIS BY END USER (2024)
FIGURE 150 SAUDI ARABIA MARKET SHARE ANALYSIS BY TYPE (2024)
FIGURE 151 SAUDI ARABIA MARKET SHARE ANALYSIS BY END USER (2024)
FIGURE 152 UAE MARKET SHARE ANALYSIS BY TYPE (2024)
FIGURE 153 UAE MARKET SHARE ANALYSIS BY END USER (2024)
FIGURE 154 EGYPT MARKET SHARE ANALYSIS BY TYPE (2024)
FIGURE 155 EGYPT MARKET SHARE ANALYSIS BY END USER (2024)
FIGURE 156 NIGERIA MARKET SHARE ANALYSIS BY TYPE (2024)
FIGURE 157 NIGERIA MARKET SHARE ANALYSIS BY END USER (2024)
FIGURE 158 SOUTH AFRICA MARKET SHARE ANALYSIS BY TYPE (2024)
FIGURE 159 SOUTH AFRICA MARKET SHARE ANALYSIS BY END USER (2024)
FIGURE 160 GERMANY MARKET SHARE ANALYSIS BY TYPE (2024)
FIGURE 161 GERMANY MARKET SHARE ANALYSIS BY END USER (2024)
FIGURE 162 FRANCE MARKET SHARE ANALYSIS BY TYPE (2024)
FIGURE 163 FRANCE MARKET SHARE ANALYSIS BY END USER (2024)
FIGURE 164 UK MARKET SHARE ANALYSIS BY TYPE (2024)
FIGURE 165 UK MARKET SHARE ANALYSIS BY END USER (2024)
FIGURE 166 SPAIN MARKET SHARE ANALYSIS BY TYPE (2024)
FIGURE 167 SPAIN MARKET SHARE ANALYSIS BY END USER (2024)
FIGURE 168 ITALY MARKET SHARE ANALYSIS BY TYPE (2024)
FIGURE 169 ITALY MARKET SHARE ANALYSIS BY END USER (2024)
FIGURE 170 BRAZIL MARKET SHARE ANALYSIS BY TYPE (2024)
FIGURE 171 BRAZIL MARKET SHARE ANALYSIS BY END USER (2024)
FIGURE 172 ARGENTINA MARKET SHARE ANALYSIS BY TYPE (2024)
FIGURE 173 ARGENTINA MARKET SHARE ANALYSIS BY END USER (2024)
FIGURE 174 COLUMBIA MARKET SHARE ANALYSIS BY TYPE (2024)
FIGURE 175 COLUMBIA MARKET SHARE ANALYSIS BY END USER (2024)
FIGURE 176 GLOBAL AI IN VISUAL EFFECTS CURRENT AND FUTURE MARKET KEY COUNTRY LEVEL ANALYSIS, 2024–2034, (USD MILLION)
FIGURE 177 FINANCIAL OVERVIEW:
Key Player Analysis
Framestore: Leader. A top-tier, end-to-end player spanning film, episodic, advertising, and immersive, Framestore operates at global scale with ~3,000 staff across London, North America, and APAC—an asset footprint that underpins large, multi-show deliveries and fast AI adoption. Since acquiring Company 3/Method, the group (FC3) integrates color, finishing, and VFX, yielding tighter handoffs and data continuity from dailies to final pixel. Recent leadership moves—appointing a Group CTO—and public-facing work on AI/deepfake and real-time/virtual production signal sustained R&D around model-assisted workflows and engine-led pipelines. Strategically, the FC3 model positions Framestore to bundle AI-enabled QC, look-dev, and finishing as a single commercial envelope, improving margin capture on high-complexity shows.
Animal Logic: Innovator (now captive within Netflix Animation). Following Netflix’s acquisition and 2024 integration, Animal Logic is being aligned with the streamer’s feature-animation slate across Sydney, Vancouver, and Los Angeles—creating a captive pipeline with direct access to platform demand signals and compute. The integration objective is clear: raise throughput and standardize stylized CG pipelines while layering in AI-assisted layout, rigging, and rendering at scale. The move gives Netflix a structurally advantaged cost-of-content engine in family/animation while preserving Animal Logic’s creative identity; management has publicly referenced unified teams and ongoing slate expansion in 2024–2025. For the broader AI-in-VFX market, this is a proof point for vertically integrated, AI-forward studio models that compress iteration cycles and de-risk delivery.
Loom AI (Roblox): Disruptor. Loom.ai’s ML-based facial animation—acquired by Roblox—now powers expressive, real-time avatars on a platform with 111.8 million daily active users in Q2-2025 and 27.4 billion quarterly hours engaged. At this scale, small model improvements propagate instantly across hundreds of millions of sessions, advancing state-of-the-art real-time performance capture, lipsync, and emotion mapping on commodity devices. For VFX, Loom’s tech is a bridge between interactive and cinematic: pre-vis, virtual production, and marketing assets can be prototyped with live audience feedback, while creators test character performance at platform scale before investing in high-end offline shots. Expect partnerships around engine interoperability and performance capture tools as Roblox expands into advertising and branded experiences.
Rodeo FX: Challenger/expansionary integrator. The March 2025 acquisition of Mikros Animation (Paris/Montreal) materially broadens Rodeo’s addressable market into feature/episodic animation and strengthens continental Europe capacity alongside its Montreal HQ and studios in Quebec City, Toronto, Los Angeles, Vancouver, and Paris. Coupled with active participation in Unreal Fest/SIGGRAPH and increased investment in real-time toolchains, Rodeo is positioning to fuse AI-assisted simulation/compositing with animation production, targeting faster shot economics for premium episodic and campaign work. The Mikros deal also transfers equipment and operations continuity amid Technicolor’s restructuring, giving Rodeo a countercyclical growth lever and a deeper bench for AI-enabled crowd, environment, and stylized features.
Market Key Players
Pixomondo
Framestore
Weta Digital
Rodeo FX
Adobe
Loom AI
Animal Logic
Industrial Light and Magic
Others
Driver:
AI Scales VFX Pipelines as Content Demand Surges
As of 2025, content pipelines are scaling faster than headcount, pushing studios to operationalize AI across the VFX stack. Streaming-first commissioning, premium episodic television, and game-cinematic crossovers are expanding shot counts and asset complexity, making automation a necessity rather than a luxury. AI-enabled rotoscoping, tracking, denoise/upscale, and real-time look-dev routinely cut iteration cycles by 20–30% and reduce cost per shot by 10–20%, unlocking higher throughput at fixed budgets. With the AI in VFX market estimated at ~USD 2.3 billion in 2025 and tracking toward ~USD 5.6 billion by 2030 (~19–20% CAGR), adoption is reinforced by ecosystem leaders—NVIDIA (accelerated compute), Adobe and Autodesk (gen-AI authoring), Epic/Unreal (virtual production), and major streamers demanding consistent, cinematic quality at series cadence.
Restraint:
Compute Costs, Talent Gaps & IP Risks Slow AI Adoption
Rising compute intensity and data governance requirements are elevating the true cost of AI-assisted VFX. Cloud GPUs, storage, and egress fees can add 10–25% to shot economics, particularly for mid-tier houses that burst to cloud for finals. Talent scarcity persists in MLOps, data engineering, and real-time engine integration, stretching delivery schedules. In parallel, unresolved IP provenance and licensing questions around training data increase legal review cycles and insurance costs. These frictions cap adoption rates—AI’s share of total VFX spend remains in the mid-teens (~15% in 2025)—and favor well-capitalized vendors that can amortize infrastructure, compliance, and training across multiple shows.
Opportunity:
Modular AI Services Expand VFX Into High-Growth Adjacencies
The next leg of growth lies in productizing AI capabilities as modular services and extending use cases beyond filmed entertainment. “Shots-as-a-service,” AI-assisted asset libraries, and QC analytics create recurring revenue streams for vendors, while broadcasters, advertisers, and live events deploy real-time, AI-augmented graphics for personalization at scale. Cross-industry spillover is material: automotive and architecture are adopting NeRF/diffusion workflows for interactive configurators and digital twins, and healthcare/education are piloting AI-accelerated visualization. Taken together, these adjacencies could add USD 2–3 billion in incremental addressable market by 2030, with high-growth niches—simulation FX for ads, in-engine cinematics for games, and virtual production for sports—outpacing the headline market by 5–7 percentage points.
Trend:
Foundational Models & Virtual Production Redefine VFX Workflows
Foundational models fine-tuned on studio-safe datasets are converging with virtual production, moving assets from previs to final pixel with fewer handoffs. NeRF-based scene reconstruction, diffusion-guided matte painting and look-dev, and physics-informed networks for fluids/fire/crowds are shifting labor from manual frames to model supervision. By 2025, over half of top-tier shows use real-time engines for on-set visualization, with AI-assisted lighting and blocking shortening reshoot risk. Pipeline telemetry and AI-driven QC are emerging as standard, cutting continuity/QC notes by double digits and enabling data-backed vendor SLAs. Strategically, this trend rewards studios that invest in proprietary datasets, model governance, and hybrid compute—establishing defensible speed-to-final and higher asset reuse across franchises.
Recent Developments
Dec 2024 – Foundry: Released Nuke/Hiero 15.1v5 (Dec 19), a stability and workflow update that readies pipelines for 2025 show deliveries and ongoing USD-centric compositing. The maintenance release strengthens production reliability for large, multi-shot shows ahead of more substantive AI-assisted features.
Feb 2025 – Foundry: Introduced Nuke 15.2v1 with a native Multishot compositing workflow (Feb 27), enabling variable-driven, cross-shot edits within a single project. Early facility feedback indicates the shift can trim review cycles and context switching, improving shot throughput and asset reuse across sequences.
Mar 2025 – Rodeo FX: Acquired Mikros Animation from Technicolor Group (Mar 27), adding Paris and Montreal animation capacity; terms undisclosed. The deal broadens Rodeo’s addressable market into feature/episodic animation and deepens its talent bench for AI-accelerated crowd, environment, and stylized work.
Apr 2025 – Adobe: Made Generative Extend generally available in Premiere Pro (v25.2), enabling up to ~2 seconds of video and ~10 seconds of ambient audio extension, alongside AI Search and caption translation in 27 languages; After Effects 25.2 added HDR monitoring and a high-performance preview engine. The rollout operationalizes Firefly-powered edits at 4K, compressing editorial/VFX turnover for promo and episodic pipelines.
Jul 2025 – Phantom Digital Effects: Announced an agreement to acquire UK VFX houses Milk VFX and Lola Post (Jul 30–31); valuation undisclosed. The move expands Phantom’s European footprint and consolidates premium episodic capacity, positioning the group to compete for streamer-backed series with AI-assisted finishing and real-time workflows.
Sep 2025 – AWS: Expanded Deadline Cloud availability to additional regions, including Asia Pacific (Seoul) and Europe (London), bringing the service to 10 regions globally (Sep 12). Broader geographic coverage reduces egress/latency for burst rendering and ML-enhanced VFX pipelines, improving cost-to-final-pixel economics for distributed studios.