AI in Waste Management Market Size 2024–2034 | Growth & 30.8% CAGR
Global AI in Waste Management Market Size, Share & Analysis By Technology (Machine Learning, Computer Vision, Robotics), By Application (Waste Sorting, Recycling Optimization, Smart Collection, Landfill Monitoring), By End-User (Municipalities, Industrial, Commercial) Industry Regions & Key Players – Sustainability Drivers, Digital Transformation & Forecast 2025–2034
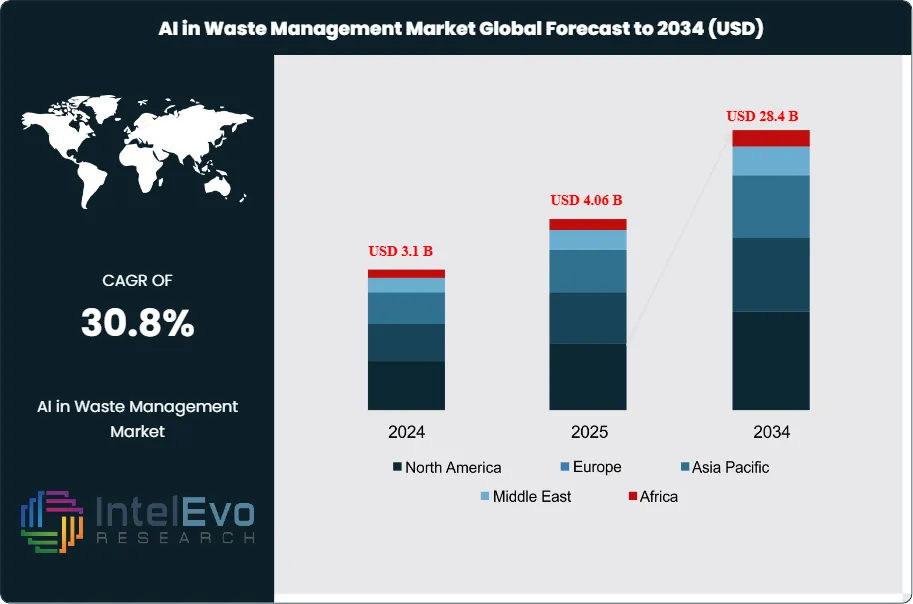
The AI in Waste Management Market is valued at approximately USD 3.1 billion in 2024 and is projected to reach nearly USD 28.4 billion by 2034, reflecting a robust CAGR of about 30.8% over 2025–2034. Rapid urbanization, tightening sustainability mandates, and the global shift toward smart waste ecosystems are accelerating adoption across municipalities and enterprises. As AI-driven sorting, prediction, and automation tools become central to circular economy initiatives, the sector is emerging as one of the fastest-growing segments in the environmental technology landscape.
This acceleration reflects a broader shift as governments and enterprises seek smarter, more sustainable ways to handle the 2 billion tonnes of municipal solid waste produced annually. Over the past decade, rising landfill volumes, tightening environmental regulations, and mounting public pressure have pushed waste management systems toward digitization.
AI tools—particularly machine learning, which accounted for 44.1% of market share in 2023—are increasingly used to automate sorting, reduce contamination in recyclables, and optimize collection routes. The software segment led the market in 2023, commanding over 42.5% of revenues, supported by demand for intelligent platforms that analyze waste streams and improve recovery yields. Container management applications are also gaining momentum, with projected growth above 30%, driven by AI’s ability to adjust pickup schedules in real time and minimize fleet downtime.
However, growth remains uneven across regions. North America led in 2023 with a 36.9% share, benefiting from early infrastructure investment and strong municipal partnerships. Europe, by contrast, has made AI integral to recycling networks; more than 88% of its waste is either composted or recycled, underscoring robust policy alignment and circular economy commitments. Asia Pacific is emerging as the fastest-growing region, propelled by rapid urbanization and escalating waste volumes. India and Southeast Asia are increasingly deploying AI pilots to enhance waste traceability and reduce landfill dependency.
Despite the strong momentum, significant barriers persist. Implementation costs remain prohibitive for low-income municipalities, and classification accuracy continues to pose technical challenges—particularly when dealing with mixed or contaminated waste streams. These hurdles delay adoption and limit scalability, especially in regions lacking digital infrastructure or standardized waste segregation practices.
Still, the opportunity for transformation is substantial. Nearly 80% of global urban waste remains untreated and is often dumped in landfills, creating environmental and economic burdens. AI-enabled systems capable of identifying material composition, predicting generation patterns, and improving diversion rates have the potential to unlock significant value. Early adopters are already integrating AI with IoT and robotics to streamline operations. As regulatory pressure intensifies and digital capabilities expand, the sector is expected to shift from isolated pilot programs to widespread deployments, fundamentally reshaping global waste management dynamics.
Key Takeaways
Market Growth: The global AI in waste management market is projected to reach USD 28.4 billion by 2034, up from USD 3.1 billion in 2024, registering a CAGR of 30.8% (2025-2034). This growth is driven by rising urban waste volumes, stricter environmental policies, and increased investment in smart infrastructure.
Technology: Machine Learning led the technology segment in 2023 with a 44.1% market share. Its dominance reflects its core role in enabling automated waste recognition, predictive analytics, and adaptive learning in sorting systems.
Component: Software solutions accounted for over 42.5% of market revenue in 2023. High demand for AI-based analytics platforms and real-time waste monitoring tools continues to drive adoption among municipalities and private operators.
Application: Waste Sorting and Segregation was the top application in 2023, representing more than 38% of the market. AI’s precision in material identification significantly improves recycling rates and contamination control.
Driver: Urban centers globally dispose of nearly 80% of their waste untreated. The need to improve landfill diversion rates and operational efficiency is accelerating the deployment of AI in municipal waste systems.
Restraint: High upfront investment and limited digital infrastructure in developing regions restrict broader AI adoption. These factors raise operational risks and slow down deployment, especially outside major urban hubs.
Opportunity: Container Management is the fastest-growing application, expected to grow at over 30%. AI is increasingly being used to optimize collection routes and container fill-level tracking, reducing fleet costs and service inefficiencies.
Trend: Integration of AI with IoT is gaining traction. Smart bins, robotic sorters, and real-time tracking are now central to pilot projects in Europe and North America, where governments are pushing for AI-enabled zero-waste initiatives.
Regional Analysis: North America led in 2023 with a 36.9% revenue share due to strong municipal digitization. Asia Pacific is the fastest-growing region, driven by rapid urbanization and public sector investment in sustainable waste infrastructure.
Component Analysis
As of 2025, software continues to dominate the AI in waste management market, holding more than 42% of total industry revenue. This leadership stems from its foundational role in enabling system intelligence. AI platforms rely on software to interpret sensor data, execute sorting algorithms, and manage decision logic essential for real-time waste processing and operational planning.
Software applications are increasingly cloud-based and modular, enabling quick updates and seamless integration across varied waste management environments. These platforms process inputs from smart bins, robotic arms, and IoT networks, allowing users to automate route planning, monitor container fill levels, and predict maintenance needs. The increasing complexity of waste streams globally has made adaptable software solutions critical. As of 2025, demand is rising for machine learning-integrated platforms that improve sorting precision and recovery rates, while also reducing manual handling costs. Software’s flexibility in scaling across small municipalities and large urban centers alike ensures its ongoing centrality to the market.
Technology Analysis
Machine learning maintains its position as the leading technology in AI-powered waste management, accounting for over 44% of market share in 2025. The technology’s strength lies in its ability to recognize patterns and learn from historical data, which directly supports predictive maintenance, route optimization, and improved material recovery.
In waste operations, machine learning models identify trends in waste generation, enabling real-time adjustments to collection schedules and reducing excess mileage. This has a direct impact on reducing fuel usage and emissions. Additionally, the technology enhances optical and robotic sorting systems by enabling high-accuracy classification of mixed waste—essential for maintaining the quality of recyclables. As investment in AI tools grows, machine learning applications are expected to expand into anomaly detection, contamination identification, and adaptive logistics management. Its role in optimizing both upstream and downstream waste processing ensures the segment remains integral to the sector's evolution.
Application Analysis
Waste sorting and segregation remains the core application within AI in waste management, capturing more than 38% of total market value in 2025. This dominance reflects the critical role accurate sorting plays in recycling and landfill reduction strategies. With landfill capacity tightening in urban centers, automated systems capable of high-throughput sorting have become essential.
AI-driven systems now use computer vision alongside machine learning to sort materials like plastics, paper, glass, and organics with high accuracy and consistency. This automation has significantly improved material purity and reduced contamination, increasing both the economic value of recyclables and compliance with regulatory requirements. Municipalities under pressure to meet zero-waste goals are adopting AI sorting infrastructure at scale. Looking ahead, real-time learning capabilities and integration with robotic arms are expected to drive further improvements in efficiency and throughput, reinforcing sorting and segregation as the market's most critical application area.
End-Use Analysis
In 2025, commercial buildings represent a leading end-use segment for AI in waste management, with adoption driven by strict environmental regulations and cost-saving imperatives. Businesses face increasing pressure to report on sustainability metrics and reduce waste-related expenses. AI technologies help automate compliance and improve waste diversion performance.
Residential buildings also see growing adoption, particularly in densely populated urban areas. Municipalities are introducing smart bins and AI-enabled monitoring systems to track household waste patterns and promote recycling compliance. Industrial facilities, while slower to adopt due to infrastructure limitations, are showing interest in AI to reduce operational waste and manage hazardous materials more safely. Across all segments, the push for higher recycling rates and reduced landfill usage is driving investment in intelligent systems that can deliver measurable waste reduction outcomes.
Regional Analysis
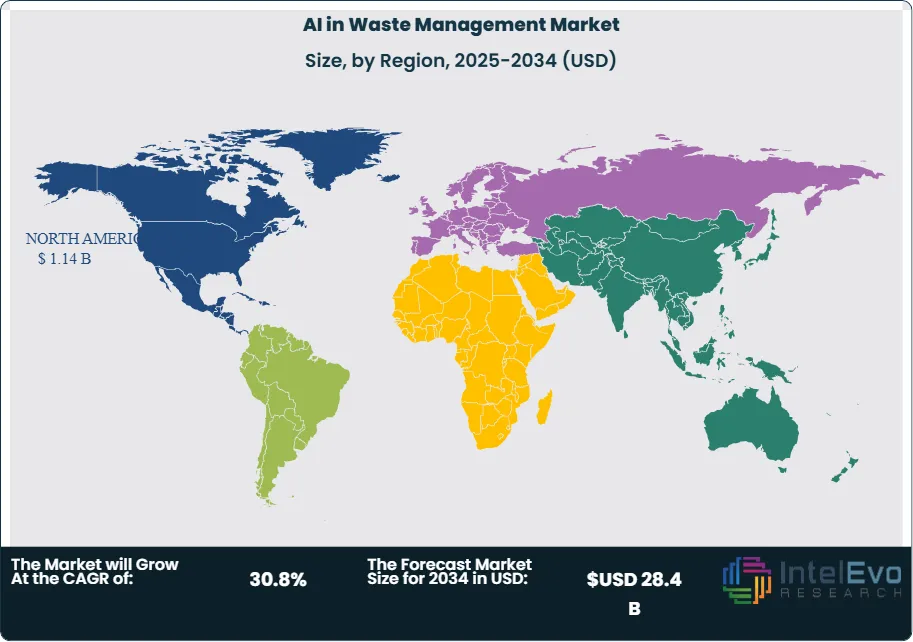
North America continues to lead the global AI in waste management market in 2025, holding a 36.9% share, supported by its mature digital infrastructure and regulatory mandates focused on sustainability. The U.S. and Canada have invested heavily in smart city projects, many of which prioritize AI-powered waste solutions. North America’s AI in waste management market was valued at approximately USD 0.6 billion in 2023 and is projected to grow steadily through 2030.
Asia Pacific, however, is emerging as the fastest-growing region. Rapid urbanization, increasing waste generation, and stronger environmental policies in countries like China, India, and South Korea are driving AI adoption in municipal waste systems. Government-led pilot projects and public-private partnerships are accelerating the rollout of smart waste platforms. Meanwhile, Europe maintains high waste recovery rates—over 88% in some countries—through integrated AI systems that support circular economy objectives. Latin America and the Middle East & Africa, while currently in earlier adoption stages, are gaining attention for targeted investments in urban waste automation and infrastructure development.
By Component, Hardware, Software, Services, By Technology, Machine Learning, Natural Language Processing, Computer Vision, Other Technologies, By Application, Waste Sorting and Segregation, Predictive Maintenance, Route Optimization, Other Applications
Research Methodology
Primary Research- 100 Interviews of Stakeholders
Secondary Research
Desk Research
Regional scope
North America (United States, Canada, Mexico)
Latin America (Brazil, Argentina, Columbia)
East Asia And Pacific (China, Japan, South Korea, Australia, Cambodia, Fiji, Indonesia)
Sea And South Asia (India, Singapore, Thailand, Taiwan, Malaysia)
Eastern Europe (Poland, Russia, Czech Republic, Romania)
Western Europe (Germany, U.K., France, Spain, Itlay)
Middle East & Africa (GCC Countries, Egypt, Nigeria, South Africa, Israel)
Competitive Landscape
Microsoft Corporation, TOMRA Systems ASA, Greyparrot AI Ltd., AMP Robotics Corporation, Intuitive AI, Rubicon, ABB Group, Terex Corporation, IBM Corporation, CleanRobotics, Other Key Players
Customization Scope
Customization for segments, region/country-level will be provided. Moreover, additional customization can be done based on the requirements.
Pricing and Purchase Options
Avail customized purchase options to meet your exact research needs. We have three licenses to opt for: Single User License, Multi-User License (Up to 5 Users), Corporate Use License (Unlimited User and Printable PDF).
TABLE OF CONTENTS
1. EXECUTIVE SUMMARY
1.1. MARKET SNAPSHOT
1.2. KEY FINDINGS & INSIGHTS
1.3. ANALYST RECOMMENDATIONS
1.4. FUTURE OUTLOOK
2. RESEARCH METHODOLOGY
2.1. MARKET DEFINITION & SCOPE
2.2. RESEARCH OBJECTIVES: PRIMARY & SECONDARY DATA SOURCES
2.3. DATA COLLECTION SOURCES
2.3.1. COVERAGE OF 100+ PRIMARY RESEARCH/CONSULTATION CALLS WITH INDUSTRY STAKEHOLDERS
FIGURE 17 NORTH AMERICA AI IN WASTE MANAGEMENT CURRENT AND FUTURE TYPE ANALYSIS, 2025–2034, (USD MILLION)
FIGURE 18 NORTH AMERICA AI IN WASTE MANAGEMENT CURRENT AND FUTURE END USER ANALYSIS, 2025–2034, (USD MILLION)
FIGURE 19 MARKET SHARE BY COUNTRY
FIGURE 20 LATIN AMERICA AI IN WASTE MANAGEMENT CURRENT AND FUTURE TYPE ANALYSIS, 2025–2034, (USD MILLION)
FIGURE 21 LATIN AMERICA AI IN WASTE MANAGEMENT CURRENT AND FUTURE END USER ANALYSIS, 2025–2034, (USD MILLION)
FIGURE 22 MARKET SHARE BY COUNTRY
FIGURE 23 EASTERN EUROPE AI IN WASTE MANAGEMENT CURRENT AND FUTURE TYPE ANALYSIS, 2025–2034, (USD MILLION)
FIGURE 24 EASTERN EUROPE AI IN WASTE MANAGEMENT CURRENT AND FUTURE END USER ANALYSIS, 2025–2034, (USD MILLION)
FIGURE 25 MARKET SHARE BY COUNTRY
FIGURE 26 WESTERN EUROPE AI IN WASTE MANAGEMENT CURRENT AND FUTURE TYPE ANALYSIS, 2025–2034, (USD MILLION)
FIGURE 27 WESTERN EUROPE AI IN WASTE MANAGEMENT CURRENT AND FUTURE END USER ANALYSIS, 2025–2034, (USD MILLION)
FIGURE 28 MARKET SHARE BY COUNTRY
FIGURE 29 EAST ASIA AND PACIFIC AI IN WASTE MANAGEMENT CURRENT AND FUTURE TYPE ANALYSIS, 2025–2034, (USD MILLION)
FIGURE 30 EAST ASIA AND PACIFIC AI IN WASTE MANAGEMENT CURRENT AND FUTURE END USER ANALYSIS, 2025–2034, (USD MILLION)
FIGURE 31 MARKET SHARE BY COUNTRY
FIGURE 32 SEA AND SOUTH ASIA AI IN WASTE MANAGEMENT CURRENT AND FUTURE TYPE ANALYSIS, 2025–2034, (USD MILLION)
FIGURE 33 SEA AND SOUTH ASIA AI IN WASTE MANAGEMENT CURRENT AND FUTURE END USER ANALYSIS, 2025–2034, (USD MILLION)
FIGURE 34 MARKET SHARE BY COUNTRY
FIGURE 35 MIDDLE EAST AND AFRICA AI IN WASTE MANAGEMENT CURRENT AND FUTURE TYPE ANALYSIS, 2025–2034, (USD MILLION)
FIGURE 36 MIDDLE EAST AND AFRICA AI IN WASTE MANAGEMENT CURRENT AND FUTURE END USER ANALYSIS, 2025–2034, (USD MILLION)
FIGURE 37 NORTH AMERICA AI IN WASTE MANAGEMENT CURRENT AND FUTURE MARKET VOLUME SHARE REGIONAL ANALYSIS, 2025–2034, (USD MILLION)
FIGURE 38 U.S. AI IN WASTE MANAGEMENT CURRENT AND FUTURE TYPE ANALYSIS, 2025–2034, (USD MILLION)
FIGURE 39 U.S. AI IN WASTE MANAGEMENT CURRENT AND FUTURE END USER ANALYSIS, 2025–2034, (USD MILLION)
FIGURE 40 CANADA AI IN WASTE MANAGEMENT CURRENT AND FUTURE TYPE ANALYSIS, 2025–2034, (USD MILLION)
FIGURE 41 CANADA AI IN WASTE MANAGEMENT CURRENT AND FUTURE END USER ANALYSIS, 2025–2034, (USD MILLION)
FIGURE 42 LATIN AMERICA AI IN WASTE MANAGEMENT CURRENT AND FUTURE MARKET VOLUME SHARE REGIONAL ANALYSIS, 2025–2034, (USD MILLION)
FIGURE 43 MEXICO AI IN WASTE MANAGEMENT CURRENT AND FUTURE TYPE ANALYSIS, 2025–2034, (USD MILLION)
FIGURE 44 MEXICO AI IN WASTE MANAGEMENT CURRENT AND FUTURE END USER ANALYSIS, 2025–2034, (USD MILLION)
FIGURE 45 BRAZIL AI IN WASTE MANAGEMENT CURRENT AND FUTURE TYPE ANALYSIS, 2025–2034, (USD MILLION)
FIGURE 46 BRAZIL AI IN WASTE MANAGEMENT CURRENT AND FUTURE END USER ANALYSIS, 2025–2034, (USD MILLION)
FIGURE 47 ARGENTINA AI IN WASTE MANAGEMENT CURRENT AND FUTURE TYPE ANALYSIS, 2025–2034, (USD MILLION)
FIGURE 48 ARGENTINA AI IN WASTE MANAGEMENT CURRENT AND FUTURE END USER ANALYSIS, 2025–2034, (USD MILLION)
FIGURE 49 COLUMBIA AI IN WASTE MANAGEMENT CURRENT AND FUTURE TYPE ANALYSIS, 2025–2034, (USD MILLION)
FIGURE 50 COLUMBIA AI IN WASTE MANAGEMENT CURRENT AND FUTURE END USER ANALYSIS, 2025–2034, (USD MILLION)
FIGURE 51 REST OF LATIN AMERICA AI IN WASTE MANAGEMENT CURRENT AND FUTURE TYPE ANALYSIS, 2025–2034, (USD MILLION)
FIGURE 52 REST OF LATIN AMERICA AI IN WASTE MANAGEMENT CURRENT AND FUTURE END USER ANALYSIS, 2025–2034, (USD MILLION)
FIGURE 53 EASTERN EUROPE AI IN WASTE MANAGEMENT CURRENT AND FUTURE MARKET VOLUME SHARE REGIONAL ANALYSIS, 2025–2034, (USD MILLION)
FIGURE 54 POLAND AI IN WASTE MANAGEMENT CURRENT AND FUTURE TYPE ANALYSIS, 2025–2034, (USD MILLION)
FIGURE 55 POLAND AI IN WASTE MANAGEMENT CURRENT AND FUTURE END USER ANALYSIS, 2025–2034, (USD MILLION)
FIGURE 56 RUSSIA AI IN WASTE MANAGEMENT CURRENT AND FUTURE TYPE ANALYSIS, 2025–2034, (USD MILLION)
FIGURE 57 RUSSIA AI IN WASTE MANAGEMENT CURRENT AND FUTURE END USER ANALYSIS, 2025–2034, (USD MILLION)
FIGURE 58 CZECH REPUBLIC AI IN WASTE MANAGEMENT CURRENT AND FUTURE TYPE ANALYSIS, 2025–2034, (USD MILLION)
FIGURE 59 CZECH REPUBLIC AI IN WASTE MANAGEMENT CURRENT AND FUTURE END USER ANALYSIS, 2025–2034, (USD MILLION)
FIGURE 60 ROMANIA AI IN WASTE MANAGEMENT CURRENT AND FUTURE TYPE ANALYSIS, 2025–2034, (USD MILLION)
FIGURE 61 ROMANIA AI IN WASTE MANAGEMENT CURRENT AND FUTURE END USER ANALYSIS, 2025–2034, (USD MILLION)
FIGURE 62 REST OF EASTERN EUROPE AI IN WASTE MANAGEMENT CURRENT AND FUTURE TYPE ANALYSIS, 2025–2034, (USD MILLION)
FIGURE 63 REST OF EASTERN EUROPE AI IN WASTE MANAGEMENT CURRENT AND FUTURE END USER ANALYSIS, 2025–2034, (USD MILLION)
FIGURE 64 WESTERN EUROPE AI IN WASTE MANAGEMENT CURRENT AND FUTURE MARKET VOLUME SHARE REGIONAL ANALYSIS, 2025–2034, (USD MILLION)
FIGURE 65 GERMANY AI IN WASTE MANAGEMENT CURRENT AND FUTURE TYPE ANALYSIS, 2025–2034, (USD MILLION)
FIGURE 66 GERMANY AI IN WASTE MANAGEMENT CURRENT AND FUTURE END USER ANALYSIS, 2025–2034, (USD MILLION)
FIGURE 67 FRANCE AI IN WASTE MANAGEMENT CURRENT AND FUTURE TYPE ANALYSIS, 2025–2034, (USD MILLION)
FIGURE 68 FRANCE AI IN WASTE MANAGEMENT CURRENT AND FUTURE END USER ANALYSIS, 2025–2034, (USD MILLION)
FIGURE 69 UK AI IN WASTE MANAGEMENT CURRENT AND FUTURE TYPE ANALYSIS, 2025–2034, (USD MILLION)
FIGURE 70 UK AI IN WASTE MANAGEMENT CURRENT AND FUTURE END USER ANALYSIS, 2025–2034, (USD MILLION)
FIGURE 71 SPAIN AI IN WASTE MANAGEMENT CURRENT AND FUTURE TYPE ANALYSIS, 2025–2034, (USD MILLION)
FIGURE 72 SPAIN AI IN WASTE MANAGEMENT CURRENT AND FUTURE END USER ANALYSIS, 2025–2034, (USD MILLION)
FIGURE 73 ITALY AI IN WASTE MANAGEMENT CURRENT AND FUTURE TYPE ANALYSIS, 2025–2034, (USD MILLION)
FIGURE 74 ITALY AI IN WASTE MANAGEMENT CURRENT AND FUTURE END USER ANALYSIS, 2025–2034, (USD MILLION)
FIGURE 75 REST OF WESTERN EUROPE AI IN WASTE MANAGEMENT CURRENT AND FUTURE TYPE ANALYSIS, 2025–2034, (USD MILLION)
FIGURE 76 REST OF WESTERN EUROPE AI IN WASTE MANAGEMENT CURRENT AND FUTURE END USER ANALYSIS, 2025–2034, (USD MILLION)
FIGURE 77 EAST ASIA AND PACIFIC AI IN WASTE MANAGEMENT CURRENT AND FUTURE MARKET VOLUME SHARE REGIONAL ANALYSIS, 2025–2034, (USD MILLION)
FIGURE 78 CHINA AI IN WASTE MANAGEMENT CURRENT AND FUTURE TYPE ANALYSIS, 2025–2034, (USD MILLION)
FIGURE 79 CHINA AI IN WASTE MANAGEMENT CURRENT AND FUTURE END USER ANALYSIS, 2025–2034, (USD MILLION)
FIGURE 80 JAPAN AI IN WASTE MANAGEMENT CURRENT AND FUTURE TYPE ANALYSIS, 2025–2034, (USD MILLION)
FIGURE 81 JAPAN AI IN WASTE MANAGEMENT CURRENT AND FUTURE END USER ANALYSIS, 2025–2034, (USD MILLION)
FIGURE 82 AUSTRALIA AI IN WASTE MANAGEMENT CURRENT AND FUTURE TYPE ANALYSIS, 2025–2034, (USD MILLION)
FIGURE 83 AUSTRALIA AI IN WASTE MANAGEMENT CURRENT AND FUTURE END USER ANALYSIS, 2025–2034, (USD MILLION)
FIGURE 84 CAMBODIA AI IN WASTE MANAGEMENT CURRENT AND FUTURE TYPE ANALYSIS, 2025–2034, (USD MILLION)
FIGURE 85 CAMBODIA AI IN WASTE MANAGEMENT CURRENT AND FUTURE END USER ANALYSIS, 2025–2034, (USD MILLION)
FIGURE 86 FIJI AI IN WASTE MANAGEMENT CURRENT AND FUTURE TYPE ANALYSIS, 2025–2034, (USD MILLION)
FIGURE 87 FIJI AI IN WASTE MANAGEMENT CURRENT AND FUTURE END USER ANALYSIS, 2025–2034, (USD MILLION)
FIGURE 88 INDONESIA AI IN WASTE MANAGEMENT CURRENT AND FUTURE TYPE ANALYSIS, 2025–2034, (USD MILLION)
FIGURE 89 INDONESIA AI IN WASTE MANAGEMENT CURRENT AND FUTURE END USER ANALYSIS, 2025–2034, (USD MILLION)
FIGURE 90 SOUTH KOREA AI IN WASTE MANAGEMENT CURRENT AND FUTURE TYPE ANALYSIS, 2025–2034, (USD MILLION)
FIGURE 91 SOUTH KOREA AI IN WASTE MANAGEMENT CURRENT AND FUTURE END USER ANALYSIS, 2025–2034, (USD MILLION)
FIGURE 92 REST OF EAST ASIA AND PACIFIC AI IN WASTE MANAGEMENT CURRENT AND FUTURE TYPE ANALYSIS, 2025–2034, (USD MILLION)
FIGURE 93 REST OF EAST ASIA AND PACIFIC AI IN WASTE MANAGEMENT CURRENT AND FUTURE END USER ANALYSIS, 2025–2034, (USD MILLION)
FIGURE 94 SEA AND SOUTH ASIA AI IN WASTE MANAGEMENT CURRENT AND FUTURE MARKET VOLUME SHARE REGIONAL ANALYSIS, 2025–2034, (USD MILLION)
FIGURE 95 BANGLADESH AI IN WASTE MANAGEMENT CURRENT AND FUTURE TYPE ANALYSIS, 2025–2034, (USD MILLION)
FIGURE 96 BANGLADESH AI IN WASTE MANAGEMENT CURRENT AND FUTURE END USER ANALYSIS, 2025–2034, (USD MILLION)
FIGURE 97 NEW ZEALAND AI IN WASTE MANAGEMENT CURRENT AND FUTURE TYPE ANALYSIS, 2025–2034, (USD MILLION)
FIGURE 98 NEW ZEALAND AI IN WASTE MANAGEMENT CURRENT AND FUTURE END USER ANALYSIS, 2025–2034, (USD MILLION)
FIGURE 99 INDIA AI IN WASTE MANAGEMENT CURRENT AND FUTURE TYPE ANALYSIS, 2025–2034, (USD MILLION)
FIGURE 100 INDIA AI IN WASTE MANAGEMENT CURRENT AND FUTURE END USER ANALYSIS, 2025–2034, (USD MILLION)
FIGURE 101 SINGAPORE AI IN WASTE MANAGEMENT CURRENT AND FUTURE TYPE ANALYSIS, 2025–2034, (USD MILLION)
FIGURE 102 SINGAPORE AI IN WASTE MANAGEMENT CURRENT AND FUTURE END USER ANALYSIS, 2025–2034, (USD MILLION)
FIGURE 103 THAILAND AI IN WASTE MANAGEMENT CURRENT AND FUTURE TYPE ANALYSIS, 2025–2034, (USD MILLION)
FIGURE 104 THAILAND AI IN WASTE MANAGEMENT CURRENT AND FUTURE END USER ANALYSIS, 2025–2034, (USD MILLION)
FIGURE 105 TAIWAN AI IN WASTE MANAGEMENT CURRENT AND FUTURE TYPE ANALYSIS, 2025–2034, (USD MILLION)
FIGURE 106 TAIWAN AI IN WASTE MANAGEMENT CURRENT AND FUTURE END USER ANALYSIS, 2025–2034, (USD MILLION)
FIGURE 107 MALAYSIA AI IN WASTE MANAGEMENT CURRENT AND FUTURE TYPE ANALYSIS, 2025–2034, (USD MILLION)
FIGURE 108 MALAYSIA AI IN WASTE MANAGEMENT CURRENT AND FUTURE END USER ANALYSIS, 2025–2034, (USD MILLION)
FIGURE 109 REST OF SEA AND SOUTH ASIA AI IN WASTE MANAGEMENT CURRENT AND FUTURE TYPE ANALYSIS, 2025–2034, (USD MILLION)
FIGURE 110 REST OF SEA AND SOUTH ASIA AI IN WASTE MANAGEMENT CURRENT AND FUTURE END USER ANALYSIS, 2025–2034, (USD MILLION)
FIGURE 111 MIDDLE EAST AND AFRICA AI IN WASTE MANAGEMENT CURRENT AND FUTURE MARKET VOLUME SHARE REGIONAL ANALYSIS, 2025–2034, (USD MILLION)
FIGURE 112 GCC COUNTRIES AI IN WASTE MANAGEMENT CURRENT AND FUTURE TYPE ANALYSIS, 2025–2034, (USD MILLION)
FIGURE 113 GCC COUNTRIES AI IN WASTE MANAGEMENT CURRENT AND FUTURE END USER ANALYSIS, 2025–2034, (USD MILLION)
FIGURE 114 SAUDI ARABIA AI IN WASTE MANAGEMENT CURRENT AND FUTURE TYPE ANALYSIS, 2025–2034, (USD MILLION)
FIGURE 115 SAUDI ARABIA AI IN WASTE MANAGEMENT CURRENT AND FUTURE END USER ANALYSIS, 2025–2034, (USD MILLION)
FIGURE 116 UAE AI IN WASTE MANAGEMENT CURRENT AND FUTURE TYPE ANALYSIS, 2025–2034, (USD MILLION)
FIGURE 117 UAE AI IN WASTE MANAGEMENT CURRENT AND FUTURE END USER ANALYSIS, 2025–2034, (USD MILLION)
FIGURE 118 BAHRAIN AI IN WASTE MANAGEMENT CURRENT AND FUTURE TYPE ANALYSIS, 2025–2034, (USD MILLION)
FIGURE 119 BAHRAIN AI IN WASTE MANAGEMENT CURRENT AND FUTURE END USER ANALYSIS, 2025–2034, (USD MILLION)
FIGURE 120 KUWAIT AI IN WASTE MANAGEMENT CURRENT AND FUTURE TYPE ANALYSIS, 2025–2034, (USD MILLION)
FIGURE 121 KUWAIT AI IN WASTE MANAGEMENT CURRENT AND FUTURE END USER ANALYSIS, 2025–2034, (USD MILLION)
FIGURE 122 OMAN AI IN WASTE MANAGEMENT CURRENT AND FUTURE TYPE ANALYSIS, 2025–2034, (USD MILLION)
FIGURE 123 OMAN AI IN WASTE MANAGEMENT CURRENT AND FUTURE END USER ANALYSIS, 2025–2034, (USD MILLION)
FIGURE 124 QATAR AI IN WASTE MANAGEMENT CURRENT AND FUTURE TYPE ANALYSIS, 2025–2034, (USD MILLION)
FIGURE 125 QATAR AI IN WASTE MANAGEMENT CURRENT AND FUTURE END USER ANALYSIS, 2025–2034, (USD MILLION)
FIGURE 126 EGYPT AI IN WASTE MANAGEMENT CURRENT AND FUTURE TYPE ANALYSIS, 2025–2034, (USD MILLION)
FIGURE 127 EGYPT AI IN WASTE MANAGEMENT CURRENT AND FUTURE END USER ANALYSIS, 2025–2034, (USD MILLION)
FIGURE 128 NIGERIA AI IN WASTE MANAGEMENT CURRENT AND FUTURE TYPE ANALYSIS, 2025–2034, (USD MILLION)
FIGURE 129 NIGERIA AI IN WASTE MANAGEMENT CURRENT AND FUTURE END USER ANALYSIS, 2025–2034, (USD MILLION)
FIGURE 130 SOUTH AFRICA AI IN WASTE MANAGEMENT CURRENT AND FUTURE TYPE ANALYSIS, 2025–2034, (USD MILLION)
FIGURE 131 SOUTH AFRICA AI IN WASTE MANAGEMENT CURRENT AND FUTURE END USER ANALYSIS, 2025–2034, (USD MILLION)
FIGURE 132 ISRAEL AI IN WASTE MANAGEMENT CURRENT AND FUTURE TYPE ANALYSIS, 2025–2034, (USD MILLION)
FIGURE 133 ISRAEL AI IN WASTE MANAGEMENT CURRENT AND FUTURE END USER ANALYSIS, 2025–2034, (USD MILLION)
FIGURE 134 REST OF MEA AI IN WASTE MANAGEMENT CURRENT AND FUTURE TYPE ANALYSIS, 2025–2034, (USD MILLION)
FIGURE 135 REST OF MEA AI IN WASTE MANAGEMENT CURRENT AND FUTURE END USER ANALYSIS, 2025–2034, (USD MILLION)
FIGURE 136 U. S. MARKET SHARE ANALYSIS BY TYPE (2024)
FIGURE 137 U. S. MARKET SHARE ANALYSIS BY END USER (2024)
FIGURE 138 CANADA MARKET SHARE ANALYSIS BY TYPE (2024)
FIGURE 139 CANADA MARKET SHARE ANALYSIS BY END USER (2024)
FIGURE 140 MEXICO MARKET SHARE ANALYSIS BY TYPE (2024)
FIGURE 141 MEXICO MARKET SHARE ANALYSIS BY END USER (2024)
FIGURE 142 CHINA MARKET SHARE ANALYSIS BY TYPE (2024)
FIGURE 143 CHINA MARKET SHARE ANALYSIS BY END USER (2024)
FIGURE 144 JAPAN MARKET SHARE ANALYSIS BY TYPE (2024)
FIGURE 145 JAPAN MARKET SHARE ANALYSIS BY END USER (2024)
FIGURE 146 INDIA MARKET SHARE ANALYSIS BY TYPE (2024)
FIGURE 147 INDIA MARKET SHARE ANALYSIS BY END USER (2024)
FIGURE 148 SOUTH KOREA MARKET SHARE ANALYSIS BY TYPE (2024)
FIGURE 149 SOUTH KOREA MARKET SHARE ANALYSIS BY END USER (2024)
FIGURE 150 SAUDI ARABIA MARKET SHARE ANALYSIS BY TYPE (2024)
FIGURE 151 SAUDI ARABIA MARKET SHARE ANALYSIS BY END USER (2024)
FIGURE 152 UAE MARKET SHARE ANALYSIS BY TYPE (2024)
FIGURE 153 UAE MARKET SHARE ANALYSIS BY END USER (2024)
FIGURE 154 EGYPT MARKET SHARE ANALYSIS BY TYPE (2024)
FIGURE 155 EGYPT MARKET SHARE ANALYSIS BY END USER (2024)
FIGURE 156 NIGERIA MARKET SHARE ANALYSIS BY TYPE (2024)
FIGURE 157 NIGERIA MARKET SHARE ANALYSIS BY END USER (2024)
FIGURE 158 SOUTH AFRICA MARKET SHARE ANALYSIS BY TYPE (2024)
FIGURE 159 SOUTH AFRICA MARKET SHARE ANALYSIS BY END USER (2024)
FIGURE 160 GERMANY MARKET SHARE ANALYSIS BY TYPE (2024)
FIGURE 161 GERMANY MARKET SHARE ANALYSIS BY END USER (2024)
FIGURE 162 FRANCE MARKET SHARE ANALYSIS BY TYPE (2024)
FIGURE 163 FRANCE MARKET SHARE ANALYSIS BY END USER (2024)
FIGURE 164 UK MARKET SHARE ANALYSIS BY TYPE (2024)
FIGURE 165 UK MARKET SHARE ANALYSIS BY END USER (2024)
FIGURE 166 SPAIN MARKET SHARE ANALYSIS BY TYPE (2024)
FIGURE 167 SPAIN MARKET SHARE ANALYSIS BY END USER (2024)
FIGURE 168 ITALY MARKET SHARE ANALYSIS BY TYPE (2024)
FIGURE 169 ITALY MARKET SHARE ANALYSIS BY END USER (2024)
FIGURE 170 BRAZIL MARKET SHARE ANALYSIS BY TYPE (2024)
FIGURE 171 BRAZIL MARKET SHARE ANALYSIS BY END USER (2024)
FIGURE 172 ARGENTINA MARKET SHARE ANALYSIS BY TYPE (2024)
FIGURE 173 ARGENTINA MARKET SHARE ANALYSIS BY END USER (2024)
FIGURE 174 COLUMBIA MARKET SHARE ANALYSIS BY TYPE (2024)
FIGURE 175 COLUMBIA MARKET SHARE ANALYSIS BY END USER (2024)
FIGURE 176 GLOBAL AI IN WASTE MANAGEMENT CURRENT AND FUTURE MARKET KEY COUNTRY LEVEL ANALYSIS, 2024–2034, (USD MILLION)
FIGURE 177 FINANCIAL OVERVIEW:
Key Player Analysis
IBM Corporation: IBM positions itself as a global leader in AI integration for waste management through its enterprise-grade cloud and AI platforms. Its Environmental Intelligence Suite and Watson AI tools are used by municipalities and industrial clients to monitor waste flows, analyze collection trends, and automate logistics planning. In 2025, IBM is expanding its AI waste management capabilities through partnerships with local governments in North America and Europe, focusing on AI-powered waste analytics and real-time route optimization. The company's strength lies in its data infrastructure, security compliance, and ability to integrate AI with existing ERP and IoT systems. IBM’s long-standing enterprise relationships and vertical expertise in smart cities and sustainability make it a preferred partner for public sector contracts and large-scale waste operators aiming for digital transformation.
TOMRA Systems ASA: TOMRA remains a key innovator in AI-powered sensor-based sorting and is widely recognized as a market leader in material recovery. In 2025, the company’s AI-enabled optical sorters—such as the AUTOSORT series—are deployed in over 80 countries, with growing adoption in Asia and Latin America. TOMRA continues to invest heavily in R&D, directing more than 6% of its annual revenue into machine learning capabilities for advanced waste recognition and material purity enhancement. Its acquisition of smaller AI analytics firms in 2024 strengthened its in-house algorithm development. TOMRA’s differentiator lies in its end-to-end sorting systems, which deliver up to 96% sorting accuracy, critical for achieving regulatory recycling quotas. Its established customer base across municipal and industrial recyclers positions it well as regulations tighten globally.
Terex Corporation: Terex operates as a challenger in the AI waste management space, leveraging its manufacturing strength in recycling and material processing equipment. Through its Environmental Equipment segment, the company has introduced AI-enabled upgrades to shredders and material handlers, aimed at improving performance and reducing unplanned maintenance. In 2025, Terex is focusing on strategic collaborations with AI software providers to bring intelligence into traditionally mechanical systems. The company's competitive edge lies in its global distribution network and modular equipment design, allowing easy retrofitting with AI sensors and analytics. Terex is actively expanding its footprint in Southeast Asia and Eastern Europe, targeting regions where waste infrastructure is undergoing modernization.
Microsoft Corporation: Microsoft is positioning itself as a technology enabler rather than a direct waste management provider. Through Azure AI and its growing portfolio of environmental solutions, the company supports platform development for AI-based waste monitoring, data visualization, and cloud-based decision systems. In 2025, Microsoft has established joint initiatives with municipal tech startups and utility providers in over 15 countries, integrating Azure Machine Learning with sensor-driven waste systems. The company’s advantage comes from its cloud scalability, cybersecurity standards, and integration ecosystem with thousands of enterprise and public sector users. Microsoft’s strategy aligns with broader ESG goals, enabling clients to meet compliance mandates through AI-based reporting, carbon tracking, and sustainability dashboards.
Market Key Players
Microsoft Corporation
TOMRA Systems ASA
Greyparrot AI Ltd.
AMP Robotics Corporation
Intuitive AI
Rubicon
ABB Group
Terex Corporation
IBM Corporation
CleanRobotics
Other Key Players
Driver
AI Technologies Transform Core Waste Operations
In 2025, AI-driven technologies are reshaping global waste management operations through measurable gains in efficiency and cost control. Machine learning, computer vision, and sensor-enabled systems are automating core processes such as material identification, sorting, and route planning. These tools reduce the need for manual labor while improving sorting precision and diverting more waste from landfills. For example, AI-enhanced optical sorters can achieve over 90% material recognition accuracy, significantly improving recycling yields.
Cost Efficiency and Compliance Strengthen AI Adoption
The impact is operational and financial. Smart routing systems are lowering fuel costs by up to 20%, while predictive maintenance supported by AI reduces unplanned downtime. As these technologies scale and mature, total cost of ownership decreases, encouraging broader adoption across municipalities and private waste operators. In highly regulated markets, AI’s ability to demonstrate environmental compliance further positions it as a strategic asset, not just a technical upgrade.
Restraint
High Capital Costs Limit Adoption in Budget-Constrained Regions
Despite long-term cost savings, the high capital requirements of deploying AI in waste management remain a barrier to entry. As of 2025, upfront investments for AI-integrated systems—including sensor networks, robotics, software licenses, and system integration—can range from USD 500,000 to over USD 2 million for mid-sized operations. This is a deterrent for smaller municipalities and developing regions with constrained infrastructure budgets.
Technical Integration Challenges Slow Deployment
The financial risk is compounded by the technical complexity of integrating AI tools into legacy waste systems. Delays in implementation and insufficient in-house technical expertise further slow adoption. For investors and vendors, this creates a segmented market where deployment is concentrated among large, well-funded operators, limiting overall growth in under-resourced regions.
Opportunity
Global Policy Momentum Accelerates AI Adoption
Global regulatory momentum is shifting in favor of advanced waste technologies. By 2025, more than 60 countries have introduced mandates targeting landfill reduction, higher recycling quotas, or net-zero emissions—many of which include provisions or incentives for smart waste solutions. The European Green Deal, for instance, has allocated billions in funding tied to circular economy outcomes, while cities like Tokyo and Singapore have launched AI-backed waste audits to improve recovery rates.
Compliance-Aligned AI Solutions Unlock New Revenue Streams
This regulatory tailwind opens the door for AI providers to align offerings with compliance targets. Solutions that support auditability, automation, and measurable impact stand to gain a competitive edge. Vendors that can offer modular, policy-aligned tools for municipal and industrial users will likely benefit from increased procurement, especially in regions with ESG-linked funding.
Trend
AI Robotics Redefine High-Throughput Waste Sorting
Automation in waste sorting is accelerating through AI-powered robotics, transforming how materials are processed at scale. In 2025, intelligent robotic arms equipped with computer vision and machine learning algorithms are becoming common in high-throughput sorting facilities. These systems operate at speeds exceeding 60 picks per minute with over 95% sorting accuracy for select material types. Companies like AMP Robotics and ZenRobotics are expanding deployments globally, pushing AI sorting into mainstream operations.
IoT Integration and Cloud Platforms Enable Data-Driven Waste Systems
This trend is reinforced by integration with IoT and cloud platforms. Real-time data collection from smart bins and sorting lines feeds into central systems that optimize logistics, monitor contamination, and predict fill levels. AI platforms that offer plug-and-play interoperability with existing infrastructure are gaining traction. The shift toward cloud-based, subscription-driven AI services also lowers entry barriers and supports remote scalability. This convergence is reshaping the economics of waste handling, positioning AI as a core enabler of data-driven circular waste systems.
Recent Developments
Dec 2024 – TOMRA Systems ASA: TOMRA launched an upgraded version of its AUTOSORT™ AI system with enhanced deep learning algorithms, improving sorting accuracy for complex materials by 12%. This supports higher recovery rates for mixed waste streams and strengthens TOMRA’s competitive edge in high-throughput recycling facilities.
Feb 2025 – Terex Corporation: Terex announced a strategic partnership with a German AI software firm to integrate predictive maintenance and smart diagnostics into its Ecotec waste handling equipment. The integration is expected to reduce equipment downtime by up to 30%. This move enhances Terex’s appeal to cost-sensitive operators seeking intelligent equipment solutions.
Apr 2025 – IBM Corporation: IBM signed a multi-year agreement with the city of Toronto to deploy AI-based route optimization and real-time waste analytics across its municipal fleet, covering over 1.8 million residents. The initiative is projected to cut fuel costs by 18% annually. This strengthens IBM’s public sector positioning in North America.
Jul 2025 – Microsoft Corporation: Microsoft expanded its Azure AI for Sustainability portfolio by introducing a modular waste intelligence toolkit tailored for smart cities. Early adoption by three Southeast Asian capitals is underway, with projected deployment across 120 municipalities by 2026. This expands Microsoft’s footprint in urban AI infrastructure.
Sep 2025 – AMP Robotics: AMP Robotics secured a USD 75 million Series D funding round to scale deployment of its AI-powered robotic sorting systems in Latin America and India. The funding aims to double its installed base globally by late 2026. This positions AMP as a high-growth disruptor in emerging markets with infrastructure gaps.