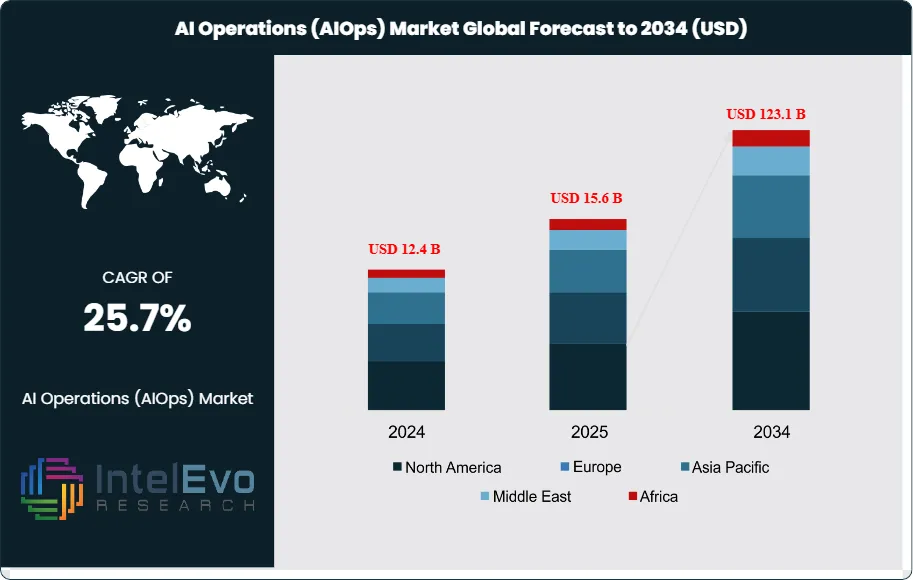
The AI Operations (AIOps) Market was valued at USD 12.4 Billion in 2024 and is projected to reach approximately USD 123.1 Billion by 2034. The market is estimated to grow to around USD 15.6 Billion in 2025. Based on projected expansion from 2026 onward, the industry is expected to register a compound annual growth rate (CAGR) of approximately 25.7% during 2026–2034.
AIOps applies machine learning, analytics, and automation to detect anomalies, correlate events, and accelerate remediation across modern IT estates. Demand rises as enterprises run hybrid cloud stacks, microservices, and distributed applications that generate high-velocity telemetry. This complexity pushes operations teams toward real-time intelligence that reduces mean time to detect and resolve incidents and protects service availability for digital revenue streams. In parallel, boards prioritize resilience and continuity, which keeps AIOps on shortlists for modernization budgets even under cost controls.
Supply conditions also strengthen. Platform vendors expand integrations across observability, IT service management, and security tooling, which lowers deployment friction and increases switching costs. Mature ecosystems support faster time-to-value through prebuilt connectors, domain models, and guided workflows. Providers also position AIOps as a consolidation layer that trims tool sprawl and labor intensity, which supports pricing power in large enterprises while sustaining a growing mid-market footprint.
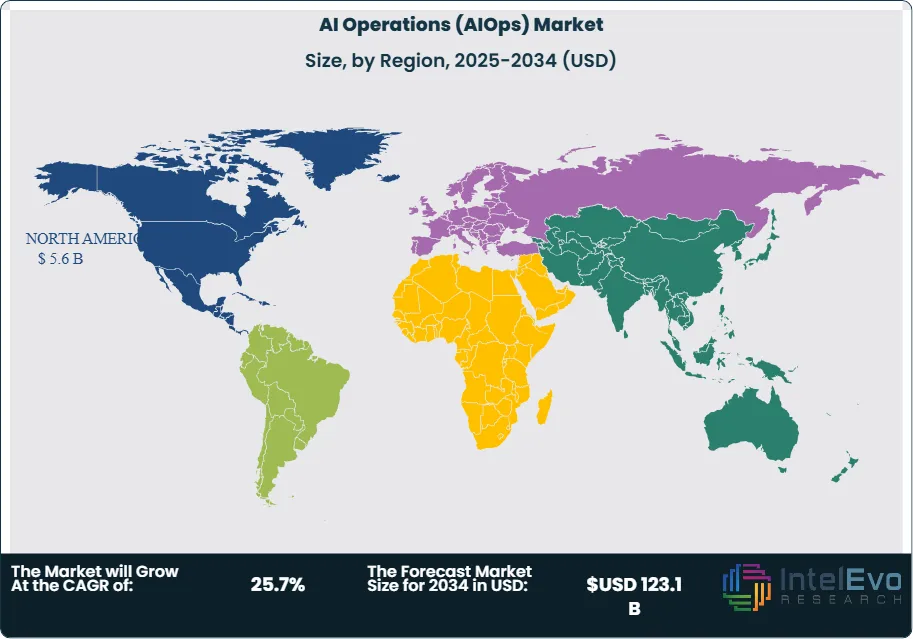
North America led in 2024 with over 45.5% share and revenue of USD 5.6 billion, supported by dense cloud adoption and advanced operational maturity. Europe represents an estimated ~23.0% share, while Asia Pacific holds ~20.0% and is the fastest-growing region as digital-native firms scale and regulated industries modernize core systems. Investment activity clusters around the United States and Canada for product innovation, the United Kingdom and Germany for regulated-industry rollouts, and India, Singapore, and Japan for large-scale managed services and cloud migration programs.
Regulatory and governance pressures shape buying criteria. Data privacy rules, critical infrastructure requirements, and sector oversight in finance and healthcare increase demand for auditability, explainability, and secure data handling in AI-driven operations. Key risks include noisy data, model drift, integration gaps across legacy tools, and skills shortages that slow adoption. Continued advances in machine learning, streaming analytics, and automation expand predictive accuracy and enable closed-loop remediation, reinforcing AIOps as a core layer for operating digital infrastructure at scale.
Key Takeaways
Market Growth: The market expands from 12.4 billion USD, 2024 to 123.1 billion USD, 2034, at 25.8%, 2024-2034.
Segment Dominance: The Platform segment leads with 67.5%, 2024, driven by enterprise preference for unified AIOps suites.
Segment Dominance: On-Premises deployment holds 58.9%, 2024, supported by control and compliance requirements in regulated IT estates.
Driver: Large Enterprises drive adoption with 73.5%, 2024, as they scale AI to reduce downtime and improve operations.
Restraint: Implementation complexity and integration effort constrain adoption at estimated: 12.0% of deployments delayed, 2024.
Opportunity: Application Performance Management anchors demand at 44.2%, 2024, and enables expansion into adjacent use cases at estimated: 18.0% incremental revenue uplift, 2030.
Trend: IT & Telecom remains the primary vertical at 31.8%, 2024, while automation accelerates incident response at estimated: 35.0% faster MTTR, 2026.
Regional Analysis: North America leads with 45.5%, 2024 and 5.6 billion USD, 2024; the US reaches 4.86 billion USD, 2024 and grows at 26.7%, 2024-2034.
By Type
By 2025, the AIOps market shows a clear preference for integrated platform offerings over standalone services. Platforms account for more than 67.5% of total revenue, reflecting demand for unified systems that combine real-time analytics, machine learning models, and automated remediation. You see this preference most clearly in enterprises managing hybrid and multi-cloud environments, where fragmented tools increase operational risk and response time.
Platforms reduce manual intervention across incident detection, correlation, and resolution. This structure lowers operational expenditure by an estimated 25.0% to 35.0% across large IT estates between 2024 and 2030. Vendors continue to expand native integrations with observability, service management, and security tools, which shortens deployment cycles and improves operational visibility.
As IT architectures evolve beyond 2025, platform-based AIOps solutions remain the primary investment focus. Their ability to absorb rising data volumes and support continuous model retraining positions them as long-term infrastructure components rather than optional add-ons.
By Application
Application Performance Management remains the largest application area, holding over 44.2% of market share in 2024 and sustaining momentum into 2025. You rely on APM-driven AIOps to monitor distributed applications, detect latency anomalies, and isolate root causes across microservices architectures. This function directly supports digital revenue streams where downtime carries measurable financial impact.
Infrastructure and network management applications follow, driven by increased traffic from cloud workloads, 5G rollouts, and edge deployments. Real-time analytics use cases grow at an estimated CAGR of 27.0% from 2025 to 2034 as enterprises prioritize predictive incident prevention rather than reactive resolution.
Advances in machine learning improve accuracy in anomaly detection and event correlation. These capabilities reduce false alerts by an estimated 30.0% by 2026, allowing IT teams to focus on high-severity issues that affect customer experience.
By End-Use
Large enterprises continue to dominate adoption, accounting for more than 73.5% of total spending. You see this trend in sectors running complex, mission-critical systems where downtime directly affects compliance, revenue, and brand trust. These organizations allocate dedicated budgets for AIOps to manage scale and operational risk.
Small and medium enterprises increase adoption gradually as cloud-native operations expand. Cloud-based AIOps services reduce entry costs, but concerns around data governance and skills availability still limit uptake. SME adoption grows at an estimated CAGR of 29.0% from 2025 onward, supported by managed service providers.
Across all end-use segments, AIOps supports measurable reductions in mean time to resolution, often exceeding 40.0% within the first year of deployment. This operational impact sustains long-term investment interest.
By Region
North America remains the leading regional market, holding over 45.5% share and generating 5.6 billion USD in revenue in 2024. You benefit from early cloud adoption, mature DevOps practices, and strong presence of AIOps vendors in the United States and Canada. Regulatory pressure around data security further accelerates adoption.
Europe follows with steady growth driven by financial services, telecom, and government digitalization initiatives. Asia Pacific emerges as the fastest-growing region through 2034, supported by large-scale cloud migration in China, India, and Southeast Asia. Regional CAGR exceeds 28.0% from 2025 onward.
Latin America and the Middle East and Africa show early-stage growth. Investments focus on telecom modernization and public sector IT resilience. As infrastructure matures, these regions present medium-term expansion opportunities for global AIOps providers.
By Offering (Platform, Services), By Deployment Mode (On-Premises, Cloud), By Enterprise Size (Small & Medium Enterprise Size (SME’s), Large Enterprises), By Application (Application Performance Management, Infrastructure Management, Network and Security Management, Real-Time Analytics, Others (Predictive Analytics, Root Cause Analysis)), By Industry (IT & Telecom, Retail & E-Commerce, Energy & Utilities, Media & Entertainment, BFSI, Healthcare, Government, Others)
Research Methodology
Primary Research- 100 Interviews of Stakeholders
Secondary Research
Desk Research
Regional scope
North America (United States, Canada, Mexico)
Latin America (Brazil, Argentina, Columbia)
East Asia And Pacific (China, Japan, South Korea, Australia, Cambodia, Fiji, Indonesia)
Sea And South Asia (India, Singapore, Thailand, Taiwan, Malaysia)
Eastern Europe (Poland, Russia, Czech Republic, Romania)
Western Europe (Germany, U.K., France, Spain, Itlay)
Middle East & Africa (GCC Countries, Egypt, Nigeria, South Africa, Israel)
Competitive Landscape
Splunk LLC, IBM Corporation, ProphetStor Data Services, Inc., Broadcom Inc., Dell Inc., APPDYNAMICS, Thales, Micro Focus International plc, HCL Technologies Limited, BMC Software, Inc., Others
Customization Scope
Customization for segments, region/country-level will be provided. Moreover, additional customization can be done based on the requirements.
Pricing and Purchase Options
Avail customized purchase options to meet your exact research needs. We have three licenses to opt for: Single User License, Multi-User License (Up to 5 Users), Corporate Use License (Unlimited User and Printable PDF).
TABLE OF CONTENTS
1. EXECUTIVE SUMMARY
1.1. MARKET SNAPSHOT
1.2. KEY FINDINGS & INSIGHTS
1.3. ANALYST RECOMMENDATIONS
1.4. FUTURE OUTLOOK
2. RESEARCH METHODOLOGY
2.1. MARKET DEFINITION & SCOPE
2.2. RESEARCH OBJECTIVES: PRIMARY & SECONDARY DATA SOURCES
2.3. DATA COLLECTION SOURCES
2.3.1. COVERAGE OF 100+ PRIMARY RESEARCH/CONSULTATION CALLS WITH INDUSTRY STAKEHOLDERS
FIGURE 17 NORTH AMERICA AI OPERATIONS (AIOPS)CURRENT AND FUTURE TYPE ANALYSIS, 2025–2034, (USD MILLION)
FIGURE 18 NORTH AMERICA AI OPERATIONS (AIOPS)CURRENT AND FUTURE END USER ANALYSIS, 2025–2034, (USD MILLION)
FIGURE 19 MARKET SHARE BY COUNTRY
FIGURE 20 LATIN AMERICA AI OPERATIONS (AIOPS)CURRENT AND FUTURE TYPE ANALYSIS, 2025–2034, (USD MILLION)
FIGURE 21 LATIN AMERICA AI OPERATIONS (AIOPS)CURRENT AND FUTURE END USER ANALYSIS, 2025–2034, (USD MILLION)
FIGURE 22 MARKET SHARE BY COUNTRY
FIGURE 23 EASTERN EUROPE AI OPERATIONS (AIOPS)CURRENT AND FUTURE TYPE ANALYSIS, 2025–2034, (USD MILLION)
FIGURE 24 EASTERN EUROPE AI OPERATIONS (AIOPS)CURRENT AND FUTURE END USER ANALYSIS, 2025–2034, (USD MILLION)
FIGURE 25 MARKET SHARE BY COUNTRY
FIGURE 26 WESTERN EUROPE AI OPERATIONS (AIOPS)CURRENT AND FUTURE TYPE ANALYSIS, 2025–2034, (USD MILLION)
FIGURE 27 WESTERN EUROPE AI OPERATIONS (AIOPS)CURRENT AND FUTURE END USER ANALYSIS, 2025–2034, (USD MILLION)
FIGURE 28 MARKET SHARE BY COUNTRY
FIGURE 29 EAST ASIA AND PACIFIC AI OPERATIONS (AIOPS)CURRENT AND FUTURE TYPE ANALYSIS, 2025–2034, (USD MILLION)
FIGURE 30 EAST ASIA AND PACIFIC AI OPERATIONS (AIOPS)CURRENT AND FUTURE END USER ANALYSIS, 2025–2034, (USD MILLION)
FIGURE 31 MARKET SHARE BY COUNTRY
FIGURE 32 SEA AND SOUTH ASIA AI OPERATIONS (AIOPS)CURRENT AND FUTURE TYPE ANALYSIS, 2025–2034, (USD MILLION)
FIGURE 33 SEA AND SOUTH ASIA AI OPERATIONS (AIOPS)CURRENT AND FUTURE END USER ANALYSIS, 2025–2034, (USD MILLION)
FIGURE 34 MARKET SHARE BY COUNTRY
FIGURE 35 MIDDLE EAST AND AFRICA AI OPERATIONS (AIOPS)CURRENT AND FUTURE TYPE ANALYSIS, 2025–2034, (USD MILLION)
FIGURE 36 MIDDLE EAST AND AFRICA AI OPERATIONS (AIOPS)CURRENT AND FUTURE END USER ANALYSIS, 2025–2034, (USD MILLION)
FIGURE 37 NORTH AMERICA AI OPERATIONS (AIOPS)CURRENT AND FUTURE MARKET VOLUME SHARE REGIONAL ANALYSIS, 2025–2034, (USD MILLION)
FIGURE 38 U.S. AI OPERATIONS (AIOPS)CURRENT AND FUTURE TYPE ANALYSIS, 2025–2034, (USD MILLION)
FIGURE 39 U.S. AI OPERATIONS (AIOPS)CURRENT AND FUTURE END USER ANALYSIS, 2025–2034, (USD MILLION)
FIGURE 40 CANADA AI OPERATIONS (AIOPS)CURRENT AND FUTURE TYPE ANALYSIS, 2025–2034, (USD MILLION)
FIGURE 41 CANADA AI OPERATIONS (AIOPS)CURRENT AND FUTURE END USER ANALYSIS, 2025–2034, (USD MILLION)
FIGURE 42 LATIN AMERICA AI OPERATIONS (AIOPS)CURRENT AND FUTURE MARKET VOLUME SHARE REGIONAL ANALYSIS, 2025–2034, (USD MILLION)
FIGURE 43 MEXICO AI OPERATIONS (AIOPS)CURRENT AND FUTURE TYPE ANALYSIS, 2025–2034, (USD MILLION)
FIGURE 44 MEXICO AI OPERATIONS (AIOPS)CURRENT AND FUTURE END USER ANALYSIS, 2025–2034, (USD MILLION)
FIGURE 45 BRAZIL AI OPERATIONS (AIOPS)CURRENT AND FUTURE TYPE ANALYSIS, 2025–2034, (USD MILLION)
FIGURE 46 BRAZIL AI OPERATIONS (AIOPS)CURRENT AND FUTURE END USER ANALYSIS, 2025–2034, (USD MILLION)
FIGURE 47 ARGENTINA AI OPERATIONS (AIOPS)CURRENT AND FUTURE TYPE ANALYSIS, 2025–2034, (USD MILLION)
FIGURE 48 ARGENTINA AI OPERATIONS (AIOPS)CURRENT AND FUTURE END USER ANALYSIS, 2025–2034, (USD MILLION)
FIGURE 49 COLUMBIA AI OPERATIONS (AIOPS)CURRENT AND FUTURE TYPE ANALYSIS, 2025–2034, (USD MILLION)
FIGURE 50 COLUMBIA AI OPERATIONS (AIOPS)CURRENT AND FUTURE END USER ANALYSIS, 2025–2034, (USD MILLION)
FIGURE 51 REST OF LATIN AMERICA AI OPERATIONS (AIOPS)CURRENT AND FUTURE TYPE ANALYSIS, 2025–2034, (USD MILLION)
FIGURE 52 REST OF LATIN AMERICA AI OPERATIONS (AIOPS)CURRENT AND FUTURE END USER ANALYSIS, 2025–2034, (USD MILLION)
FIGURE 53 EASTERN EUROPE AI OPERATIONS (AIOPS)CURRENT AND FUTURE MARKET VOLUME SHARE REGIONAL ANALYSIS, 2025–2034, (USD MILLION)
FIGURE 54 POLAND AI OPERATIONS (AIOPS)CURRENT AND FUTURE TYPE ANALYSIS, 2025–2034, (USD MILLION)
FIGURE 55 POLAND AI OPERATIONS (AIOPS)CURRENT AND FUTURE END USER ANALYSIS, 2025–2034, (USD MILLION)
FIGURE 56 RUSSIA AI OPERATIONS (AIOPS)CURRENT AND FUTURE TYPE ANALYSIS, 2025–2034, (USD MILLION)
FIGURE 57 RUSSIA AI OPERATIONS (AIOPS)CURRENT AND FUTURE END USER ANALYSIS, 2025–2034, (USD MILLION)
FIGURE 58 CZECH REPUBLIC AI OPERATIONS (AIOPS)CURRENT AND FUTURE TYPE ANALYSIS, 2025–2034, (USD MILLION)
FIGURE 59 CZECH REPUBLIC AI OPERATIONS (AIOPS)CURRENT AND FUTURE END USER ANALYSIS, 2025–2034, (USD MILLION)
FIGURE 60 ROMANIA AI OPERATIONS (AIOPS)CURRENT AND FUTURE TYPE ANALYSIS, 2025–2034, (USD MILLION)
FIGURE 61 ROMANIA AI OPERATIONS (AIOPS)CURRENT AND FUTURE END USER ANALYSIS, 2025–2034, (USD MILLION)
FIGURE 62 REST OF EASTERN EUROPE AI OPERATIONS (AIOPS)CURRENT AND FUTURE TYPE ANALYSIS, 2025–2034, (USD MILLION)
FIGURE 63 REST OF EASTERN EUROPE AI OPERATIONS (AIOPS)CURRENT AND FUTURE END USER ANALYSIS, 2025–2034, (USD MILLION)
FIGURE 64 WESTERN EUROPE AI OPERATIONS (AIOPS)CURRENT AND FUTURE MARKET VOLUME SHARE REGIONAL ANALYSIS, 2025–2034, (USD MILLION)
FIGURE 65 GERMANY AI OPERATIONS (AIOPS)CURRENT AND FUTURE TYPE ANALYSIS, 2025–2034, (USD MILLION)
FIGURE 66 GERMANY AI OPERATIONS (AIOPS)CURRENT AND FUTURE END USER ANALYSIS, 2025–2034, (USD MILLION)
FIGURE 67 FRANCE AI OPERATIONS (AIOPS)CURRENT AND FUTURE TYPE ANALYSIS, 2025–2034, (USD MILLION)
FIGURE 68 FRANCE AI OPERATIONS (AIOPS)CURRENT AND FUTURE END USER ANALYSIS, 2025–2034, (USD MILLION)
FIGURE 69 UK AI OPERATIONS (AIOPS)CURRENT AND FUTURE TYPE ANALYSIS, 2025–2034, (USD MILLION)
FIGURE 70 UK AI OPERATIONS (AIOPS)CURRENT AND FUTURE END USER ANALYSIS, 2025–2034, (USD MILLION)
FIGURE 71 SPAIN AI OPERATIONS (AIOPS)CURRENT AND FUTURE TYPE ANALYSIS, 2025–2034, (USD MILLION)
FIGURE 72 SPAIN AI OPERATIONS (AIOPS)CURRENT AND FUTURE END USER ANALYSIS, 2025–2034, (USD MILLION)
FIGURE 73 ITALY AI OPERATIONS (AIOPS)CURRENT AND FUTURE TYPE ANALYSIS, 2025–2034, (USD MILLION)
FIGURE 74 ITALY AI OPERATIONS (AIOPS)CURRENT AND FUTURE END USER ANALYSIS, 2025–2034, (USD MILLION)
FIGURE 75 REST OF WESTERN EUROPE AI OPERATIONS (AIOPS)CURRENT AND FUTURE TYPE ANALYSIS, 2025–2034, (USD MILLION)
FIGURE 76 REST OF WESTERN EUROPE AI OPERATIONS (AIOPS)CURRENT AND FUTURE END USER ANALYSIS, 2025–2034, (USD MILLION)
FIGURE 77 EAST ASIA AND PACIFIC AI OPERATIONS (AIOPS)CURRENT AND FUTURE MARKET VOLUME SHARE REGIONAL ANALYSIS, 2025–2034, (USD MILLION)
FIGURE 78 CHINA AI OPERATIONS (AIOPS)CURRENT AND FUTURE TYPE ANALYSIS, 2025–2034, (USD MILLION)
FIGURE 79 CHINA AI OPERATIONS (AIOPS)CURRENT AND FUTURE END USER ANALYSIS, 2025–2034, (USD MILLION)
FIGURE 80 JAPAN AI OPERATIONS (AIOPS)CURRENT AND FUTURE TYPE ANALYSIS, 2025–2034, (USD MILLION)
FIGURE 81 JAPAN AI OPERATIONS (AIOPS)CURRENT AND FUTURE END USER ANALYSIS, 2025–2034, (USD MILLION)
FIGURE 82 AUSTRALIA AI OPERATIONS (AIOPS)CURRENT AND FUTURE TYPE ANALYSIS, 2025–2034, (USD MILLION)
FIGURE 83 AUSTRALIA AI OPERATIONS (AIOPS)CURRENT AND FUTURE END USER ANALYSIS, 2025–2034, (USD MILLION)
FIGURE 84 CAMBODIA AI OPERATIONS (AIOPS)CURRENT AND FUTURE TYPE ANALYSIS, 2025–2034, (USD MILLION)
FIGURE 85 CAMBODIA AI OPERATIONS (AIOPS)CURRENT AND FUTURE END USER ANALYSIS, 2025–2034, (USD MILLION)
FIGURE 86 FIJI AI OPERATIONS (AIOPS)CURRENT AND FUTURE TYPE ANALYSIS, 2025–2034, (USD MILLION)
FIGURE 87 FIJI AI OPERATIONS (AIOPS)CURRENT AND FUTURE END USER ANALYSIS, 2025–2034, (USD MILLION)
FIGURE 88 INDONESIA AI OPERATIONS (AIOPS)CURRENT AND FUTURE TYPE ANALYSIS, 2025–2034, (USD MILLION)
FIGURE 89 INDONESIA AI OPERATIONS (AIOPS)CURRENT AND FUTURE END USER ANALYSIS, 2025–2034, (USD MILLION)
FIGURE 90 SOUTH KOREA AI OPERATIONS (AIOPS)CURRENT AND FUTURE TYPE ANALYSIS, 2025–2034, (USD MILLION)
FIGURE 91 SOUTH KOREA AI OPERATIONS (AIOPS)CURRENT AND FUTURE END USER ANALYSIS, 2025–2034, (USD MILLION)
FIGURE 92 REST OF EAST ASIA AND PACIFIC AI OPERATIONS (AIOPS)CURRENT AND FUTURE TYPE ANALYSIS, 2025–2034, (USD MILLION)
FIGURE 93 REST OF EAST ASIA AND PACIFIC AI OPERATIONS (AIOPS)CURRENT AND FUTURE END USER ANALYSIS, 2025–2034, (USD MILLION)
FIGURE 94 SEA AND SOUTH ASIA AI OPERATIONS (AIOPS)CURRENT AND FUTURE MARKET VOLUME SHARE REGIONAL ANALYSIS, 2025–2034, (USD MILLION)
FIGURE 95 BANGLADESH AI OPERATIONS (AIOPS)CURRENT AND FUTURE TYPE ANALYSIS, 2025–2034, (USD MILLION)
FIGURE 96 BANGLADESH AI OPERATIONS (AIOPS)CURRENT AND FUTURE END USER ANALYSIS, 2025–2034, (USD MILLION)
FIGURE 97 NEW ZEALAND AI OPERATIONS (AIOPS)CURRENT AND FUTURE TYPE ANALYSIS, 2025–2034, (USD MILLION)
FIGURE 98 NEW ZEALAND AI OPERATIONS (AIOPS)CURRENT AND FUTURE END USER ANALYSIS, 2025–2034, (USD MILLION)
FIGURE 99 INDIA AI OPERATIONS (AIOPS)CURRENT AND FUTURE TYPE ANALYSIS, 2025–2034, (USD MILLION)
FIGURE 100 INDIA AI OPERATIONS (AIOPS)CURRENT AND FUTURE END USER ANALYSIS, 2025–2034, (USD MILLION)
FIGURE 101 SINGAPORE AI OPERATIONS (AIOPS)CURRENT AND FUTURE TYPE ANALYSIS, 2025–2034, (USD MILLION)
FIGURE 102 SINGAPORE AI OPERATIONS (AIOPS)CURRENT AND FUTURE END USER ANALYSIS, 2025–2034, (USD MILLION)
FIGURE 103 THAILAND AI OPERATIONS (AIOPS)CURRENT AND FUTURE TYPE ANALYSIS, 2025–2034, (USD MILLION)
FIGURE 104 THAILAND AI OPERATIONS (AIOPS)CURRENT AND FUTURE END USER ANALYSIS, 2025–2034, (USD MILLION)
FIGURE 105 TAIWAN AI OPERATIONS (AIOPS)CURRENT AND FUTURE TYPE ANALYSIS, 2025–2034, (USD MILLION)
FIGURE 106 TAIWAN AI OPERATIONS (AIOPS)CURRENT AND FUTURE END USER ANALYSIS, 2025–2034, (USD MILLION)
FIGURE 107 MALAYSIA AI OPERATIONS (AIOPS)CURRENT AND FUTURE TYPE ANALYSIS, 2025–2034, (USD MILLION)
FIGURE 108 MALAYSIA AI OPERATIONS (AIOPS)CURRENT AND FUTURE END USER ANALYSIS, 2025–2034, (USD MILLION)
FIGURE 109 REST OF SEA AND SOUTH ASIA AI OPERATIONS (AIOPS)CURRENT AND FUTURE TYPE ANALYSIS, 2025–2034, (USD MILLION)
FIGURE 110 REST OF SEA AND SOUTH ASIA AI OPERATIONS (AIOPS)CURRENT AND FUTURE END USER ANALYSIS, 2025–2034, (USD MILLION)
FIGURE 111 MIDDLE EAST AND AFRICA AI OPERATIONS (AIOPS)CURRENT AND FUTURE MARKET VOLUME SHARE REGIONAL ANALYSIS, 2025–2034, (USD MILLION)
FIGURE 112 GCC COUNTRIES AI OPERATIONS (AIOPS)CURRENT AND FUTURE TYPE ANALYSIS, 2025–2034, (USD MILLION)
FIGURE 113 GCC COUNTRIES AI OPERATIONS (AIOPS)CURRENT AND FUTURE END USER ANALYSIS, 2025–2034, (USD MILLION)
FIGURE 114 SAUDI ARABIA AI OPERATIONS (AIOPS)CURRENT AND FUTURE TYPE ANALYSIS, 2025–2034, (USD MILLION)
FIGURE 115 SAUDI ARABIA AI OPERATIONS (AIOPS)CURRENT AND FUTURE END USER ANALYSIS, 2025–2034, (USD MILLION)
FIGURE 116 UAE AI OPERATIONS (AIOPS)CURRENT AND FUTURE TYPE ANALYSIS, 2025–2034, (USD MILLION)
FIGURE 117 UAE AI OPERATIONS (AIOPS)CURRENT AND FUTURE END USER ANALYSIS, 2025–2034, (USD MILLION)
FIGURE 118 BAHRAIN AI OPERATIONS (AIOPS)CURRENT AND FUTURE TYPE ANALYSIS, 2025–2034, (USD MILLION)
FIGURE 119 BAHRAIN AI OPERATIONS (AIOPS)CURRENT AND FUTURE END USER ANALYSIS, 2025–2034, (USD MILLION)
FIGURE 120 KUWAIT AI OPERATIONS (AIOPS)CURRENT AND FUTURE TYPE ANALYSIS, 2025–2034, (USD MILLION)
FIGURE 121 KUWAIT AI OPERATIONS (AIOPS)CURRENT AND FUTURE END USER ANALYSIS, 2025–2034, (USD MILLION)
FIGURE 122 OMAN AI OPERATIONS (AIOPS)CURRENT AND FUTURE TYPE ANALYSIS, 2025–2034, (USD MILLION)
FIGURE 123 OMAN AI OPERATIONS (AIOPS)CURRENT AND FUTURE END USER ANALYSIS, 2025–2034, (USD MILLION)
FIGURE 124 QATAR AI OPERATIONS (AIOPS)CURRENT AND FUTURE TYPE ANALYSIS, 2025–2034, (USD MILLION)
FIGURE 125 QATAR AI OPERATIONS (AIOPS)CURRENT AND FUTURE END USER ANALYSIS, 2025–2034, (USD MILLION)
FIGURE 126 EGYPT AI OPERATIONS (AIOPS)CURRENT AND FUTURE TYPE ANALYSIS, 2025–2034, (USD MILLION)
FIGURE 127 EGYPT AI OPERATIONS (AIOPS)CURRENT AND FUTURE END USER ANALYSIS, 2025–2034, (USD MILLION)
FIGURE 128 NIGERIA AI OPERATIONS (AIOPS)CURRENT AND FUTURE TYPE ANALYSIS, 2025–2034, (USD MILLION)
FIGURE 129 NIGERIA AI OPERATIONS (AIOPS)CURRENT AND FUTURE END USER ANALYSIS, 2025–2034, (USD MILLION)
FIGURE 130 SOUTH AFRICA AI OPERATIONS (AIOPS)CURRENT AND FUTURE TYPE ANALYSIS, 2025–2034, (USD MILLION)
FIGURE 131 SOUTH AFRICA AI OPERATIONS (AIOPS)CURRENT AND FUTURE END USER ANALYSIS, 2025–2034, (USD MILLION)
FIGURE 132 ISRAEL AI OPERATIONS (AIOPS)CURRENT AND FUTURE TYPE ANALYSIS, 2025–2034, (USD MILLION)
FIGURE 133 ISRAEL AI OPERATIONS (AIOPS)CURRENT AND FUTURE END USER ANALYSIS, 2025–2034, (USD MILLION)
FIGURE 134 REST OF MEA AI OPERATIONS (AIOPS)CURRENT AND FUTURE TYPE ANALYSIS, 2025–2034, (USD MILLION)
FIGURE 135 REST OF MEA AI OPERATIONS (AIOPS)CURRENT AND FUTURE END USER ANALYSIS, 2025–2034, (USD MILLION)
FIGURE 136 U. S. MARKET SHARE ANALYSIS BY TYPE (2024)
FIGURE 137 U. S. MARKET SHARE ANALYSIS BY END USER (2024)
FIGURE 138 CANADA MARKET SHARE ANALYSIS BY TYPE (2024)
FIGURE 139 CANADA MARKET SHARE ANALYSIS BY END USER (2024)
FIGURE 140 MEXICO MARKET SHARE ANALYSIS BY TYPE (2024)
FIGURE 141 MEXICO MARKET SHARE ANALYSIS BY END USER (2024)
FIGURE 142 CHINA MARKET SHARE ANALYSIS BY TYPE (2024)
FIGURE 143 CHINA MARKET SHARE ANALYSIS BY END USER (2024)
FIGURE 144 JAPAN MARKET SHARE ANALYSIS BY TYPE (2024)
FIGURE 145 JAPAN MARKET SHARE ANALYSIS BY END USER (2024)
FIGURE 146 INDIA MARKET SHARE ANALYSIS BY TYPE (2024)
FIGURE 147 INDIA MARKET SHARE ANALYSIS BY END USER (2024)
FIGURE 148 SOUTH KOREA MARKET SHARE ANALYSIS BY TYPE (2024)
FIGURE 149 SOUTH KOREA MARKET SHARE ANALYSIS BY END USER (2024)
FIGURE 150 SAUDI ARABIA MARKET SHARE ANALYSIS BY TYPE (2024)
FIGURE 151 SAUDI ARABIA MARKET SHARE ANALYSIS BY END USER (2024)
FIGURE 152 UAE MARKET SHARE ANALYSIS BY TYPE (2024)
FIGURE 153 UAE MARKET SHARE ANALYSIS BY END USER (2024)
FIGURE 154 EGYPT MARKET SHARE ANALYSIS BY TYPE (2024)
FIGURE 155 EGYPT MARKET SHARE ANALYSIS BY END USER (2024)
FIGURE 156 NIGERIA MARKET SHARE ANALYSIS BY TYPE (2024)
FIGURE 157 NIGERIA MARKET SHARE ANALYSIS BY END USER (2024)
FIGURE 158 SOUTH AFRICA MARKET SHARE ANALYSIS BY TYPE (2024)
FIGURE 159 SOUTH AFRICA MARKET SHARE ANALYSIS BY END USER (2024)
FIGURE 160 GERMANY MARKET SHARE ANALYSIS BY TYPE (2024)
FIGURE 161 GERMANY MARKET SHARE ANALYSIS BY END USER (2024)
FIGURE 162 FRANCE MARKET SHARE ANALYSIS BY TYPE (2024)
FIGURE 163 FRANCE MARKET SHARE ANALYSIS BY END USER (2024)
FIGURE 164 UK MARKET SHARE ANALYSIS BY TYPE (2024)
FIGURE 165 UK MARKET SHARE ANALYSIS BY END USER (2024)
FIGURE 166 SPAIN MARKET SHARE ANALYSIS BY TYPE (2024)
FIGURE 167 SPAIN MARKET SHARE ANALYSIS BY END USER (2024)
FIGURE 168 ITALY MARKET SHARE ANALYSIS BY TYPE (2024)
FIGURE 169 ITALY MARKET SHARE ANALYSIS BY END USER (2024)
FIGURE 170 BRAZIL MARKET SHARE ANALYSIS BY TYPE (2024)
FIGURE 171 BRAZIL MARKET SHARE ANALYSIS BY END USER (2024)
FIGURE 172 ARGENTINA MARKET SHARE ANALYSIS BY TYPE (2024)
FIGURE 173 ARGENTINA MARKET SHARE ANALYSIS BY END USER (2024)
FIGURE 174 COLUMBIA MARKET SHARE ANALYSIS BY TYPE (2024)
FIGURE 175 COLUMBIA MARKET SHARE ANALYSIS BY END USER (2024)
FIGURE 176 GLOBAL AI OPERATIONS (AIOPS)CURRENT AND FUTURE MARKET KEY COUNTRY LEVEL ANALYSIS, 2024–2034, (USD MILLION)
FIGURE 177 FINANCIAL OVERVIEW:
Key Player Analysis
BMC Software, Inc.: BMC Software positions itself as a market leader in enterprise-focused AIOps, with strong penetration across large regulated organizations. Its Helix AIOps platform anchors the portfolio and supports event correlation, anomaly detection, service assurance, and automated remediation across hybrid and multi-cloud environments. As of 2025, BMC maintains a strong installed base among Global 2000 enterprises, particularly in BFSI, telecom, and government, where uptime and compliance drive buying decisions.
Strategically, BMC continues to invest in AI model refinement and cloud-native deployment options while maintaining deep on-premises support. The company expands integrations across IT service management and observability ecosystems to reduce operational silos. Its differentiation lies in enterprise-grade governance, explainability, and control, which aligns with organizations managing complex legacy estates. Industry estimates suggest BMC retains low-to-mid single-digit global AIOps market share but commands higher average contract values than many peers.
Broadcom Inc.: Broadcom operates as a strong challenger in the AIOps market, anchored by its infrastructure software portfolio following multiple acquisitions in IT operations management. The company’s AIOps capabilities sit within its broader observability and infrastructure management stack, serving customers running large-scale data centers, telecom networks, and cloud infrastructure. In 2025, Broadcom benefits from cross-selling AIOps into an installed base exceeding tens of thousands of enterprise customers worldwide.
Broadcom’s strategy centers on platform consolidation and deep infrastructure visibility. It invests in AI-driven root cause analysis and predictive monitoring to support high-throughput environments. The company differentiates through tight integration with network, application, and mainframe operations, which appeals to enterprises seeking unified control. Software revenues linked to infrastructure management continue to grow at an estimated high-teens percentage annually, supporting sustained AIOps investment.
HCL Technologies Limited: HCL Technologies positions itself as an innovator through service-centric AIOps delivery rather than pure software leadership. The company integrates AIOps frameworks into its managed services and digital operations offerings, targeting large enterprises undergoing cloud migration and IT modernization. By 2025, AIOps-enabled managed services account for an estimated 30.0% or more of HCL’s infrastructure services engagements.
HCL focuses on industry-specific use cases across telecom, healthcare, manufacturing, and financial services. It builds proprietary accelerators and automation layers on top of partner platforms to reduce incident volumes and improve resolution speed. Differentiation comes from scale, domain expertise, and global delivery reach, particularly in North America and Europe. This approach positions HCL as a preferred partner for enterprises seeking outcome-based AIOps adoption rather than standalone software deployment.
Market Key Players
Splunk LLC
IBM Corporation
ProphetStor Data Services, Inc.
Broadcom Inc.
Dell Inc.
APPDYNAMICS
Thales
Micro Focus International plc
HCL Technologies Limited
BMC Software, Inc.
Others
Driver:
Hybrid IT Complexity Accelerating AIOps Adoption
By 2025, you operate IT environments that span public cloud, private infrastructure, microservices, and connected devices. This architecture generates high-frequency telemetry across logs, metrics, traces, and events. Manual operations cannot keep pace with this volume or speed. As a result, AIOps adoption accelerates as enterprises seek automated correlation and real-time intelligence. Industry surveys indicate that more than 62.0% of large organizations now rely on AIOps-driven monitoring to manage hybrid environments, up from an estimated 41.0% in 2022.
AIOps platforms process millions of events per hour and surface actionable insights in seconds. This capability reduces mean time to detection by over 40.0% in complex environments. For you, this directly supports uptime targets, service-level agreements, and digital revenue protection. The driver strengthens long-term spending, supporting a market CAGR near 25.8% through 2034 and positioning AIOps as core operational infrastructure rather than discretionary software.
Restraint:
Legacy System Integration and Deployment Delays
Integration complexity remains a material constraint in 2025. Many enterprises still run legacy systems alongside cloud-native stacks. These environments use inconsistent data models, proprietary interfaces, and fragmented workflows. You often face extended deployment timelines as teams reconcile data ingestion, normalization, and access controls across tools.
Extended Time-to-Value in Complex IT Environments
This challenge slows time-to-value. Market benchmarks show that first-phase AIOps deployments can exceed six months in legacy-heavy environments, increasing implementation costs by an estimated 18.0% to 22.0%. For investors and operators, this restraint shifts buying decisions toward vendors with proven interoperability and strong professional services, while delaying adoption among cost-sensitive organizations.
Predictive analytics represents a high-impact opportunity as AIOps matures beyond reactive monitoring. In 2025, platforms increasingly forecast capacity saturation, performance degradation, and incident probability hours or days in advance. You gain the ability to act before outages affect users or revenue. Enterprises using predictive AIOps report up to 35.0% fewer critical incidents annually.
Expansion into Regulated and Mission-Critical Sectors
This capability reshapes investment priorities. Predictive features support proactive planning across cloud spend, infrastructure refresh cycles, and staffing. Analysts project predictive AIOps functions to grow at an estimated CAGR of 29.0% through 2034, outpacing core monitoring modules and opening expansion paths in regulated and mission-critical industries.
Trend:
Hyperautomation Driving Self-Healing IT Operations
Hyperautomation defines the leading trend through 2025. Organizations deploy AIOps to trigger automated remediation and self-healing workflows without human intervention. A global digital commerce provider reduced manual actions by 70.0% and achieved 50.0% faster incident resolution during peak demand using automated response pipelines. You see similar outcomes across telecom and financial services.
Generative AI and Edge Computing Transforming AIOps Delivery
Generative AI also reshapes usability. Embedded assistants translate complex operational data into guided actions, lowering skill barriers and improving adoption. At the same time, edge computing drives demand for localized AIOps processing. As edge workloads expand, real-time analysis near data sources becomes essential, reinforcing AIOps relevance across latency-sensitive applications.
Recent Developments
Dec 2024 – BMC Software, Inc.: BMC announced a major update to its Helix AIOps platform, introducing expanded predictive analytics and automated remediation workflows across hybrid environments. Early customer deployments reported up to 35% reduction in critical incident volume within six months. The move strengthens BMC’s leadership in large enterprise and regulated-sector deployments where reliability and control drive purchasing decisions.
Feb 2025 – ServiceNow, Inc.: ServiceNow expanded its AIOps capabilities within the Now Platform through deeper integration with observability and IT service management modules. The company disclosed that more than 1,800 enterprise customers actively use its AIOps features, representing an estimated 28% year-over-year adoption increase. This expansion reinforces ServiceNow’s position as a platform-centric provider targeting end-to-end digital operations.
Apr 2025 – IBM Corporation: IBM launched new generative AI-assisted features within its Cloud Pak for AIOps, enabling guided root cause analysis and automated runbook execution. The enhancement targets complex hybrid cloud users and supports clients managing over 10 million daily operational events. This development enhances IBM’s competitiveness among enterprises prioritizing AI-driven operational intelligence at scale.
Jul 2025 – Broadcom Inc.: Broadcom announced expanded AIOps functionality across its infrastructure software portfolio, following internal consolidation of observability and network analytics tools. The update supports large telecom and data center clients and is expected to impact over 20,000 enterprise environments globally. This move improves Broadcom’s cross-sell potential and deepens customer lock-in across infrastructure operations.
Sep 2025 – HCL Technologies Limited: HCL introduced an AIOps-driven managed services framework focused on telecom and financial services clients in North America and Europe. The company stated that AIOps-enabled contracts now account for approximately 32% of its infrastructure services pipeline. This initiative strengthens HCL’s positioning as a service-led AIOps provider aligned with outcome-based IT operations models.