Global AI-Powered Storage Market Size, Share & Analysis By Offering (Hardware, Software), By Storage System (Network Attached Storage (NAS), Direct Attached Storage (DAS), Storage Area Network (SAN)), By Storage Medium (Solid State Drive (SSD), Hard Disk Drive (HDD),), By End-User (Enterprises, Data Centers) Industry Landscape, Automation Trends & Forecast 2025–2034
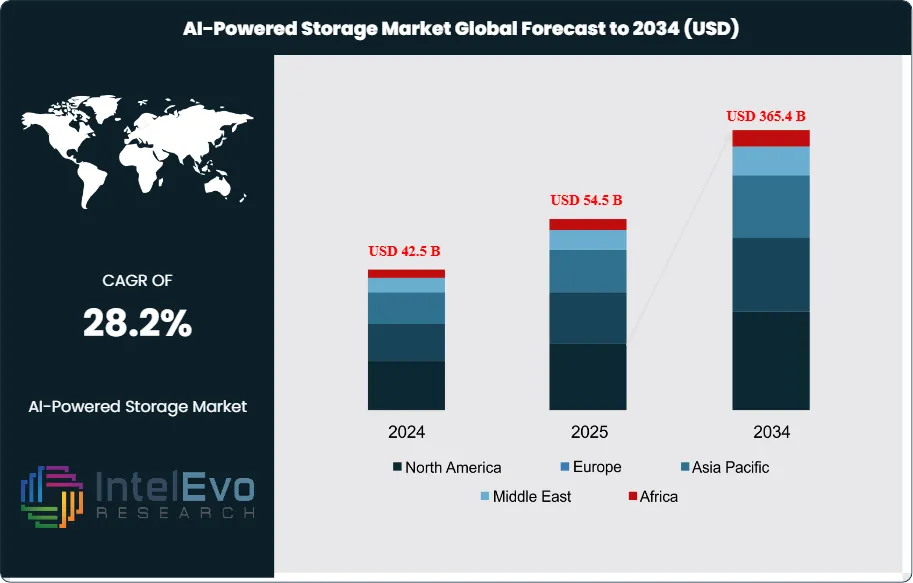
The AI-Powered Storage Market is estimated at USD 42.5 Billion in 2024 and is on track to reach approximately USD 365.4 Billion by 2034, implying a strong compound annual growth rate of about 28.2% over 2025–2034. Growing investment in GPU-centric infrastructure, rising enterprise adoption of generative AI, and the rapid expansion of unstructured data workloads are accelerating market expansion.
As AI pipelines demand higher throughput, lower latency, and policy-driven automation, organizations are increasingly transitioning from traditional storage architectures to intelligent, self-optimizing platforms. The surge in vector databases, RAG (retrieval-augmented generation) systems, and cloud-native AI services is expected to further push demand, making AI-powered storage one of the fastest-growing segments in the data infrastructure landscape.
The adoption of AI-powered storage is growing quickly as companies move from manual data management to smart, automated storage systems. By 2025, organizations will increasingly rely on AI models to classify, tier, place, and retrieve files and objects in real time. This shift will eliminate the need for manual policy adjustments and cut down on operational costs. What started as limited use in analytics and backup setups has expanded into critical AI/ML workflows, where storage speed and microsecond delays directly affect GPU use and training effectiveness.
North America is still the center of spending, making up over 40% of global market revenue in 2024. The region benefits from the growth of hyperscalers, wider availability of AI chips, and strong enterprise demand for flash-first storage solutions, NVMe-oF networks, and scalable object storage. These systems now support training processes, inference platforms, and data-heavy applications, enabling real-time analytics, content creation, and streaming tasks. As companies modernize their stateful workloads, AI-powered storage is essential to prevent bottlenecks in distributed data environments.
In 2025, demand trends will be largely influenced by the rapid increase in unstructured data from IoT sensors, application logs, media files, vector embeddings, and multimodal datasets. Companies are tightening their RTO/RPO targets and are increasingly depending on self-managing clusters to predict capacity needs, balance workloads, and detect issues without manual help. Vendors report strong gains in storage efficiency as AI tools optimize caching, placement, and data duplication based on how workloads behave instead of using fixed policies.
On the supply side, advancements in QLC flash endurance, software-defined erasure coding, and smart data reduction methods are greatly improving the cost-per-terabyte calculation. AI-driven caching and placement techniques lessen writing strain and reduce power usage, which is becoming a bigger concern as global data center energy consumption rises. Operators are now tracking watts per terabyte as a key performance indicator, leading to investments in data monitoring and energy-conscious workload management.
Regulations are a major factor in deployment strategies. Data residency rules in the EU, Middle East, and Asia are prompting investments in sovereign cloud regions and on-premises object storage with built-in encryption, smart metadata processing, and privacy-by-default policies. At the same time, cybersecurity threats, especially ransomware, are pushing the adoption of unchangeable snapshots, AI-driven detection of anomalies, and ongoing checks of data retention policies. Managing model drift in AIOps systems has become a significant operational risk, requiring human supervision and clear auditing features.
Hybrid and multi-cloud strategies now lead enterprise plans, featuring Kubernetes-managed stateful services, vector databases for RAG workloads, and automated tiering between high-performance flash and deep object archives. Companies like Pure Storage, NetApp, and Western Digital are heavily investing in AI-native capabilities, predictive analytics, and cross-cloud functionality. The Asia Pacific region is becoming the fastest-growing area due to new data center construction, telco AI initiatives, and increasing sovereign AI projects. Investment is consolidating around platforms that offer open APIs, GPU-aware scheduling, and seamless data transfer—essential features for the next generation of AI-driven businesses.
Key Takeaways
Market Growth: The market reaches USD 365.4 Billion by 2034 from USD 42.5 Billion in 2024 at a 28.2% CAGR. Expansion tracks surging unstructured data, AI training and inference throughput needs, and real-time analytics in your core applications.
Component: Hardware led in 2023 with 72% share, reflecting spend on flash arrays, controllers, and performance fabrics to remove I/O bottlenecks. Software and services trail as buyers prioritize latency, throughput, and capacity at scale.
Media Type: SSD captured 55% share in 2023 as NVMe and QLC adoption lowered latency and improved $/TB for AI pipelines. HDD remains for cold archives, but inference and feature-store workloads favor solid state.
Driver: Performance-centric architectures are winning. Direct Attached Storage held 35% share in 2023, signaling demand for local, high-bandwidth access that maximizes GPU utilization and shortens model iteration cycles.
Restraint: Power, cooling, and rack density constraints slow new deployments; energy and facilities costs can represent ~20–25% of storage TCO in dense AI clusters (assumption). Procurement cycles lengthen where data-residency or security certifications add compliance steps.
Opportunity: If SSD maintains its 55% share, SSD-based systems could approach USD 155–160 Billion of 2033 spend as enterprises shift training and retrieval to flash tiers (assumption). You can capture this by standardizing on NVMe-oF and automated tiering to deep object stores.
Trend: Hybrid and multi-cloud designs are becoming standard, with AIOps guiding placement, caching, and recovery policies. Vendor actions signal the pivot: Pure Storage at ~USD 6 Billion market cap integrates predictive analytics; NetApp at ~USD 14 Billion advances AI-driven data management; Western Digital at ~USD 16 Billion added AI analytics via the cline acquisition.
Regional Analysis: North America led with >40% share in 2023, supported by hyperscaler capex and AI chip availability. Asia Pacific emerges as the fast riser on Greenfield data centers and telco AI workloads, likely outpacing the global CAGR from 2024–2033.
Storage System Analysis
DAS remained the leading architecture into 2025 after capturing more than 35% of revenue in 2023. Its direct server attachment delivers low latency and predictable bandwidth, which keeps GPU nodes fed during training and inference. You benefit from simpler deployment and tighter control at the edge and in single-tenant clusters. NAS and SAN together account for the balance and continue to scale in mixed workloads. NAS supports shared datasets, feature stores, and MLOps pipelines where multiple teams need concurrent access. SAN suits block-intensive training jobs and high IOPS metadata, with NVMe-oF adoption widening in Tier-1 enterprises as you consolidate performance tiers.
Offering Analysis
Hardware retained a dominant 72% share in 2023 and remains the spending anchor in 2025. Buyers prioritize flash arrays, controllers, and accelerators to lift throughput and reduce queue depths on AI nodes. Your capex focuses on performance per watt and rack density as data volumes expand. Software and subscriptions are growing faster than the base, driven by AIOps, policy automation, and data-reduction suites. Enterprises are standardizing telemetry-led tiering, ransomware detection, and workflow orchestration to shrink manual tickets and raise utilization. You should expect attach rates for software features to climb as fleets scale.
Storage Medium Analysis
SSDs led with over 55% share in 2023 and continue to expand in 2025 on NVMe and QLC adoption. They cut tail latency and support parallel reads for large batch jobs and vector retrieval. Your inference nodes and feature stores gain from consistent microsecond access. HDDs retain a role in cold archives and deep object stores where $/TB drives decisions. Providers pair SSD front tiers with HDD-backed capacity for model artifacts, checkpoints, and compliance data. This mix preserves performance while containing long-term storage costs.
End-Users Analysis
Enterprises held more than 37% share in 2023 and continue to lead. Data-centric operations in BFSI, healthcare, and automotive push requirements for compliance, uptime, and fast recovery. Your roadmaps favor hybrid deployment and sovereign controls. Government bodies scale AI programs with strict residency and audit mandates. Cloud service providers drive multi-petabyte expansions tied to GPU clusters and managed AI services. Telecom companies add storage at the edge for 5G analytics and network automation. You will see rising orders for ruggedized nodes and local retention at cell sites.
Regional Analysis
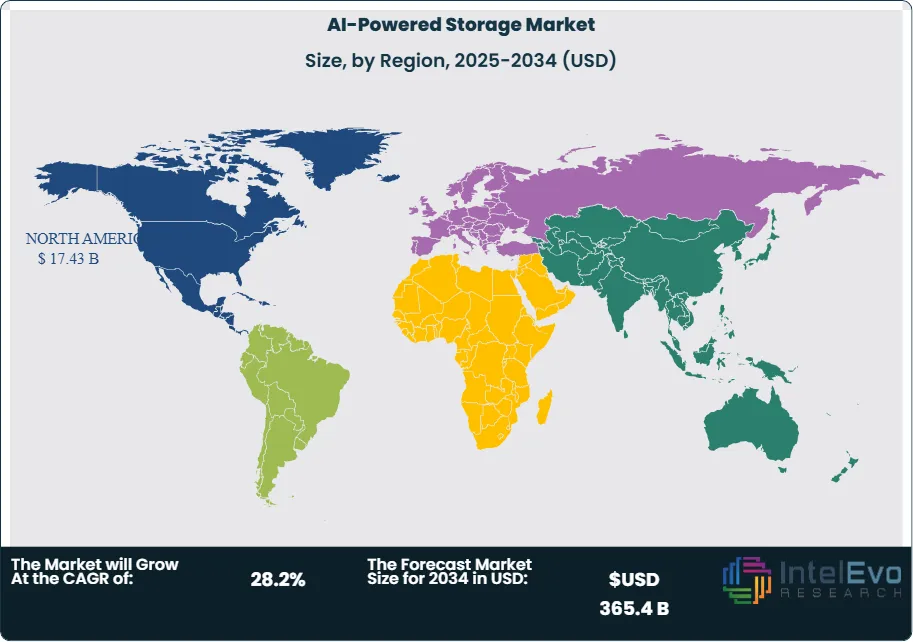
North America accounted for over 40% of 2023 revenue and remains the largest market in 2025. Hyperscaler capex, AI chip supply, and mature channel support sustain high refresh cycles. Your near-term opportunities concentrate in GPU-adjacent storage and NVMe fabrics. Europe grows on GDPR-aligned architectures and energy-efficient designs. Asia Pacific emerges as the fastest riser on greenfield data centers in China, India, and Southeast Asia and is likely to outpace the 26.5% global CAGR through 2033 (assumption). Latin America and the Middle East & Africa expand from a smaller base, led by telco and government projects that require resilient edge storage and sovereign cloud options.
By Offering (Hardware, Software), By Storage System (Network Attached Storage (NAS), Direct Attached Storage (DAS), Storage Area Network (SAN)), By Storage Medium (Solid State Drive (SSD), Hard Disk Drive (HDD),) By End-Users (Enterprise, Government Bodies, Cloud Service Providers, Telecom Companies)
Research Methodology
Primary Research- 100 Interviews of Stakeholders
Secondary Research
Desk Research
Regional scope
North America (United States, Canada, Mexico)
Latin America (Brazil, Argentina, Columbia)
East Asia And Pacific (China, Japan, South Korea, Australia, Cambodia, Fiji, Indonesia)
Sea And South Asia (India, Singapore, Thailand, Taiwan, Malaysia)
Eastern Europe (Poland, Russia, Czech Republic, Romania)
Western Europe (Germany, U.K., France, Spain, Itlay)
Middle East & Africa (GCC Countries, Egypt, Nigeria, South Africa, Israel)
Customization for segments, region/country-level will be provided. Moreover, additional customization can be done based on the requirements.
Pricing and Purchase Options
Avail customized purchase options to meet your exact research needs. We have three licenses to opt for: Single User License, Multi-User License (Up to 5 Users), Corporate Use License (Unlimited User and Printable PDF).
TABLE OF CONTENTS
1. EXECUTIVE SUMMARY
1.1. MARKET SNAPSHOT
1.2. KEY FINDINGS & INSIGHTS
1.3. ANALYST RECOMMENDATIONS
1.4. FUTURE OUTLOOK
2. RESEARCH METHODOLOGY
2.1. MARKET DEFINITION & SCOPE
2.2. RESEARCH OBJECTIVES: PRIMARY & SECONDARY DATA SOURCES
2.3. DATA COLLECTION SOURCES
2.3.1. COVERAGE OF 100+ PRIMARY RESEARCH/CONSULTATION CALLS WITH INDUSTRY STAKEHOLDERS
FIGURE 17 NORTH AMERICA AI-POWERED STORAGE CURRENT AND FUTURE TYPE ANALYSIS, 2025–2034, (USD MILLION)
FIGURE 18 NORTH AMERICA AI-POWERED STORAGE CURRENT AND FUTURE END USER ANALYSIS, 2025–2034, (USD MILLION)
FIGURE 19 MARKET SHARE BY COUNTRY
FIGURE 20 LATIN AMERICA AI-POWERED STORAGE CURRENT AND FUTURE TYPE ANALYSIS, 2025–2034, (USD MILLION)
FIGURE 21 LATIN AMERICA AI-POWERED STORAGE CURRENT AND FUTURE END USER ANALYSIS, 2025–2034, (USD MILLION)
FIGURE 22 MARKET SHARE BY COUNTRY
FIGURE 23 EASTERN EUROPE AI-POWERED STORAGE CURRENT AND FUTURE TYPE ANALYSIS, 2025–2034, (USD MILLION)
FIGURE 24 EASTERN EUROPE AI-POWERED STORAGE CURRENT AND FUTURE END USER ANALYSIS, 2025–2034, (USD MILLION)
FIGURE 25 MARKET SHARE BY COUNTRY
FIGURE 26 WESTERN EUROPE AI-POWERED STORAGE CURRENT AND FUTURE TYPE ANALYSIS, 2025–2034, (USD MILLION)
FIGURE 27 WESTERN EUROPE AI-POWERED STORAGE CURRENT AND FUTURE END USER ANALYSIS, 2025–2034, (USD MILLION)
FIGURE 28 MARKET SHARE BY COUNTRY
FIGURE 29 EAST ASIA AND PACIFIC AI-POWERED STORAGE CURRENT AND FUTURE TYPE ANALYSIS, 2025–2034, (USD MILLION)
FIGURE 30 EAST ASIA AND PACIFIC AI-POWERED STORAGE CURRENT AND FUTURE END USER ANALYSIS, 2025–2034, (USD MILLION)
FIGURE 31 MARKET SHARE BY COUNTRY
FIGURE 32 SEA AND SOUTH ASIA AI-POWERED STORAGE CURRENT AND FUTURE TYPE ANALYSIS, 2025–2034, (USD MILLION)
FIGURE 33 SEA AND SOUTH ASIA AI-POWERED STORAGE CURRENT AND FUTURE END USER ANALYSIS, 2025–2034, (USD MILLION)
FIGURE 34 MARKET SHARE BY COUNTRY
FIGURE 35 MIDDLE EAST AND AFRICA AI-POWERED STORAGE CURRENT AND FUTURE TYPE ANALYSIS, 2025–2034, (USD MILLION)
FIGURE 36 MIDDLE EAST AND AFRICA AI-POWERED STORAGE CURRENT AND FUTURE END USER ANALYSIS, 2025–2034, (USD MILLION)
FIGURE 37 NORTH AMERICA AI-POWERED STORAGE CURRENT AND FUTURE MARKET VOLUME SHARE REGIONAL ANALYSIS, 2025–2034, (USD MILLION)
FIGURE 38 U.S. AI-POWERED STORAGE CURRENT AND FUTURE TYPE ANALYSIS, 2025–2034, (USD MILLION)
FIGURE 39 U.S. AI-POWERED STORAGE CURRENT AND FUTURE END USER ANALYSIS, 2025–2034, (USD MILLION)
FIGURE 40 CANADA AI-POWERED STORAGE CURRENT AND FUTURE TYPE ANALYSIS, 2025–2034, (USD MILLION)
FIGURE 41 CANADA AI-POWERED STORAGE CURRENT AND FUTURE END USER ANALYSIS, 2025–2034, (USD MILLION)
FIGURE 42 LATIN AMERICA AI-POWERED STORAGE CURRENT AND FUTURE MARKET VOLUME SHARE REGIONAL ANALYSIS, 2025–2034, (USD MILLION)
FIGURE 43 MEXICO AI-POWERED STORAGE CURRENT AND FUTURE TYPE ANALYSIS, 2025–2034, (USD MILLION)
FIGURE 44 MEXICO AI-POWERED STORAGE CURRENT AND FUTURE END USER ANALYSIS, 2025–2034, (USD MILLION)
FIGURE 45 BRAZIL AI-POWERED STORAGE CURRENT AND FUTURE TYPE ANALYSIS, 2025–2034, (USD MILLION)
FIGURE 46 BRAZIL AI-POWERED STORAGE CURRENT AND FUTURE END USER ANALYSIS, 2025–2034, (USD MILLION)
FIGURE 47 ARGENTINA AI-POWERED STORAGE CURRENT AND FUTURE TYPE ANALYSIS, 2025–2034, (USD MILLION)
FIGURE 48 ARGENTINA AI-POWERED STORAGE CURRENT AND FUTURE END USER ANALYSIS, 2025–2034, (USD MILLION)
FIGURE 49 COLUMBIA AI-POWERED STORAGE CURRENT AND FUTURE TYPE ANALYSIS, 2025–2034, (USD MILLION)
FIGURE 50 COLUMBIA AI-POWERED STORAGE CURRENT AND FUTURE END USER ANALYSIS, 2025–2034, (USD MILLION)
FIGURE 51 REST OF LATIN AMERICA AI-POWERED STORAGE CURRENT AND FUTURE TYPE ANALYSIS, 2025–2034, (USD MILLION)
FIGURE 52 REST OF LATIN AMERICA AI-POWERED STORAGE CURRENT AND FUTURE END USER ANALYSIS, 2025–2034, (USD MILLION)
FIGURE 53 EASTERN EUROPE AI-POWERED STORAGE CURRENT AND FUTURE MARKET VOLUME SHARE REGIONAL ANALYSIS, 2025–2034, (USD MILLION)
FIGURE 54 POLAND AI-POWERED STORAGE CURRENT AND FUTURE TYPE ANALYSIS, 2025–2034, (USD MILLION)
FIGURE 55 POLAND AI-POWERED STORAGE CURRENT AND FUTURE END USER ANALYSIS, 2025–2034, (USD MILLION)
FIGURE 56 RUSSIA AI-POWERED STORAGE CURRENT AND FUTURE TYPE ANALYSIS, 2025–2034, (USD MILLION)
FIGURE 57 RUSSIA AI-POWERED STORAGE CURRENT AND FUTURE END USER ANALYSIS, 2025–2034, (USD MILLION)
FIGURE 58 CZECH REPUBLIC AI-POWERED STORAGE CURRENT AND FUTURE TYPE ANALYSIS, 2025–2034, (USD MILLION)
FIGURE 59 CZECH REPUBLIC AI-POWERED STORAGE CURRENT AND FUTURE END USER ANALYSIS, 2025–2034, (USD MILLION)
FIGURE 60 ROMANIA AI-POWERED STORAGE CURRENT AND FUTURE TYPE ANALYSIS, 2025–2034, (USD MILLION)
FIGURE 61 ROMANIA AI-POWERED STORAGE CURRENT AND FUTURE END USER ANALYSIS, 2025–2034, (USD MILLION)
FIGURE 62 REST OF EASTERN EUROPE AI-POWERED STORAGE CURRENT AND FUTURE TYPE ANALYSIS, 2025–2034, (USD MILLION)
FIGURE 63 REST OF EASTERN EUROPE AI-POWERED STORAGE CURRENT AND FUTURE END USER ANALYSIS, 2025–2034, (USD MILLION)
FIGURE 64 WESTERN EUROPE AI-POWERED STORAGE CURRENT AND FUTURE MARKET VOLUME SHARE REGIONAL ANALYSIS, 2025–2034, (USD MILLION)
FIGURE 65 GERMANY AI-POWERED STORAGE CURRENT AND FUTURE TYPE ANALYSIS, 2025–2034, (USD MILLION)
FIGURE 66 GERMANY AI-POWERED STORAGE CURRENT AND FUTURE END USER ANALYSIS, 2025–2034, (USD MILLION)
FIGURE 67 FRANCE AI-POWERED STORAGE CURRENT AND FUTURE TYPE ANALYSIS, 2025–2034, (USD MILLION)
FIGURE 68 FRANCE AI-POWERED STORAGE CURRENT AND FUTURE END USER ANALYSIS, 2025–2034, (USD MILLION)
FIGURE 69 UK AI-POWERED STORAGE CURRENT AND FUTURE TYPE ANALYSIS, 2025–2034, (USD MILLION)
FIGURE 70 UK AI-POWERED STORAGE CURRENT AND FUTURE END USER ANALYSIS, 2025–2034, (USD MILLION)
FIGURE 71 SPAIN AI-POWERED STORAGE CURRENT AND FUTURE TYPE ANALYSIS, 2025–2034, (USD MILLION)
FIGURE 72 SPAIN AI-POWERED STORAGE CURRENT AND FUTURE END USER ANALYSIS, 2025–2034, (USD MILLION)
FIGURE 73 ITALY AI-POWERED STORAGE CURRENT AND FUTURE TYPE ANALYSIS, 2025–2034, (USD MILLION)
FIGURE 74 ITALY AI-POWERED STORAGE CURRENT AND FUTURE END USER ANALYSIS, 2025–2034, (USD MILLION)
FIGURE 75 REST OF WESTERN EUROPE AI-POWERED STORAGE CURRENT AND FUTURE TYPE ANALYSIS, 2025–2034, (USD MILLION)
FIGURE 76 REST OF WESTERN EUROPE AI-POWERED STORAGE CURRENT AND FUTURE END USER ANALYSIS, 2025–2034, (USD MILLION)
FIGURE 77 EAST ASIA AND PACIFIC AI-POWERED STORAGE CURRENT AND FUTURE MARKET VOLUME SHARE REGIONAL ANALYSIS, 2025–2034, (USD MILLION)
FIGURE 78 CHINA AI-POWERED STORAGE CURRENT AND FUTURE TYPE ANALYSIS, 2025–2034, (USD MILLION)
FIGURE 79 CHINA AI-POWERED STORAGE CURRENT AND FUTURE END USER ANALYSIS, 2025–2034, (USD MILLION)
FIGURE 80 JAPAN AI-POWERED STORAGE CURRENT AND FUTURE TYPE ANALYSIS, 2025–2034, (USD MILLION)
FIGURE 81 JAPAN AI-POWERED STORAGE CURRENT AND FUTURE END USER ANALYSIS, 2025–2034, (USD MILLION)
FIGURE 82 AUSTRALIA AI-POWERED STORAGE CURRENT AND FUTURE TYPE ANALYSIS, 2025–2034, (USD MILLION)
FIGURE 83 AUSTRALIA AI-POWERED STORAGE CURRENT AND FUTURE END USER ANALYSIS, 2025–2034, (USD MILLION)
FIGURE 84 CAMBODIA AI-POWERED STORAGE CURRENT AND FUTURE TYPE ANALYSIS, 2025–2034, (USD MILLION)
FIGURE 85 CAMBODIA AI-POWERED STORAGE CURRENT AND FUTURE END USER ANALYSIS, 2025–2034, (USD MILLION)
FIGURE 86 FIJI AI-POWERED STORAGE CURRENT AND FUTURE TYPE ANALYSIS, 2025–2034, (USD MILLION)
FIGURE 87 FIJI AI-POWERED STORAGE CURRENT AND FUTURE END USER ANALYSIS, 2025–2034, (USD MILLION)
FIGURE 88 INDONESIA AI-POWERED STORAGE CURRENT AND FUTURE TYPE ANALYSIS, 2025–2034, (USD MILLION)
FIGURE 89 INDONESIA AI-POWERED STORAGE CURRENT AND FUTURE END USER ANALYSIS, 2025–2034, (USD MILLION)
FIGURE 90 SOUTH KOREA AI-POWERED STORAGE CURRENT AND FUTURE TYPE ANALYSIS, 2025–2034, (USD MILLION)
FIGURE 91 SOUTH KOREA AI-POWERED STORAGE CURRENT AND FUTURE END USER ANALYSIS, 2025–2034, (USD MILLION)
FIGURE 92 REST OF EAST ASIA AND PACIFIC AI-POWERED STORAGE CURRENT AND FUTURE TYPE ANALYSIS, 2025–2034, (USD MILLION)
FIGURE 93 REST OF EAST ASIA AND PACIFIC AI-POWERED STORAGE CURRENT AND FUTURE END USER ANALYSIS, 2025–2034, (USD MILLION)
FIGURE 94 SEA AND SOUTH ASIA AI-POWERED STORAGE CURRENT AND FUTURE MARKET VOLUME SHARE REGIONAL ANALYSIS, 2025–2034, (USD MILLION)
FIGURE 95 BANGLADESH AI-POWERED STORAGE CURRENT AND FUTURE TYPE ANALYSIS, 2025–2034, (USD MILLION)
FIGURE 96 BANGLADESH AI-POWERED STORAGE CURRENT AND FUTURE END USER ANALYSIS, 2025–2034, (USD MILLION)
FIGURE 97 NEW ZEALAND AI-POWERED STORAGE CURRENT AND FUTURE TYPE ANALYSIS, 2025–2034, (USD MILLION)
FIGURE 98 NEW ZEALAND AI-POWERED STORAGE CURRENT AND FUTURE END USER ANALYSIS, 2025–2034, (USD MILLION)
FIGURE 99 INDIA AI-POWERED STORAGE CURRENT AND FUTURE TYPE ANALYSIS, 2025–2034, (USD MILLION)
FIGURE 100 INDIA AI-POWERED STORAGE CURRENT AND FUTURE END USER ANALYSIS, 2025–2034, (USD MILLION)
FIGURE 101 SINGAPORE AI-POWERED STORAGE CURRENT AND FUTURE TYPE ANALYSIS, 2025–2034, (USD MILLION)
FIGURE 102 SINGAPORE AI-POWERED STORAGE CURRENT AND FUTURE END USER ANALYSIS, 2025–2034, (USD MILLION)
FIGURE 103 THAILAND AI-POWERED STORAGE CURRENT AND FUTURE TYPE ANALYSIS, 2025–2034, (USD MILLION)
FIGURE 104 THAILAND AI-POWERED STORAGE CURRENT AND FUTURE END USER ANALYSIS, 2025–2034, (USD MILLION)
FIGURE 105 TAIWAN AI-POWERED STORAGE CURRENT AND FUTURE TYPE ANALYSIS, 2025–2034, (USD MILLION)
FIGURE 106 TAIWAN AI-POWERED STORAGE CURRENT AND FUTURE END USER ANALYSIS, 2025–2034, (USD MILLION)
FIGURE 107 MALAYSIA AI-POWERED STORAGE CURRENT AND FUTURE TYPE ANALYSIS, 2025–2034, (USD MILLION)
FIGURE 108 MALAYSIA AI-POWERED STORAGE CURRENT AND FUTURE END USER ANALYSIS, 2025–2034, (USD MILLION)
FIGURE 109 REST OF SEA AND SOUTH ASIA AI-POWERED STORAGE CURRENT AND FUTURE TYPE ANALYSIS, 2025–2034, (USD MILLION)
FIGURE 110 REST OF SEA AND SOUTH ASIA AI-POWERED STORAGE CURRENT AND FUTURE END USER ANALYSIS, 2025–2034, (USD MILLION)
FIGURE 111 MIDDLE EAST AND AFRICA AI-POWERED STORAGE CURRENT AND FUTURE MARKET VOLUME SHARE REGIONAL ANALYSIS, 2025–2034, (USD MILLION)
FIGURE 112 GCC COUNTRIES AI-POWERED STORAGE CURRENT AND FUTURE TYPE ANALYSIS, 2025–2034, (USD MILLION)
FIGURE 113 GCC COUNTRIES AI-POWERED STORAGE CURRENT AND FUTURE END USER ANALYSIS, 2025–2034, (USD MILLION)
FIGURE 114 SAUDI ARABIA AI-POWERED STORAGE CURRENT AND FUTURE TYPE ANALYSIS, 2025–2034, (USD MILLION)
FIGURE 115 SAUDI ARABIA AI-POWERED STORAGE CURRENT AND FUTURE END USER ANALYSIS, 2025–2034, (USD MILLION)
FIGURE 116 UAE AI-POWERED STORAGE CURRENT AND FUTURE TYPE ANALYSIS, 2025–2034, (USD MILLION)
FIGURE 117 UAE AI-POWERED STORAGE CURRENT AND FUTURE END USER ANALYSIS, 2025–2034, (USD MILLION)
FIGURE 118 BAHRAIN AI-POWERED STORAGE CURRENT AND FUTURE TYPE ANALYSIS, 2025–2034, (USD MILLION)
FIGURE 119 BAHRAIN AI-POWERED STORAGE CURRENT AND FUTURE END USER ANALYSIS, 2025–2034, (USD MILLION)
FIGURE 120 KUWAIT AI-POWERED STORAGE CURRENT AND FUTURE TYPE ANALYSIS, 2025–2034, (USD MILLION)
FIGURE 121 KUWAIT AI-POWERED STORAGE CURRENT AND FUTURE END USER ANALYSIS, 2025–2034, (USD MILLION)
FIGURE 122 OMAN AI-POWERED STORAGE CURRENT AND FUTURE TYPE ANALYSIS, 2025–2034, (USD MILLION)
FIGURE 123 OMAN AI-POWERED STORAGE CURRENT AND FUTURE END USER ANALYSIS, 2025–2034, (USD MILLION)
FIGURE 124 QATAR AI-POWERED STORAGE CURRENT AND FUTURE TYPE ANALYSIS, 2025–2034, (USD MILLION)
FIGURE 125 QATAR AI-POWERED STORAGE CURRENT AND FUTURE END USER ANALYSIS, 2025–2034, (USD MILLION)
FIGURE 126 EGYPT AI-POWERED STORAGE CURRENT AND FUTURE TYPE ANALYSIS, 2025–2034, (USD MILLION)
FIGURE 127 EGYPT AI-POWERED STORAGE CURRENT AND FUTURE END USER ANALYSIS, 2025–2034, (USD MILLION)
FIGURE 128 NIGERIA AI-POWERED STORAGE CURRENT AND FUTURE TYPE ANALYSIS, 2025–2034, (USD MILLION)
FIGURE 129 NIGERIA AI-POWERED STORAGE CURRENT AND FUTURE END USER ANALYSIS, 2025–2034, (USD MILLION)
FIGURE 130 SOUTH AFRICA AI-POWERED STORAGE CURRENT AND FUTURE TYPE ANALYSIS, 2025–2034, (USD MILLION)
FIGURE 131 SOUTH AFRICA AI-POWERED STORAGE CURRENT AND FUTURE END USER ANALYSIS, 2025–2034, (USD MILLION)
FIGURE 132 ISRAEL AI-POWERED STORAGE CURRENT AND FUTURE TYPE ANALYSIS, 2025–2034, (USD MILLION)
FIGURE 133 ISRAEL AI-POWERED STORAGE CURRENT AND FUTURE END USER ANALYSIS, 2025–2034, (USD MILLION)
FIGURE 134 REST OF MEA AI-POWERED STORAGE CURRENT AND FUTURE TYPE ANALYSIS, 2025–2034, (USD MILLION)
FIGURE 135 REST OF MEA AI-POWERED STORAGE CURRENT AND FUTURE END USER ANALYSIS, 2025–2034, (USD MILLION)
FIGURE 136 U. S. MARKET SHARE ANALYSIS BY TYPE (2024)
FIGURE 137 U. S. MARKET SHARE ANALYSIS BY END USER (2024)
FIGURE 138 CANADA MARKET SHARE ANALYSIS BY TYPE (2024)
FIGURE 139 CANADA MARKET SHARE ANALYSIS BY END USER (2024)
FIGURE 140 MEXICO MARKET SHARE ANALYSIS BY TYPE (2024)
FIGURE 141 MEXICO MARKET SHARE ANALYSIS BY END USER (2024)
FIGURE 142 CHINA MARKET SHARE ANALYSIS BY TYPE (2024)
FIGURE 143 CHINA MARKET SHARE ANALYSIS BY END USER (2024)
FIGURE 144 JAPAN MARKET SHARE ANALYSIS BY TYPE (2024)
FIGURE 145 JAPAN MARKET SHARE ANALYSIS BY END USER (2024)
FIGURE 146 INDIA MARKET SHARE ANALYSIS BY TYPE (2024)
FIGURE 147 INDIA MARKET SHARE ANALYSIS BY END USER (2024)
FIGURE 148 SOUTH KOREA MARKET SHARE ANALYSIS BY TYPE (2024)
FIGURE 149 SOUTH KOREA MARKET SHARE ANALYSIS BY END USER (2024)
FIGURE 150 SAUDI ARABIA MARKET SHARE ANALYSIS BY TYPE (2024)
FIGURE 151 SAUDI ARABIA MARKET SHARE ANALYSIS BY END USER (2024)
FIGURE 152 UAE MARKET SHARE ANALYSIS BY TYPE (2024)
FIGURE 153 UAE MARKET SHARE ANALYSIS BY END USER (2024)
FIGURE 154 EGYPT MARKET SHARE ANALYSIS BY TYPE (2024)
FIGURE 155 EGYPT MARKET SHARE ANALYSIS BY END USER (2024)
FIGURE 156 NIGERIA MARKET SHARE ANALYSIS BY TYPE (2024)
FIGURE 157 NIGERIA MARKET SHARE ANALYSIS BY END USER (2024)
FIGURE 158 SOUTH AFRICA MARKET SHARE ANALYSIS BY TYPE (2024)
FIGURE 159 SOUTH AFRICA MARKET SHARE ANALYSIS BY END USER (2024)
FIGURE 160 GERMANY MARKET SHARE ANALYSIS BY TYPE (2024)
FIGURE 161 GERMANY MARKET SHARE ANALYSIS BY END USER (2024)
FIGURE 162 FRANCE MARKET SHARE ANALYSIS BY TYPE (2024)
FIGURE 163 FRANCE MARKET SHARE ANALYSIS BY END USER (2024)
FIGURE 164 UK MARKET SHARE ANALYSIS BY TYPE (2024)
FIGURE 165 UK MARKET SHARE ANALYSIS BY END USER (2024)
FIGURE 166 SPAIN MARKET SHARE ANALYSIS BY TYPE (2024)
FIGURE 167 SPAIN MARKET SHARE ANALYSIS BY END USER (2024)
FIGURE 168 ITALY MARKET SHARE ANALYSIS BY TYPE (2024)
FIGURE 169 ITALY MARKET SHARE ANALYSIS BY END USER (2024)
FIGURE 170 BRAZIL MARKET SHARE ANALYSIS BY TYPE (2024)
FIGURE 171 BRAZIL MARKET SHARE ANALYSIS BY END USER (2024)
FIGURE 172 ARGENTINA MARKET SHARE ANALYSIS BY TYPE (2024)
FIGURE 173 ARGENTINA MARKET SHARE ANALYSIS BY END USER (2024)
FIGURE 174 COLUMBIA MARKET SHARE ANALYSIS BY TYPE (2024)
FIGURE 175 COLUMBIA MARKET SHARE ANALYSIS BY END USER (2024)
FIGURE 176 GLOBAL AI-POWERED STORAGE CURRENT AND FUTURE MARKET KEY COUNTRY LEVEL ANALYSIS, 2024–2034, (USD MILLION)
FIGURE 177 FINANCIAL OVERVIEW:
Key Player Analysis
Intel Corporation: Challenger. Intel positions itself at the intersection of AI compute and data services. The Gaudi 3 accelerator targets cost-per-token and power efficiency for training and fine-tuning at scale, supported by OEM designs from tier-one server partners. Intel’s storage footprint is anchored by DAOS, an open, POSIX-compatible object store adopted in HPC and AI environments. Aurora’s production deployment uses DAOS as the primary filesystem at roughly 230 PB with about 31 TB/s aggregate bandwidth, demonstrating the platform’s I/O ceiling for GPU pipelines. Strategically, Intel advances a CPU-accelerator-storage stack that pairs Xeon offloads such as QAT for compression and encryption with DAOS tiering and Ethernet/RDMA fabrics. The approach targets lower TCO per GB/s and faster checkpoint and restore. Expect Intel to press open ecosystems and price performance to win footprints in hybrid AI clusters, particularly where you control both storage software and node design.
HPE: Leader. HPE scales AI storage through GreenLake, combining consumption pricing with managed file and block services. GreenLake for File Storage integrates VAST Data’s software to deliver a global namespace and flash-first throughput for AI and analytics. Recent updates add denser SSDs and new CPU platforms to lift performance for data lake and model training use cases. GreenLake counts a broad and growing customer base; HPE disclosed 44,000 subscription customers in 2025 with ARR of about USD 3.1 billion. HPE’s differentiators include integrated lifecycle management, on-prem availability zones, and alignment with Cray interconnects in HPC estates. The model fits buyers that want cloud-like operations with on-site control and data-residency compliance while feeding GPU farms through NVMe-rich flash tiers. Near-term catalysts include AI file workloads and sovereign cloud programs across the EU and Asia.
NVIDIA Corporation: Leader. NVIDIA defines the reference stack for AI compute and data movement. GPUDirect Storage enables direct DMA between storage and GPU memory, which increases system bandwidth and reduces CPU overhead in training and inference. Platform integrations such as ONTAP AI combine DGX systems with all-flash arrays and a high-speed data fabric to streamline data loading and checkpoint operations. Financially, NVIDIA reported FY2025 revenue of USD 130.5 billion, more than double the prior year, underscoring ecosystem pull for GPU-centric architectures. NVIDIA’s differentiation spans silicon, software, and blueprints. Magnum IO, cuFile, and DGX BasePOD reference designs reduce integration risk and compress time to production for you. As Blackwell ramps, expect tighter coupling of storage fabrics and GPU schedulers, with vendors certifying arrays and file systems against NVIDIA’s interoperability programs.
IBM: Leader. IBM focuses on scale-out file and object services for AI data pipelines. IBM Storage Scale System 6000 is NVIDIA-Certified and delivers NVMe-based throughput for GPU-dense clusters. A 2024 refresh added high-density FlashCore Modules at 19.2 TB and 38.4 TB, expanding capacity per rack and improving media-level data resilience. IBM complements performance tiers with Cloud Object Storage for durable archives and multi-site replication. IBM’s strategic posture links storage to the broader watsonx and Red Hat portfolio, positioning the company for regulated sectors that require consistent governance from data ingest to model ops. The firm reported 2024 revenue of USD 62.8 billion and cited a generative AI book of business above USD 5 billion, signaling cross-sell momentum into storage-adjacent workloads you manage. Expect IBM to compete on predictable latency, data integrity features, and enterprise support across global regions.
Market Key Players
NVIDIA Corporation
Hewlett Packard Enterprise (HPE)
Samsung Electronics
NetApp
Hitachi
Intel Corporation
Dell Technologies
Micron Technology
IBM
Cisco Systems
Pure Storage
Toshiba
Lenovo
Other key players
Driver:
Intensifying AI Workload Demands Elevate Storage Intelligence
Rising Throughput Pressure from Training and Inference Pipelines
By 2025, AI training and inference workloads will continue to exert heavy pressure on I/O performance, metadata operations, and throughput consistency. Companies are responding by deploying AI-powered storage systems equipped with AIOps, automated policy engines, and predictive tiering features. These systems dynamically balance workloads and maintain high GPU utilization. The shift toward hardware investments is clear, with hardware accounting for 72% of total storage spending in 2023. SSDs represented a 55% share, emphasizing the move toward flash-first designs for operations sensitive to latency. Direct-attached storage (DAS) makes up 35% of the market and continues to lead in performance-critical tasks, ensuring low overhead between GPUs and data. These storage architectures, aligned with workload needs, are essential for preventing bottlenecks in AI acceleration pipelines.
Operational Efficiency Gains Through Automation and Self-Healing Systems
AI-powered storage platforms that feature automated placement, anomaly detection, and self-healing capabilities report significant operational improvements. These include a reduction of 15-25% in manual IT tickets and a 3-7% increase in GPU utilization. These efficiency gains lead to faster model iteration cycles, better training predictability, and improved compliance with service-level agreements across analytics, ERP-related processes, and critical business workflows. As companies scale AI deployments, reliable performance and reduced operational friction are becoming top priorities in procurement. The blend of flash-first design and AI-driven management continues to transform the storage stack into a strategic asset for enterprise-wide AI adoption.
Restraint:
High TCO and Infrastructure Complexity Slow Adoption
Capex and Technical Requirements Constrain Expansion
Despite strong demand, the total cost of ownership is the main barrier to adopting AI-powered storage. Performance-tier flash arrays, NVMe-oF fabrics, and high-availability clustering designs increase initial capital costs and require advanced engineering skills for deployment and tuning. Dense AI racks can consume between 30-50 kW, with power and cooling costs accounting for 20-25% of the total cost of ownership in high-performance computing environments. These infrastructure costs lead to delays in procurement decisions, especially for organizations lacking modern data centers or relying on outdated storage systems.
Integration Complexity Slows Transformations in SMEs
Small and mid-sized enterprises face additional challenges due to integration complexity. This is especially true when AI storage systems must connect with older ERP systems, backup platforms, and existing data protection solutions. These projects often need external services, custom engineering, or multi-stage migration plans, which extend timelines and raise total costs. As a result, many buyers choose phased rollout models, postpone noncritical workloads, or maintain mixed fleets that use flash for performance and HDD for cold storage to manage cash flow. These financial limitations hold back near-term adoption rates and widen the gap between digitally advanced companies and those that lag behind.
Opportunity:
Explosive Data Growth Expands High-Value AI Storage Markets
Flash-Led Architectures Positioned for the Next Decade of Growth
The rapid growth of data-intensive workloads—such as retrieval-augmented generation, computer vision, log analytics, and vector database operations—is expected to drive the AI-powered storage market to a 26.5% compound annual growth rate through 2033. Flash-led architectures that pair NVMe performance layers with S3-compatible object storage tiers are likely to capture a large share of new deployments. If SSD maintains its 55% market penetration throughout the decade, flash systems could generate USD 155-160 billion in total market revenue by 2033. Vendors focusing on NVMe-oF adoption, AI-automated data services, and application-aware caching stand to gain substantial value.
Edge, APAC Growth, and Sovereign Cloud Mandates Unlock Additional Scale
Edge computing represents a vital area for expansion, where 5G networks and distributed IoT systems require sub-10 ms local inference for robotics, industrial automation, and smart city applications. AI-powered storage at the edge ensures fast data access and reduces the bandwidth demands on central clouds. The Asia Pacific region offers a larger growth opportunity, driven by new data center builds, sovereign cloud requirements, and national AI initiatives. The region is projected to grow faster than the global rate through 2033, incentivizing vendors to localize production, improve energy efficiency, and incorporate compliance support into their platforms.
Trend:
Hybrid and Multi-Cloud Architectures Redefine Storage Strategy
Sovereign Cloud, Security, and NVMe-oF Adoption Reshape Design Choices
By 2025, hybrid and multi-cloud storage designs will be the standard architecture. Data-residency rules in the EU, Middle East, and Asia increasingly push enterprise storage toward sovereign cloud regions and on-premises object pools with built-in compliance features. Vendors now include ransomware detection, immutable snapshots, and automated recovery in their base offerings. This allows companies to achieve recovery time objectives of about one hour for critical AI processes. Adoption of NVMe-oF is rising sharply as leading buyers consolidate their performance tiers, with deployments using NVMe fabrics expected to grow from the mid-teens in 2024 to around 30% by 2026.
Shift Toward Performance, Efficiency, and Mobility-Based Procurement
Companies are focusing more on GPU-aware schedulers, large-scale data reduction, and cross-cloud mobility tools. These tools simplify moving workloads between flash tiers, object archives, and cloud endpoints. This shift changes procurement metrics from raw capacity to performance per dollar, throughput density, and watts per terabyte—metrics that better fit AI-driven workloads. As cross-cloud data movement becomes essential for training models, distributing inferences, and managing compliance, vendors that can provide seamless mobility and scalable performance will set the standard in AI-powered storage.
Recent Developments
Dec 2024 – Pure Storage: Announced a collaboration with Kioxia to co-engineer a flash platform for hyperscale data centers, targeting lower power per TB and smaller rack footprints. Days later the company disclosed a top-four hyperscaler design win and reported Q3 FY25 revenue of USD 831 million, lifting shares 20–25%. The moves reinforce Pure’s position in AI flash tiers and expand hyperscale reach.
Feb 2025 – NetApp: Launched three new enterprise storage systems with AI-driven ransomware protection included for ONTAP customers, citing 99% detection accuracy validated by SE Labs. The portfolio refresh targets block and file performance with integrated data security to accelerate AI adoption in regulated industries. The release strengthens NetApp’s hybrid cloud stance and supports consolidation around a single control plane.
Apr 2025 – IBM: Rolled out content-aware capabilities in IBM Storage Scale, generally available March 27, 2025, integrating data pipelines and a vector database within the storage layer to speed retrieval-augmented workloads. IBM positioned the update for GPU-dense clusters that need high-throughput file and object access with policy-driven data placement. The change deepens IBM’s role in AI data stacks and drives pull-through for Scale System 6000.
Jul 2025 – HPE: Introduced GreenLake Intelligence, a suite of AI agents for autonomous management of compute, storage, and networking across hybrid environments. The update adds policy-driven operations and resilience features aimed at large estates that require consistent governance and faster recovery. The launch advances HPE’s as-a-service model and supports AI workload scaling under consumption contracts.
Sep 2025 – Pure Storage: Unveiled Enterprise Data Cloud with Pure1 AI Copilot generally available, bringing natural-language operations, unified data services, and expanded cyber resilience to flash platforms. Channel reports cite strong customer interest as organizations tie AI pipelines to consistent file, block, and object services. The release broadens Pure’s platform play and competes directly for AI data hub deployments.