AI Text-to-Image Generator Market Size | Growth & 15.3% CAGR
Global AI Text-to-Image Generator Market Size, Share & Analysis By Technology (Diffusion Models, GANs, Transformer-Based AI), By Application (Marketing, Gaming, Design, Media & Entertainment), By End-User (Enterprises, Creators, Agencies) Industry Outlook, Ethical AI Trends, Competitive Strategies & Forecast 2025–2034
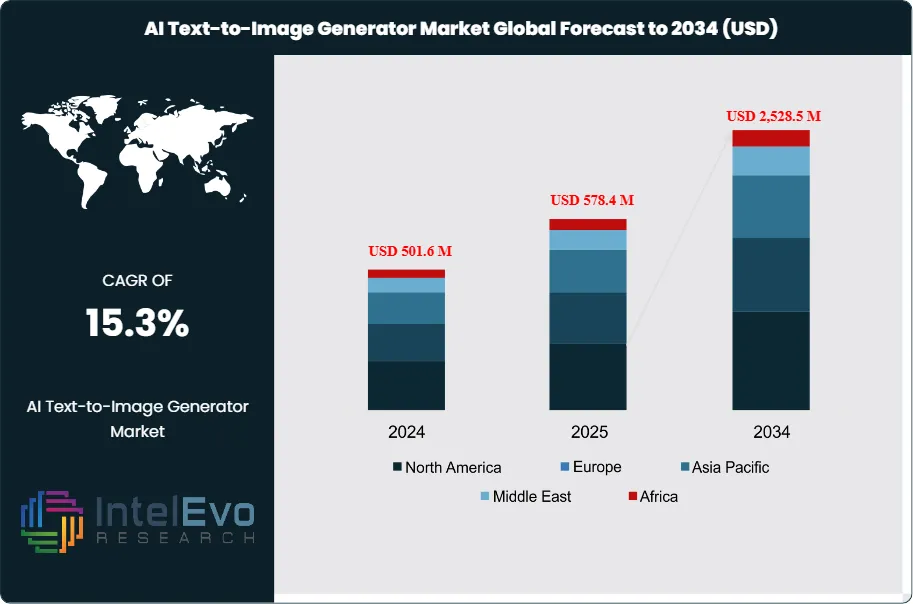
The AI Text-to-Image Generator Market is estimated at USD 501.6 million in 2024 and is on track to reach roughly USD 2,528.5 million by 2034, implying a compound annual growth rate of 15.3% over 2025–2034. The market originated as a niche research area in the late 2010s and transitioned to commercial adoption between 2021 and 2023 as diffusion models advanced and large-scale compute reduced per-image generation costs.
Adoption accelerated significantly in 2024 as model reliability improved and cloud economics shifted in favor of rapid experimentation. Enterprises that once required weeks to test model deployments now complete evaluations in a matter of hours. Demand is heavily concentrated in digital media, advertising, and entertainment, where high-volume asset creation is critical. Companies report notable production cost reductions after replacing manual mockups with generator-assisted concept drafts.
Supply-side improvements further strengthened uptake. Latency reductions and higher native resolution outputs—delivered through major model updates in 2023 and 2024—enhanced enterprise usability by shortening generation times and improving quality. Commercial enablers also played a role: Google Cloud offered USD 300 in credits for Vertex AI experimentation, and Appy Pie introduced a new image generator in April 2024, expanding accessibility for nontechnical users. Adoption indicators remain strong, with the AI image editor segment reaching USD 80.4 million and G2 category engagements rising 44.1% year over year.
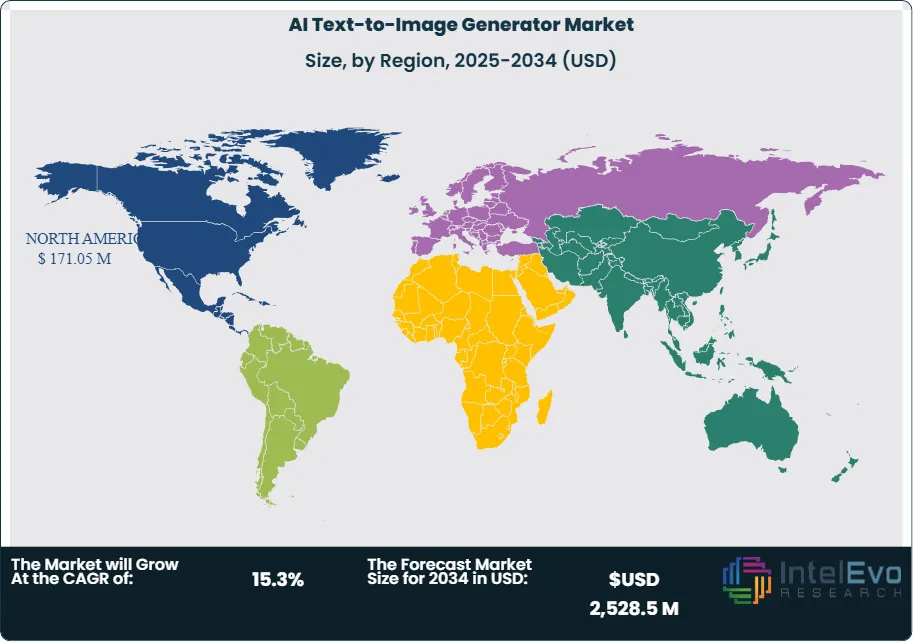
Regional dynamics vary considerably. North America led the market in 2024 with more than 34.1% share, generating USD 171.05 million in revenue—driven by concentrated investor activity and strong demand from ad tech and entertainment ecosystems. Europe shows rigorous regulatory oversight, increasing compliance complexity but providing clearer licensing frameworks. Meanwhile, Asia Pacific is moving rapidly through commercial trials in gaming and e-commerce, enabled by fewer regulatory barriers and high experimentation appetite.
Despite momentum, challenges remain. Intellectual property uncertainties linked to training datasets, inconsistent prompt-to-image accuracy across languages, and rising compute costs during spot market fluctuations continue to constrain adoption. Ultimately, growth will hinge on measurable ROI metrics such as cost per usable asset, reductions in concept-cycle time, and robust rights-management practices. Over the forecast period, organizations that standardize content provenance, manage operational expenses, and embed generators into production-grade workflows are expected to capture the largest share of commercial spending.
Key Takeaways
Market Growth: The Global AI Text-to-Image Generator market was USD 501.6 Million in 2024 and is projected at USD 2,528.5 Million by 2034, with a 15.3% CAGR from 2025–2034; growth is driven by content digitalization, cloud economics, and faster model iteration.
Product Type:Software: software solutions control over 81% of the market; they lead because platforms bundle model access, templates, and workflow integrations that buyers prefer.
End Use:Individual users: creators and freelancers account for more than 64% of demand, representing roughly USD 257.0 Million of 2024 revenue; this group drives high-volume, low-ticket transactions and rapid feature adoption.
Driver:Cloud and platform incentives: Google Cloud’s USD 300 trial credits and product launches such as Appy Pie’s April 2024 image generator accelerate trialing; related category engagement on G2 rose 441% year-over-year, indicating strong developer and buyer experimentation.
Restraint:Enterprise readiness: only 42% of firms with more than 1,000 employees have integrated AI; this limited integration constrains large-scale procurement and slows enterprise contract velocity.
Opportunity:Creator economy and consumer apps: if individual users retain a 64% share as the market reaches USD 1,528.5 Million, that segment could approach ~USD 978.2 Million by 2034; targeting creators’ gives you access to rapid monetization paths.
Trend:Adjacent tooling growth: the AI image editor market reached USD 80.4 Million in 2024; combined with tool listings and platform integrations, editors are becoming the primary on-ramps for nontechnical users.
Regional Analysis:North America: led in 2024 with more than 34.1% market share and USD 171.05 Million in revenue, supported by investor activity and ad tech demand; Asia Pacific: shows elevated national adoption rates (India 59%, UAE 58%, Singapore 53%, China 50% per World Bank) and offers rapid commercial trials, especially in gaming and e-commerce.
Type Analysis
Software dominates the market. In 2024 software solutions represented roughly 81% of the AI text-to-image generator market, or about USD 325.3 Million of the USD 401.6 Million total. Platforms and packaged applications account for most commercial deployments; they combine pre-trained models, user interfaces, and workflow connectors that reduce time-to-first-image for buyers. Services remain material but smaller. Integration, customization, and managed offerings represented about USD 76.3 Million in 2024; these services attract enterprise accounts that require SLA-backed performance and rights management. Expect services to grow as companies standardize provenance and procurement for production use.
Application Analysis
Marketing and advertising lead commercial usage. Brands use generators to produce campaign variants, reduce mockup cycles, and scale A/B testing; these applications drive a high volume of low-cost outputs. The AI image editor submarket reached USD 80.4 Million in 2024, reflecting rising demand for tooling that sits adjacent to generator engines. Social media and e-commerce follow closely. Mobile-based creation dominates user activity with over 59% of platform access; this fuels rapid creative iteration for influencers and retailers. You should monitor how app-first features, such as one-tap style transfer and in-app asset management, change acquisition economics.
End-Use Analysis
Individual users form the largest user base. Individuals accounted for about 64% of market activity in 2024, equating to approximately USD 257.0 Million in spend; creators, hobbyists, and freelancers drive feature uptake and viral distribution. This cohort favors simple interfaces and low-cost subscriptions. Enterprise demand is growing. Enterprises represented about USD 144.6 Million in 2024; adoption concentrates in advertising agencies, game studios, and e-commerce platforms. However only 42% of firms with more than 1,000 employees reported AI integration in operations, which tempers large-scale procurement in the near term.
Regional Analysis
North America leads. The region held more than 34.1% share in 2024, or roughly USD 171.05 Million in revenue, supported by investor activity and buyer concentration in U.S. ad tech and entertainment hubs. You will find the deepest vendor and integration ecosystems there.
Asia Pacific shows rapid trials and national adoption. Country-level AI adoption runs high: India 59%, UAE 58%, Singapore 53%, China 50% per recent enterprise surveys; these rates underpin fast commercial experimentation in gaming and retail. Europe displays cautious procurement and higher compliance costs; Latin America and Middle East & Africa present selective opportunities tied to mobile-first use cases and regional content needs.
Customization for segments, region/country-level will be provided. Moreover, additional customization can be done based on the requirements.
Pricing and Purchase Options
Avail customized purchase options to meet your exact research needs. We have three licenses to opt for: Single User License, Multi-User License (Up to 5 Users), Corporate Use License (Unlimited User and Printable PDF).
TABLE OF CONTENTS
1. EXECUTIVE SUMMARY
1.1. MARKET SNAPSHOT
1.2. KEY FINDINGS & INSIGHTS
1.3. ANALYST RECOMMENDATIONS
1.4. FUTURE OUTLOOK
2. RESEARCH METHODOLOGY
2.1. MARKET DEFINITION & SCOPE
2.2. RESEARCH OBJECTIVES: PRIMARY & SECONDARY DATA SOURCES
2.3. DATA COLLECTION SOURCES
2.3.1. COVERAGE OF 100+ PRIMARY RESEARCH/CONSULTATION CALLS WITH INDUSTRY STAKEHOLDERS
FIGURE 17 NORTH AMERICA AI TEXT-TO-IMAGE GENERATOR CURRENT AND FUTURE TYPE ANALYSIS, 2025–2034, (USD MILLION)
FIGURE 18 NORTH AMERICA AI TEXT-TO-IMAGE GENERATOR CURRENT AND FUTURE END USER ANALYSIS, 2025–2034, (USD MILLION)
FIGURE 19 MARKET SHARE BY COUNTRY
FIGURE 20 LATIN AMERICA AI TEXT-TO-IMAGE GENERATOR CURRENT AND FUTURE TYPE ANALYSIS, 2025–2034, (USD MILLION)
FIGURE 21 LATIN AMERICA AI TEXT-TO-IMAGE GENERATOR CURRENT AND FUTURE END USER ANALYSIS, 2025–2034, (USD MILLION)
FIGURE 22 MARKET SHARE BY COUNTRY
FIGURE 23 EASTERN EUROPE AI TEXT-TO-IMAGE GENERATOR CURRENT AND FUTURE TYPE ANALYSIS, 2025–2034, (USD MILLION)
FIGURE 24 EASTERN EUROPE AI TEXT-TO-IMAGE GENERATOR CURRENT AND FUTURE END USER ANALYSIS, 2025–2034, (USD MILLION)
FIGURE 25 MARKET SHARE BY COUNTRY
FIGURE 26 WESTERN EUROPE AI TEXT-TO-IMAGE GENERATOR CURRENT AND FUTURE TYPE ANALYSIS, 2025–2034, (USD MILLION)
FIGURE 27 WESTERN EUROPE AI TEXT-TO-IMAGE GENERATOR CURRENT AND FUTURE END USER ANALYSIS, 2025–2034, (USD MILLION)
FIGURE 28 MARKET SHARE BY COUNTRY
FIGURE 29 EAST ASIA AND PACIFIC AI TEXT-TO-IMAGE GENERATOR CURRENT AND FUTURE TYPE ANALYSIS, 2025–2034, (USD MILLION)
FIGURE 30 EAST ASIA AND PACIFIC AI TEXT-TO-IMAGE GENERATOR CURRENT AND FUTURE END USER ANALYSIS, 2025–2034, (USD MILLION)
FIGURE 31 MARKET SHARE BY COUNTRY
FIGURE 32 SEA AND SOUTH ASIA AI TEXT-TO-IMAGE GENERATOR CURRENT AND FUTURE TYPE ANALYSIS, 2025–2034, (USD MILLION)
FIGURE 33 SEA AND SOUTH ASIA AI TEXT-TO-IMAGE GENERATOR CURRENT AND FUTURE END USER ANALYSIS, 2025–2034, (USD MILLION)
FIGURE 34 MARKET SHARE BY COUNTRY
FIGURE 35 MIDDLE EAST AND AFRICA AI TEXT-TO-IMAGE GENERATOR CURRENT AND FUTURE TYPE ANALYSIS, 2025–2034, (USD MILLION)
FIGURE 36 MIDDLE EAST AND AFRICA AI TEXT-TO-IMAGE GENERATOR CURRENT AND FUTURE END USER ANALYSIS, 2025–2034, (USD MILLION)
FIGURE 37 NORTH AMERICA AI TEXT-TO-IMAGE GENERATOR CURRENT AND FUTURE MARKET VOLUME SHARE REGIONAL ANALYSIS, 2025–2034, (USD MILLION)
FIGURE 38 U.S. AI TEXT-TO-IMAGE GENERATOR CURRENT AND FUTURE TYPE ANALYSIS, 2025–2034, (USD MILLION)
FIGURE 39 U.S. AI TEXT-TO-IMAGE GENERATOR CURRENT AND FUTURE END USER ANALYSIS, 2025–2034, (USD MILLION)
FIGURE 40 CANADA AI TEXT-TO-IMAGE GENERATOR CURRENT AND FUTURE TYPE ANALYSIS, 2025–2034, (USD MILLION)
FIGURE 41 CANADA AI TEXT-TO-IMAGE GENERATOR CURRENT AND FUTURE END USER ANALYSIS, 2025–2034, (USD MILLION)
FIGURE 42 LATIN AMERICA AI TEXT-TO-IMAGE GENERATOR CURRENT AND FUTURE MARKET VOLUME SHARE REGIONAL ANALYSIS, 2025–2034, (USD MILLION)
FIGURE 43 MEXICO AI TEXT-TO-IMAGE GENERATOR CURRENT AND FUTURE TYPE ANALYSIS, 2025–2034, (USD MILLION)
FIGURE 44 MEXICO AI TEXT-TO-IMAGE GENERATOR CURRENT AND FUTURE END USER ANALYSIS, 2025–2034, (USD MILLION)
FIGURE 45 BRAZIL AI TEXT-TO-IMAGE GENERATOR CURRENT AND FUTURE TYPE ANALYSIS, 2025–2034, (USD MILLION)
FIGURE 46 BRAZIL AI TEXT-TO-IMAGE GENERATOR CURRENT AND FUTURE END USER ANALYSIS, 2025–2034, (USD MILLION)
FIGURE 47 ARGENTINA AI TEXT-TO-IMAGE GENERATOR CURRENT AND FUTURE TYPE ANALYSIS, 2025–2034, (USD MILLION)
FIGURE 48 ARGENTINA AI TEXT-TO-IMAGE GENERATOR CURRENT AND FUTURE END USER ANALYSIS, 2025–2034, (USD MILLION)
FIGURE 49 COLUMBIA AI TEXT-TO-IMAGE GENERATOR CURRENT AND FUTURE TYPE ANALYSIS, 2025–2034, (USD MILLION)
FIGURE 50 COLUMBIA AI TEXT-TO-IMAGE GENERATOR CURRENT AND FUTURE END USER ANALYSIS, 2025–2034, (USD MILLION)
FIGURE 51 REST OF LATIN AMERICA AI TEXT-TO-IMAGE GENERATOR CURRENT AND FUTURE TYPE ANALYSIS, 2025–2034, (USD MILLION)
FIGURE 52 REST OF LATIN AMERICA AI TEXT-TO-IMAGE GENERATOR CURRENT AND FUTURE END USER ANALYSIS, 2025–2034, (USD MILLION)
FIGURE 53 EASTERN EUROPE AI TEXT-TO-IMAGE GENERATOR CURRENT AND FUTURE MARKET VOLUME SHARE REGIONAL ANALYSIS, 2025–2034, (USD MILLION)
FIGURE 54 POLAND AI TEXT-TO-IMAGE GENERATOR CURRENT AND FUTURE TYPE ANALYSIS, 2025–2034, (USD MILLION)
FIGURE 55 POLAND AI TEXT-TO-IMAGE GENERATOR CURRENT AND FUTURE END USER ANALYSIS, 2025–2034, (USD MILLION)
FIGURE 56 RUSSIA AI TEXT-TO-IMAGE GENERATOR CURRENT AND FUTURE TYPE ANALYSIS, 2025–2034, (USD MILLION)
FIGURE 57 RUSSIA AI TEXT-TO-IMAGE GENERATOR CURRENT AND FUTURE END USER ANALYSIS, 2025–2034, (USD MILLION)
FIGURE 58 CZECH REPUBLIC AI TEXT-TO-IMAGE GENERATOR CURRENT AND FUTURE TYPE ANALYSIS, 2025–2034, (USD MILLION)
FIGURE 59 CZECH REPUBLIC AI TEXT-TO-IMAGE GENERATOR CURRENT AND FUTURE END USER ANALYSIS, 2025–2034, (USD MILLION)
FIGURE 60 ROMANIA AI TEXT-TO-IMAGE GENERATOR CURRENT AND FUTURE TYPE ANALYSIS, 2025–2034, (USD MILLION)
FIGURE 61 ROMANIA AI TEXT-TO-IMAGE GENERATOR CURRENT AND FUTURE END USER ANALYSIS, 2025–2034, (USD MILLION)
FIGURE 62 REST OF EASTERN EUROPE AI TEXT-TO-IMAGE GENERATOR CURRENT AND FUTURE TYPE ANALYSIS, 2025–2034, (USD MILLION)
FIGURE 63 REST OF EASTERN EUROPE AI TEXT-TO-IMAGE GENERATOR CURRENT AND FUTURE END USER ANALYSIS, 2025–2034, (USD MILLION)
FIGURE 64 WESTERN EUROPE AI TEXT-TO-IMAGE GENERATOR CURRENT AND FUTURE MARKET VOLUME SHARE REGIONAL ANALYSIS, 2025–2034, (USD MILLION)
FIGURE 65 GERMANY AI TEXT-TO-IMAGE GENERATOR CURRENT AND FUTURE TYPE ANALYSIS, 2025–2034, (USD MILLION)
FIGURE 66 GERMANY AI TEXT-TO-IMAGE GENERATOR CURRENT AND FUTURE END USER ANALYSIS, 2025–2034, (USD MILLION)
FIGURE 67 FRANCE AI TEXT-TO-IMAGE GENERATOR CURRENT AND FUTURE TYPE ANALYSIS, 2025–2034, (USD MILLION)
FIGURE 68 FRANCE AI TEXT-TO-IMAGE GENERATOR CURRENT AND FUTURE END USER ANALYSIS, 2025–2034, (USD MILLION)
FIGURE 69 UK AI TEXT-TO-IMAGE GENERATOR CURRENT AND FUTURE TYPE ANALYSIS, 2025–2034, (USD MILLION)
FIGURE 70 UK AI TEXT-TO-IMAGE GENERATOR CURRENT AND FUTURE END USER ANALYSIS, 2025–2034, (USD MILLION)
FIGURE 71 SPAIN AI TEXT-TO-IMAGE GENERATOR CURRENT AND FUTURE TYPE ANALYSIS, 2025–2034, (USD MILLION)
FIGURE 72 SPAIN AI TEXT-TO-IMAGE GENERATOR CURRENT AND FUTURE END USER ANALYSIS, 2025–2034, (USD MILLION)
FIGURE 73 ITALY AI TEXT-TO-IMAGE GENERATOR CURRENT AND FUTURE TYPE ANALYSIS, 2025–2034, (USD MILLION)
FIGURE 74 ITALY AI TEXT-TO-IMAGE GENERATOR CURRENT AND FUTURE END USER ANALYSIS, 2025–2034, (USD MILLION)
FIGURE 75 REST OF WESTERN EUROPE AI TEXT-TO-IMAGE GENERATOR CURRENT AND FUTURE TYPE ANALYSIS, 2025–2034, (USD MILLION)
FIGURE 76 REST OF WESTERN EUROPE AI TEXT-TO-IMAGE GENERATOR CURRENT AND FUTURE END USER ANALYSIS, 2025–2034, (USD MILLION)
FIGURE 77 EAST ASIA AND PACIFIC AI TEXT-TO-IMAGE GENERATOR CURRENT AND FUTURE MARKET VOLUME SHARE REGIONAL ANALYSIS, 2025–2034, (USD MILLION)
FIGURE 78 CHINA AI TEXT-TO-IMAGE GENERATOR CURRENT AND FUTURE TYPE ANALYSIS, 2025–2034, (USD MILLION)
FIGURE 79 CHINA AI TEXT-TO-IMAGE GENERATOR CURRENT AND FUTURE END USER ANALYSIS, 2025–2034, (USD MILLION)
FIGURE 80 JAPAN AI TEXT-TO-IMAGE GENERATOR CURRENT AND FUTURE TYPE ANALYSIS, 2025–2034, (USD MILLION)
FIGURE 81 JAPAN AI TEXT-TO-IMAGE GENERATOR CURRENT AND FUTURE END USER ANALYSIS, 2025–2034, (USD MILLION)
FIGURE 82 AUSTRALIA AI TEXT-TO-IMAGE GENERATOR CURRENT AND FUTURE TYPE ANALYSIS, 2025–2034, (USD MILLION)
FIGURE 83 AUSTRALIA AI TEXT-TO-IMAGE GENERATOR CURRENT AND FUTURE END USER ANALYSIS, 2025–2034, (USD MILLION)
FIGURE 84 CAMBODIA AI TEXT-TO-IMAGE GENERATOR CURRENT AND FUTURE TYPE ANALYSIS, 2025–2034, (USD MILLION)
FIGURE 85 CAMBODIA AI TEXT-TO-IMAGE GENERATOR CURRENT AND FUTURE END USER ANALYSIS, 2025–2034, (USD MILLION)
FIGURE 86 FIJI AI TEXT-TO-IMAGE GENERATOR CURRENT AND FUTURE TYPE ANALYSIS, 2025–2034, (USD MILLION)
FIGURE 87 FIJI AI TEXT-TO-IMAGE GENERATOR CURRENT AND FUTURE END USER ANALYSIS, 2025–2034, (USD MILLION)
FIGURE 88 INDONESIA AI TEXT-TO-IMAGE GENERATOR CURRENT AND FUTURE TYPE ANALYSIS, 2025–2034, (USD MILLION)
FIGURE 89 INDONESIA AI TEXT-TO-IMAGE GENERATOR CURRENT AND FUTURE END USER ANALYSIS, 2025–2034, (USD MILLION)
FIGURE 90 SOUTH KOREA AI TEXT-TO-IMAGE GENERATOR CURRENT AND FUTURE TYPE ANALYSIS, 2025–2034, (USD MILLION)
FIGURE 91 SOUTH KOREA AI TEXT-TO-IMAGE GENERATOR CURRENT AND FUTURE END USER ANALYSIS, 2025–2034, (USD MILLION)
FIGURE 92 REST OF EAST ASIA AND PACIFIC AI TEXT-TO-IMAGE GENERATOR CURRENT AND FUTURE TYPE ANALYSIS, 2025–2034, (USD MILLION)
FIGURE 93 REST OF EAST ASIA AND PACIFIC AI TEXT-TO-IMAGE GENERATOR CURRENT AND FUTURE END USER ANALYSIS, 2025–2034, (USD MILLION)
FIGURE 94 SEA AND SOUTH ASIA AI TEXT-TO-IMAGE GENERATOR CURRENT AND FUTURE MARKET VOLUME SHARE REGIONAL ANALYSIS, 2025–2034, (USD MILLION)
FIGURE 95 BANGLADESH AI TEXT-TO-IMAGE GENERATOR CURRENT AND FUTURE TYPE ANALYSIS, 2025–2034, (USD MILLION)
FIGURE 96 BANGLADESH AI TEXT-TO-IMAGE GENERATOR CURRENT AND FUTURE END USER ANALYSIS, 2025–2034, (USD MILLION)
FIGURE 97 NEW ZEALAND AI TEXT-TO-IMAGE GENERATOR CURRENT AND FUTURE TYPE ANALYSIS, 2025–2034, (USD MILLION)
FIGURE 98 NEW ZEALAND AI TEXT-TO-IMAGE GENERATOR CURRENT AND FUTURE END USER ANALYSIS, 2025–2034, (USD MILLION)
FIGURE 99 INDIA AI TEXT-TO-IMAGE GENERATOR CURRENT AND FUTURE TYPE ANALYSIS, 2025–2034, (USD MILLION)
FIGURE 100 INDIA AI TEXT-TO-IMAGE GENERATOR CURRENT AND FUTURE END USER ANALYSIS, 2025–2034, (USD MILLION)
FIGURE 101 SINGAPORE AI TEXT-TO-IMAGE GENERATOR CURRENT AND FUTURE TYPE ANALYSIS, 2025–2034, (USD MILLION)
FIGURE 102 SINGAPORE AI TEXT-TO-IMAGE GENERATOR CURRENT AND FUTURE END USER ANALYSIS, 2025–2034, (USD MILLION)
FIGURE 103 THAILAND AI TEXT-TO-IMAGE GENERATOR CURRENT AND FUTURE TYPE ANALYSIS, 2025–2034, (USD MILLION)
FIGURE 104 THAILAND AI TEXT-TO-IMAGE GENERATOR CURRENT AND FUTURE END USER ANALYSIS, 2025–2034, (USD MILLION)
FIGURE 105 TAIWAN AI TEXT-TO-IMAGE GENERATOR CURRENT AND FUTURE TYPE ANALYSIS, 2025–2034, (USD MILLION)
FIGURE 106 TAIWAN AI TEXT-TO-IMAGE GENERATOR CURRENT AND FUTURE END USER ANALYSIS, 2025–2034, (USD MILLION)
FIGURE 107 MALAYSIA AI TEXT-TO-IMAGE GENERATOR CURRENT AND FUTURE TYPE ANALYSIS, 2025–2034, (USD MILLION)
FIGURE 108 MALAYSIA AI TEXT-TO-IMAGE GENERATOR CURRENT AND FUTURE END USER ANALYSIS, 2025–2034, (USD MILLION)
FIGURE 109 REST OF SEA AND SOUTH ASIA AI TEXT-TO-IMAGE GENERATOR CURRENT AND FUTURE TYPE ANALYSIS, 2025–2034, (USD MILLION)
FIGURE 110 REST OF SEA AND SOUTH ASIA AI TEXT-TO-IMAGE GENERATOR CURRENT AND FUTURE END USER ANALYSIS, 2025–2034, (USD MILLION)
FIGURE 111 MIDDLE EAST AND AFRICA AI TEXT-TO-IMAGE GENERATOR CURRENT AND FUTURE MARKET VOLUME SHARE REGIONAL ANALYSIS, 2025–2034, (USD MILLION)
FIGURE 112 GCC COUNTRIES AI TEXT-TO-IMAGE GENERATOR CURRENT AND FUTURE TYPE ANALYSIS, 2025–2034, (USD MILLION)
FIGURE 113 GCC COUNTRIES AI TEXT-TO-IMAGE GENERATOR CURRENT AND FUTURE END USER ANALYSIS, 2025–2034, (USD MILLION)
FIGURE 114 SAUDI ARABIA AI TEXT-TO-IMAGE GENERATOR CURRENT AND FUTURE TYPE ANALYSIS, 2025–2034, (USD MILLION)
FIGURE 115 SAUDI ARABIA AI TEXT-TO-IMAGE GENERATOR CURRENT AND FUTURE END USER ANALYSIS, 2025–2034, (USD MILLION)
FIGURE 116 UAE AI TEXT-TO-IMAGE GENERATOR CURRENT AND FUTURE TYPE ANALYSIS, 2025–2034, (USD MILLION)
FIGURE 117 UAE AI TEXT-TO-IMAGE GENERATOR CURRENT AND FUTURE END USER ANALYSIS, 2025–2034, (USD MILLION)
FIGURE 118 BAHRAIN AI TEXT-TO-IMAGE GENERATOR CURRENT AND FUTURE TYPE ANALYSIS, 2025–2034, (USD MILLION)
FIGURE 119 BAHRAIN AI TEXT-TO-IMAGE GENERATOR CURRENT AND FUTURE END USER ANALYSIS, 2025–2034, (USD MILLION)
FIGURE 120 KUWAIT AI TEXT-TO-IMAGE GENERATOR CURRENT AND FUTURE TYPE ANALYSIS, 2025–2034, (USD MILLION)
FIGURE 121 KUWAIT AI TEXT-TO-IMAGE GENERATOR CURRENT AND FUTURE END USER ANALYSIS, 2025–2034, (USD MILLION)
FIGURE 122 OMAN AI TEXT-TO-IMAGE GENERATOR CURRENT AND FUTURE TYPE ANALYSIS, 2025–2034, (USD MILLION)
FIGURE 123 OMAN AI TEXT-TO-IMAGE GENERATOR CURRENT AND FUTURE END USER ANALYSIS, 2025–2034, (USD MILLION)
FIGURE 124 QATAR AI TEXT-TO-IMAGE GENERATOR CURRENT AND FUTURE TYPE ANALYSIS, 2025–2034, (USD MILLION)
FIGURE 125 QATAR AI TEXT-TO-IMAGE GENERATOR CURRENT AND FUTURE END USER ANALYSIS, 2025–2034, (USD MILLION)
FIGURE 126 EGYPT AI TEXT-TO-IMAGE GENERATOR CURRENT AND FUTURE TYPE ANALYSIS, 2025–2034, (USD MILLION)
FIGURE 127 EGYPT AI TEXT-TO-IMAGE GENERATOR CURRENT AND FUTURE END USER ANALYSIS, 2025–2034, (USD MILLION)
FIGURE 128 NIGERIA AI TEXT-TO-IMAGE GENERATOR CURRENT AND FUTURE TYPE ANALYSIS, 2025–2034, (USD MILLION)
FIGURE 129 NIGERIA AI TEXT-TO-IMAGE GENERATOR CURRENT AND FUTURE END USER ANALYSIS, 2025–2034, (USD MILLION)
FIGURE 130 SOUTH AFRICA AI TEXT-TO-IMAGE GENERATOR CURRENT AND FUTURE TYPE ANALYSIS, 2025–2034, (USD MILLION)
FIGURE 131 SOUTH AFRICA AI TEXT-TO-IMAGE GENERATOR CURRENT AND FUTURE END USER ANALYSIS, 2025–2034, (USD MILLION)
FIGURE 132 ISRAEL AI TEXT-TO-IMAGE GENERATOR CURRENT AND FUTURE TYPE ANALYSIS, 2025–2034, (USD MILLION)
FIGURE 133 ISRAEL AI TEXT-TO-IMAGE GENERATOR CURRENT AND FUTURE END USER ANALYSIS, 2025–2034, (USD MILLION)
FIGURE 134 REST OF MEA AI TEXT-TO-IMAGE GENERATOR CURRENT AND FUTURE TYPE ANALYSIS, 2025–2034, (USD MILLION)
FIGURE 135 REST OF MEA AI TEXT-TO-IMAGE GENERATOR CURRENT AND FUTURE END USER ANALYSIS, 2025–2034, (USD MILLION)
FIGURE 136 U. S. MARKET SHARE ANALYSIS BY TYPE (2024)
FIGURE 137 U. S. MARKET SHARE ANALYSIS BY END USER (2024)
FIGURE 138 CANADA MARKET SHARE ANALYSIS BY TYPE (2024)
FIGURE 139 CANADA MARKET SHARE ANALYSIS BY END USER (2024)
FIGURE 140 MEXICO MARKET SHARE ANALYSIS BY TYPE (2024)
FIGURE 141 MEXICO MARKET SHARE ANALYSIS BY END USER (2024)
FIGURE 142 CHINA MARKET SHARE ANALYSIS BY TYPE (2024)
FIGURE 143 CHINA MARKET SHARE ANALYSIS BY END USER (2024)
FIGURE 144 JAPAN MARKET SHARE ANALYSIS BY TYPE (2024)
FIGURE 145 JAPAN MARKET SHARE ANALYSIS BY END USER (2024)
FIGURE 146 INDIA MARKET SHARE ANALYSIS BY TYPE (2024)
FIGURE 147 INDIA MARKET SHARE ANALYSIS BY END USER (2024)
FIGURE 148 SOUTH KOREA MARKET SHARE ANALYSIS BY TYPE (2024)
FIGURE 149 SOUTH KOREA MARKET SHARE ANALYSIS BY END USER (2024)
FIGURE 150 SAUDI ARABIA MARKET SHARE ANALYSIS BY TYPE (2024)
FIGURE 151 SAUDI ARABIA MARKET SHARE ANALYSIS BY END USER (2024)
FIGURE 152 UAE MARKET SHARE ANALYSIS BY TYPE (2024)
FIGURE 153 UAE MARKET SHARE ANALYSIS BY END USER (2024)
FIGURE 154 EGYPT MARKET SHARE ANALYSIS BY TYPE (2024)
FIGURE 155 EGYPT MARKET SHARE ANALYSIS BY END USER (2024)
FIGURE 156 NIGERIA MARKET SHARE ANALYSIS BY TYPE (2024)
FIGURE 157 NIGERIA MARKET SHARE ANALYSIS BY END USER (2024)
FIGURE 158 SOUTH AFRICA MARKET SHARE ANALYSIS BY TYPE (2024)
FIGURE 159 SOUTH AFRICA MARKET SHARE ANALYSIS BY END USER (2024)
FIGURE 160 GERMANY MARKET SHARE ANALYSIS BY TYPE (2024)
FIGURE 161 GERMANY MARKET SHARE ANALYSIS BY END USER (2024)
FIGURE 162 FRANCE MARKET SHARE ANALYSIS BY TYPE (2024)
FIGURE 163 FRANCE MARKET SHARE ANALYSIS BY END USER (2024)
FIGURE 164 UK MARKET SHARE ANALYSIS BY TYPE (2024)
FIGURE 165 UK MARKET SHARE ANALYSIS BY END USER (2024)
FIGURE 166 SPAIN MARKET SHARE ANALYSIS BY TYPE (2024)
FIGURE 167 SPAIN MARKET SHARE ANALYSIS BY END USER (2024)
FIGURE 168 ITALY MARKET SHARE ANALYSIS BY TYPE (2024)
FIGURE 169 ITALY MARKET SHARE ANALYSIS BY END USER (2024)
FIGURE 170 BRAZIL MARKET SHARE ANALYSIS BY TYPE (2024)
FIGURE 171 BRAZIL MARKET SHARE ANALYSIS BY END USER (2024)
FIGURE 172 ARGENTINA MARKET SHARE ANALYSIS BY TYPE (2024)
FIGURE 173 ARGENTINA MARKET SHARE ANALYSIS BY END USER (2024)
FIGURE 174 COLUMBIA MARKET SHARE ANALYSIS BY TYPE (2024)
FIGURE 175 COLUMBIA MARKET SHARE ANALYSIS BY END USER (2024)
FIGURE 176 GLOBAL AI TEXT-TO-IMAGE GENERATOR CURRENT AND FUTURE MARKET KEY COUNTRY LEVEL ANALYSIS, 2024–2034, (USD MILLION)
FIGURE 177 FINANCIAL OVERVIEW:
Key Player Analysis
Adobe: Adobe occupies a leader position in the AI text-to-image category through its Firefly family and deep integration across Creative Cloud applications. Firefly ships as built-in capabilities in Photoshop, Illustrator, Adobe Express, and a standalone mobile app, enabling cross-device workflows and content provenance controls that appeal to enterprise buyers; Adobe reports substantial Firefly usage and positions these features as central to its 2025 AI strategy. Adobe pairs product breadth with scale. Creative Cloud paid subscriptions reached roughly 37 million paid users by late 2024, which gives Firefly immediate distribution and enterprise reach; Adobe’s licensing and credit models also create recurring revenue paths for hosted inference and premium features. These factors make Adobe the default vendor for professional creative teams and large agencies, and they raise the bar for competitors who target production workflows and rights management.
Canva: Canva serves as a market challenger with mass-market penetration and a clear consumer-to-enterprise play. The platform reported roughly 220–240 million monthly active users and multi-billion dollar annualized revenue by mid-2025, which lets Canva monetize text-to-image features through subscriptions, a growing app marketplace, and recent AI acquisitions to strengthen in-product generative capabilities. Canva competes on ease of use and distribution. Its acquisition and integration of third-party AI tools accelerate feature roll-outs for nontechnical users and SMB marketing teams. If you target high-volume, low-touch customers, Canva’s price points and app ecosystem provide faster user acquisition than enterprise-grade incumbents; expect continued investment in AI assistants and developer incentives.
Photosonic (Writesonic): Photosonic, offered by Writesonic, positions itself as an innovator focused on rapid, cost-effective image creation for content teams and individual creators. The product converts text prompts into multiple image styles in seconds and integrates with Writesonic’s broader content stack, making it attractive for marketers who need bespoke visuals without heavy engineering investment. Photosonic’s differentiator is workflow integration within a content platform. You get prompt history, template reuse, and API access for automated campaigns; this lowers the operational barrier for small agencies and publishers. While Photosonic lacks Adobe-level enterprise scale, it captures users who prefer SaaS simplicity and fast iteration.
Jasper.ai (Jasper Art): Jasper positions its image tools as a marketer-centric solution and a challenger within creative suites. Jasper’s Image Suite emphasizes bulk editing, personalization, and marketing workflow automation; the product promises to shorten campaign launch cycles by automating image variants and localization at scale. Jasper’s strategic strength lies in combining copy and image generation for end-to-end marketing workflows. If your priority is campaign velocity and brand consistency, Jasper’s integrated dashboard and template library reduce manual work. Expect continued R&D to expand image fidelity and API capabilities that tie into commerce and CRM systems.
Market Key Players
Jasper.ai Art
NightCafe
DALL·E (by OpenAI)
Canva
Fotor
Dream Studio (Stable Diffusion)
StarryAI
Bing Image Creator (Microsoft Designer)
Photosonic
Google Bard Image Generator/ImageFX
Lensa AI
Craiyon
AISEO
WOMBO Dream
NightCafe
Fotor
Adobe
Other Key Players
Driver
Rising Demand for Speed, Personalization, and High-Volume Content
By 2025, the market will increasingly focus on speed and personalization due to rising demand for custom visual content in advertising, e-commerce, gaming, and social media. The market was valued at USD 401.6 million in 2024 and is expected to reach USD 1,528.5 million by 2034, with a 14.3% CAGR. This indicates a continuous need for large quantities of on-demand images. Individual users make up about 64% of platform activity, while software products hold nearly 81% of the market share. Together, these factors enable shorter production cycles and lower costs per image.
Platform Incentives Accelerate Trial Activity and Adoption
Adoption is also driven by platform incentives and environments that support experimentation. Google Cloud offers USD 300 in credits for new users, which encourages low-risk testing of image-generation models. High engagement in marketplaces shows strong user activity, with G2 reporting a 44.1% year-over-year increase in related category interactions. These incentives boost commercial trials, grow user bases, and increase the chances of long-term enterprise conversion.
Restraint
Legal Uncertainty Slows Enterprise Procurement
Legal and operational issues continue to limit large-scale enterprise adoption. Copyright and provenance guidelines for AI-generated images are still unclear, leading companies, especially in regulated industries, to carry out thorough legal reviews. As a result, only around 42% of firms with over 1,000 employees report using AI tools. This situation restricts large contract opportunities and slows the creation of stable revenue streams for vendors.
High Infrastructure Costs Increase Total Cost of Ownership
Operational challenges also come from the computing power needed for production-grade models. High demands for computing and energy lead to increased deployment costs. Enterprises often face unpredictable spikes in GPU pricing, which lengthen sales cycles and raise the overall cost for buyers. This makes it harder for businesses to adopt these technologies compared to growth in consumer usage.
Opportunity
Consumer and Creator Segments Offer Significant Revenue Potential
Growth opportunities are strongest in creator and consumer applications. If the share of individual users stays around 64%, this group could represent nearly USD 978 million of the total market by 2034. This segment creates direct monetization opportunities through subscriptions, microtransactions, and in-app purchases. Platforms designed for creator workflows and hobbyist use can drive rapid growth and recurring revenue.
Mobile-First Experiences and Ecosystem Integrations Drive Expansion
Mobile-first features are becoming essential, with mobile use already accounting for more than 59% of all platform engagement. Integrating generators with AR/VR environments, game engines, and commerce workflows opens up new ways to make money and keeps users engaged. These integrations are particularly powerful in areas where mobile access is greater than desktop use, creating strong potential for geographic expansion.
Trend
Cloud Delivery and Rights-Management APIs Shape Product Strategy
Cloud delivery models and better rights-management tools are changing product strategies in 2025. Vendors are combining hosted inference with template-based workflows and rights-management APIs to streamline integration for businesses. Related markets, like AI image editing, which reached USD 80.4 million in 2024, show a growing need for cohesive, end-to-end creative tools.
Improvements in model design are speeding up processes as diffusion-based architectures and optimized inference methods reduce latency and increase quality. These advancements broaden the possibilities in real-time creative settings, allowing for live ad personalization, interactive design sessions, and quick revisions for commercial assets. As performance improves, AI image generation becomes a more integral part of ongoing production workflows.
Recent Developments
Dec 2024 – Adobe: Adobe announced a partnership to embed Adobe Express capabilities with Box, bringing integrated AI-powered creative tools and content governance into enterprise file workflows; the agreement targets business users and speeds creative handoffs across distributed teams. This move expands Adobe’s enterprise reach and strengthens its position in production pipelines where rights management and content provenance matter.
Feb 2025 – OpenAI: OpenAI published technical details and early access for Sora, a text-to-video model that can produce short-form videos up to ~60 seconds from prompts; the announcement positioned video generation as a practical extension of image-generation workflows. The release signals a strategic shift that broadens use cases for generative media and forces incumbents to address motion content and related rights questions.
Apr 2025 – Adobe: Adobe integrated third-party image-generation models from OpenAI and Google into its Firefly app, enabling users to run OpenAI and Google models alongside Adobe’s offerings and pay through Adobe’s credit system. This integration gives creative teams access to multiple model families within a single workflow and reduces friction for enterprise trials and production pilots.
Jul 2025 – Getty Images vs Stability AI: Getty Images filed a high-profile lawsuit alleging unauthorized use of copyrighted images in model training, elevating litigation risk across the image-generation market and putting model vendors under closer legal scrutiny. The case increases compliance costs and may slow large-scale procurement until clearer licensing frameworks and indemnity terms appear.
Sep 2025 – OpenAI: OpenAI released its next-generation Sora 2 video model and companion app, adding improved physical consistency, synchronized audio, and content watermarking for generated media; the launch included selective availability in the U.S. and Canada and rapidly drew developer and creator attention. Sora 2 tightens the gap between static and motion generative tools and forces platform providers and rights holders to refine content controls and monetization models.

 Aerospace And Defence
 Agriculture
 Automotive And Transportation
 Banking And Finance
 Business
 Chemicals And Materials
 Consumer And Retail
 Electronics And Semiconductors
 Food And Beverages
 Machinery & Equipments
 Manufacturing And Construction
 Medical Devices
 Others
 Pharmaceuticals And Healthcare
 Power And Energy
 Sports
 Technology

, By Application (Marketing, Gaming, Design, Media & Entertainment), By End-User (Enterprises, Creators, Agencies) Industry Outlook, Ethical AI Trends, Competitive Strategies & Forecast 2025–2034")
, By Application (Marketing, Gaming, Design, Media & Entertainment), By End-User (Enterprises, Creators, Agencies) Industry Outlook, Ethical AI Trends, Competitive Strategies & Forecast 2025–2034")
, By Application (Marketing, Gaming, Design, Media & Entertainment), By End-User (Enterprises, Creators, Agencies) Industry Outlook, Ethical AI Trends, Competitive Strategies & Forecast 2025–2034")
, By Application (Marketing, Gaming, Design, Media & Entertainment), By End-User (Enterprises, Creators, Agencies) Industry Outlook, Ethical AI Trends, Competitive Strategies & Forecast 2025–2034")

