AI Training Dataset Market Size, Trends & Forecast| 24.2% CAGR
Global AI Training Dataset Market Size, Share & Analysis By Type (Text, Image & Video, Audio), By Vertical (IT, Automotive, Government, Healthcare, BFSI, Retail & E-commerce, Others), Data Quality Trends, Vendor Landscape & Forecast 2025–2034
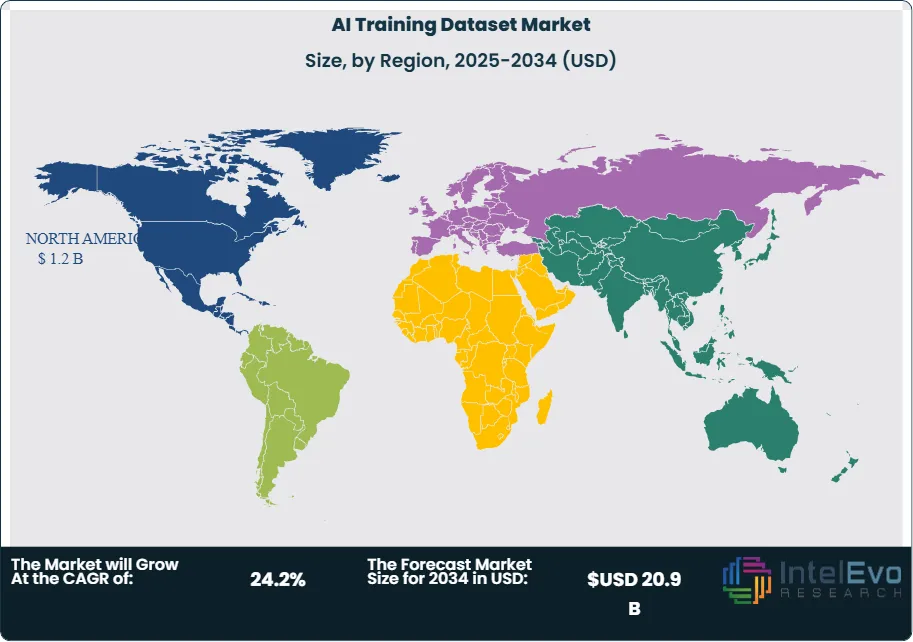
The AI Training Dataset Market is estimated at USD 3.6 billion in 2024 and is on track to reach roughly USD 20.9 billion by 2034, implying a compound annual growth rate of 24.2% over 2024–2034. Following an early phase defined by pilot AI deployments and fragmented data sourcing, the market has entered a scale-up era as enterprises industrialize machine learning pipelines. Spend is expanding from narrow text corpora toward multimodal assets—image, audio, video, sensor, and tabular—reflecting the shift from experimentation to production-grade AI. North America led in 2024 with a 35.5% revenue share (USD 0.9 billion), supported by deep AI budgets and mature data governance, while Asia–Pacific is set to post the fastest growth as digital-first economies expand data creation and localization capabilities.
Demand-side drivers include the proliferation of generative AI, the embedding of AI in customer service, risk, and operations, and sector-specific use cases such as clinical documentation, autonomous systems, fraud prevention, and supply-chain forecasting. On the supply side, the market benefits from rapid advances in data engineering: automated labeling and QA, data versioning and lineage, and synthetic data generation to amplify scarce or sensitive classes. Enterprises increasingly prioritize dataset quality over sheer volume; initiatives to reduce bias, improve representativeness, and enhance edge-case coverage are becoming budget line items, not afterthoughts. At the same time, costs for large-scale collection and curation remain material, and access to rights-cleared content is a gating factor.
Regulation is both catalyst and constraint. Intensifying privacy and data-sovereignty regimes, alongside emerging AI governance frameworks, are elevating the premium on auditable, licensed, and jurisdiction-compliant datasets. Vendors that can document provenance, consent, and model-ready formatting are gaining share. Key risks include copyright disputes, demographic skew in source data, domain drift as real-world conditions change, and security exposures when handling sensitive information.
Technological innovation will shape adoption through data-centric AI practices, active learning to target high-impact samples, weak supervision to speed annotation, and privacy-preserving techniques such as federated learning and differential privacy. Investment hotspots include domain-specific and multilingual datasets, healthcare-grade and safety-critical corpora for automotive and robotics, and platforms that blend synthetic with real-world data to accelerate model generalization. Europe is emerging as a hub for regulated-industry datasets, while India, Southeast Asia, and the Middle East present outsized opportunities in localized, low-resource language assets.
Key Takeaways
Market Growth: The global AI Training Dataset Market is set to expand from USD 3.6 billion in 2024 to USD 20.9 billion by 2034, a 24.2% CAGR (2025–2034), propelled by generative AI scale-up, multimodal model training, and enterprise data-centric AI practices. The period adds ~USD 16.3 billion in incremental spend, underscoring a rapidly deepening TAM.
By Data Type: Image/Video datasets led in 2024 with 41.2% share, reflecting computer vision, autonomous systems, and multimodal LLM demand. Continued investment in edge-case coverage and safety-critical annotations positions this segment to remain the largest revenue contributor through the forecast horizon.
By End Use: Information Technology (IT) accounted for >34% of 2024 revenue, supported by hyperscalers and platform providers operationalizing data pipelines across cloud and MLOps stacks (e.g., AWS, Microsoft, Google Cloud). IT’s scale advantages in tooling, governance, and spend aggregation reinforce its leadership in dataset procurement.
Driver: The surge in generative and multimodal AI is expanding dataset breadth and quality requirements, evidenced by North America’s USD 0.9 billion spend and 35.5% share in 2024 and the U.S. market rising from USD 0.69 billion (2024) to USD 0.81 billion (2025) on its way to USD 3.58 billion (2034). Enterprises are prioritizing balanced, representative corpora to reduce bias and improve model generalization.
Restraint: Rights-cleared content access, privacy compliance, and rising curation costs are tempering near-term velocity—illustrated by the U.S. market’s 17.9% CAGR lagging the global 22.2%, implying governance and maturity headwinds. Concentration in North America (35.5% share) also heightens exposure to regulatory shifts.
Opportunity: Outside North America, regions collectively contributed ~USD 1.7 billion in 2024 and are poised to capture a sizable share of the ~USD 16.3 billion global expansion to 2034. High-growth pockets include multilingual, healthcare-grade, and safety-critical automotive/robotics datasets, where premium pricing and compliance credentials command outsized margins.
Trend: Procurement is shifting from volume to quality, with data-centric techniques (active learning, QA automation, synthetic augmentation) compressing iteration cycles; the U.S. market is set to grow ~5.2× from 2024 to 2034 (USD 0.69→3.58 billion). Multimodal training remains pivotal, anchoring Image/Video’s 41.2% 2024 lead.
Regional Analysis: North America leads with 35.5% share and USD 0.9 billion in 2024; the U.S. alone advances at 17.9% CAGR to USD 3.58 billion by 2034. Regions beyond North America (combined ~USD 1.7 billion in 2024) are expected to grow at or above the global pace (22.2% CAGR), gradually increasing their contribution to global revenue.
Type Analysis
The market continues to pivot toward multimodal training corpora, yet Image/Video remains the anchor category. After commanding ~41.2% share in 2024, Image/Video datasets are projected to retain a ~40–42% mix in 2025 as enterprises scale perception models for autonomous systems, retail analytics, security, and immersive media. Higher-resolution streams (4K/8K) and longer-sequence video push demand for densely annotated scenes, long-tail edge cases, and scenario libraries—driving premium pricing for rights-cleared content and specialized labeling. Text corpora remain foundational for large language models (LLMs), but procurement increasingly favors provenance-attested, domain-rich, and instruction/feedback datasets that improve factuality and safety.
Audio is poised to be the fastest-growing type through 2025–2030 (low-to-mid-20s % CAGR), propelled by contact-center modernization, multilingual assistants, and on-device speech models. Growth is concentrated in diarization, emotion intent tagging, and low-resource languages—often blended with synthetic augmentation to fill gaps. Across types, automation is compressing cycle times: active learning, weak supervision, and quality assurance (QA) at scale can trim labeling costs by 15–25%, improving return on dataset spend as volumes rise.
Application Analysis
Computer Vision (CV) remains the largest application by spend, aligned with Image/Video’s share and expected to command ~45–50% of training dataset outlays in 2025. Key demand pools include automotive ADAS and autonomous driving (object detection, segmentation, depth), physical retail (loss prevention, shelf analytics), logistics (defect and damage detection), and public safety. Healthcare imaging—radiology, pathology, ophthalmology—adds durable, compliance-intensive demand for expertly curated and bias-audited images.
Natural Language Processing (NLP) is expanding from general-purpose web text to enterprise-grade instruction, RAG (retrieval-augmented generation), and alignment datasets. 2025 priorities include domain specialization (legal, financial, clinical), multilingual expansion, and safety tuning, lifting NLP’s share to the mid-30s%. Speech & Audio—roughly a mid-teens % share—benefits from omnichannel support workflows and real-time translation, with growth strongest in multilingual and accented speech collections. Multimodal applications that blend text, vision, and audio (e.g., VLMs for agentic workflows) are set to capture outsized budget increases as enterprises pilot end-to-end automation.
End-Use Analysis
Information Technology (IT) retains leadership (>34% share in 2024) and is expected to remain the largest buyer in 2025 as hyperscalers, platform vendors, and AI-native startups expand data pipelines, governance, and evaluation suites. Investment focuses on scalable annotation, lineage, and licensing frameworks to meet enterprise procurement standards. Automotive is among the fastest growers (often >25% CAGR in 2025–2030 estimates), driven by sensor fusion, long-horizon prediction, and safety validation that require massive, diverse video logs and rare-event libraries.
Healthcare and Life Sciences are accelerating (mid-20s % CAGR outlook) as payers/providers adopt imaging, documentation, and clinical NLP; demand concentrates on de-identified, consented, and demographically representative datasets. BFSI prioritizes fraud, AML, underwriting, and conversational agents—favoring high-quality tabular, text, and voice data with strict audit trails. Retail & E-commerce continues to scale computer vision and personalization, while Government demand centers on multilingual, low-resource, and domain-specific corpora under stringent sovereignty rules.
Region Analysis
North America remains the largest regional market (35.5% share; ~USD 0.9 billion in 2024) and is projected to exceed USD 1.1–1.2 billion in 2025, supported by deep AI budgets, mature data governance, and active model risk management. The U.S. alone is on a ~17.9% CAGR path toward ~USD 3.6 billion by 2034, with continued outlays for rights-cleared, provenance-documented content and sophisticated evaluation sets. Europe is scaling steadily (low-20s % CAGR), with GDPR, AI Act–aligned sourcing, and sectoral codes of conduct increasing demand for auditable, bias-tested datasets—particularly in healthcare, financial services, and regulated public-sector use cases.
Asia Pacific is the fastest-growing region (often mid-20s % CAGR), underpinned by national AI programs, expanding data center footprints, and vibrant ecosystems in China, India, Japan, and Southeast Asia. Growth concentrates on multilingual, low-resource languages, and edge AI for manufacturing and mobility. Latin America and the Middle East & Africa are at earlier stages but show double-digit growth trajectories as governments digitize services and enterprises modernize contact centers and payments. Across all regions, sovereignty, licensing clarity, and demographic representativeness are emerging as decisive procurement criteria, shaping vendor selection and long-term partnerships.
By Type (Text, Image & Video, Audio), By Vertical (IT, Automotive, Government, Healthcare, BFSI, Retail & E-commerce, Others)
Research Methodology
Primary Research- 100 Interviews of Stakeholders
Secondary Research
Desk Research
Regional scope
North America (United States, Canada, Mexico)
Latin America (Brazil, Argentina, Columbia)
East Asia And Pacific (China, Japan, South Korea, Australia, Cambodia, Fiji, Indonesia)
Sea And South Asia (India, Singapore, Thailand, Taiwan, Malaysia)
Eastern Europe (Poland, Russia, Czech Republic, Romania)
Western Europe (Germany, U.K., France, Spain, Itlay)
Middle East & Africa (GCC Countries, Egypt, Nigeria, South Africa, Israel)
Competitive Landscape
Google, Amazon Web Services (AWS), Microsoft, Appen, Scale AI, Alegion, Deep Vision Data, Cogito Tech, Lionbridge, Samasource (Sama)
Customization Scope
Customization for segments, region/country-level will be provided. Moreover, additional customization can be done based on the requirements.
Pricing and Purchase Options
Avail customized purchase options to meet your exact research needs. We have three licenses to opt for: Single User License, Multi-User License (Up to 5 Users), Corporate Use License (Unlimited User and Printable PDF).
TABLE OF CONTENTS
1. EXECUTIVE SUMMARY
1.1. MARKET SNAPSHOT
1.2. KEY FINDINGS & INSIGHTS
1.3. ANALYST RECOMMENDATIONS
1.4. FUTURE OUTLOOK
2. RESEARCH METHODOLOGY
2.1. MARKET DEFINITION & SCOPE
2.2. RESEARCH OBJECTIVES: PRIMARY & SECONDARY DATA SOURCES
2.3. DATA COLLECTION SOURCES
2.3.1. COVERAGE OF 100+ PRIMARY RESEARCH/CONSULTATION CALLS WITH INDUSTRY STAKEHOLDERS
FIGURE 17 NORTH AMERICA AI TRAINING DATASET SYSTEM CURRENT AND FUTURE TYPE ANALYSIS, 2025–2034, (USD MILLION)
FIGURE 18 NORTH AMERICA AI TRAINING DATASET SYSTEM CURRENT AND FUTURE END USER ANALYSIS, 2025–2034, (USD MILLION)
FIGURE 19 MARKET SHARE BY COUNTRY
FIGURE 20 LATIN AMERICA AI TRAINING DATASET SYSTEM CURRENT AND FUTURE TYPE ANALYSIS, 2025–2034, (USD MILLION)
FIGURE 21 LATIN AMERICA AI TRAINING DATASET SYSTEM CURRENT AND FUTURE END USER ANALYSIS, 2025–2034, (USD MILLION)
FIGURE 22 MARKET SHARE BY COUNTRY
FIGURE 23 EASTERN EUROPE AI TRAINING DATASET SYSTEM CURRENT AND FUTURE TYPE ANALYSIS, 2025–2034, (USD MILLION)
FIGURE 24 EASTERN EUROPE AI TRAINING DATASET SYSTEM CURRENT AND FUTURE END USER ANALYSIS, 2025–2034, (USD MILLION)
FIGURE 25 MARKET SHARE BY COUNTRY
FIGURE 26 WESTERN EUROPE AI TRAINING DATASET SYSTEM CURRENT AND FUTURE TYPE ANALYSIS, 2025–2034, (USD MILLION)
FIGURE 27 WESTERN EUROPE AI TRAINING DATASET SYSTEM CURRENT AND FUTURE END USER ANALYSIS, 2025–2034, (USD MILLION)
FIGURE 28 MARKET SHARE BY COUNTRY
FIGURE 29 EAST ASIA AND PACIFIC AI TRAINING DATASET SYSTEM CURRENT AND FUTURE TYPE ANALYSIS, 2025–2034, (USD MILLION)
FIGURE 30 EAST ASIA AND PACIFIC AI TRAINING DATASET SYSTEM CURRENT AND FUTURE END USER ANALYSIS, 2025–2034, (USD MILLION)
FIGURE 31 MARKET SHARE BY COUNTRY
FIGURE 32 SEA AND SOUTH ASIA AI TRAINING DATASET SYSTEM CURRENT AND FUTURE TYPE ANALYSIS, 2025–2034, (USD MILLION)
FIGURE 33 SEA AND SOUTH ASIA AI TRAINING DATASET SYSTEM CURRENT AND FUTURE END USER ANALYSIS, 2025–2034, (USD MILLION)
FIGURE 34 MARKET SHARE BY COUNTRY
FIGURE 35 MIDDLE EAST AND AFRICA AI TRAINING DATASET SYSTEM CURRENT AND FUTURE TYPE ANALYSIS, 2025–2034, (USD MILLION)
FIGURE 36 MIDDLE EAST AND AFRICA AI TRAINING DATASET SYSTEM CURRENT AND FUTURE END USER ANALYSIS, 2025–2034, (USD MILLION)
FIGURE 37 NORTH AMERICA AI TRAINING DATASET SYSTEM CURRENT AND FUTURE MARKET VOLUME SHARE REGIONAL ANALYSIS, 2025–2034, (USD MILLION)
FIGURE 38 U.S. AI TRAINING DATASET SYSTEM CURRENT AND FUTURE TYPE ANALYSIS, 2025–2034, (USD MILLION)
FIGURE 39 U.S. AI TRAINING DATASET SYSTEM CURRENT AND FUTURE END USER ANALYSIS, 2025–2034, (USD MILLION)
FIGURE 40 CANADA AI TRAINING DATASET SYSTEM CURRENT AND FUTURE TYPE ANALYSIS, 2025–2034, (USD MILLION)
FIGURE 41 CANADA AI TRAINING DATASET SYSTEM CURRENT AND FUTURE END USER ANALYSIS, 2025–2034, (USD MILLION)
FIGURE 42 LATIN AMERICA AI TRAINING DATASET SYSTEM CURRENT AND FUTURE MARKET VOLUME SHARE REGIONAL ANALYSIS, 2025–2034, (USD MILLION)
FIGURE 43 MEXICO AI TRAINING DATASET SYSTEM CURRENT AND FUTURE TYPE ANALYSIS, 2025–2034, (USD MILLION)
FIGURE 44 MEXICO AI TRAINING DATASET SYSTEM CURRENT AND FUTURE END USER ANALYSIS, 2025–2034, (USD MILLION)
FIGURE 45 BRAZIL AI TRAINING DATASET SYSTEM CURRENT AND FUTURE TYPE ANALYSIS, 2025–2034, (USD MILLION)
FIGURE 46 BRAZIL AI TRAINING DATASET SYSTEM CURRENT AND FUTURE END USER ANALYSIS, 2025–2034, (USD MILLION)
FIGURE 47 ARGENTINA AI TRAINING DATASET SYSTEM CURRENT AND FUTURE TYPE ANALYSIS, 2025–2034, (USD MILLION)
FIGURE 48 ARGENTINA AI TRAINING DATASET SYSTEM CURRENT AND FUTURE END USER ANALYSIS, 2025–2034, (USD MILLION)
FIGURE 49 COLUMBIA AI TRAINING DATASET SYSTEM CURRENT AND FUTURE TYPE ANALYSIS, 2025–2034, (USD MILLION)
FIGURE 50 COLUMBIA AI TRAINING DATASET SYSTEM CURRENT AND FUTURE END USER ANALYSIS, 2025–2034, (USD MILLION)
FIGURE 51 REST OF LATIN AMERICA AI TRAINING DATASET SYSTEM CURRENT AND FUTURE TYPE ANALYSIS, 2025–2034, (USD MILLION)
FIGURE 52 REST OF LATIN AMERICA AI TRAINING DATASET SYSTEM CURRENT AND FUTURE END USER ANALYSIS, 2025–2034, (USD MILLION)
FIGURE 53 EASTERN EUROPE AI TRAINING DATASET SYSTEM CURRENT AND FUTURE MARKET VOLUME SHARE REGIONAL ANALYSIS, 2025–2034, (USD MILLION)
FIGURE 54 POLAND AI TRAINING DATASET SYSTEM CURRENT AND FUTURE TYPE ANALYSIS, 2025–2034, (USD MILLION)
FIGURE 55 POLAND AI TRAINING DATASET SYSTEM CURRENT AND FUTURE END USER ANALYSIS, 2025–2034, (USD MILLION)
FIGURE 56 RUSSIA AI TRAINING DATASET SYSTEM CURRENT AND FUTURE TYPE ANALYSIS, 2025–2034, (USD MILLION)
FIGURE 57 RUSSIA AI TRAINING DATASET SYSTEM CURRENT AND FUTURE END USER ANALYSIS, 2025–2034, (USD MILLION)
FIGURE 58 CZECH REPUBLIC AI TRAINING DATASET SYSTEM CURRENT AND FUTURE TYPE ANALYSIS, 2025–2034, (USD MILLION)
FIGURE 59 CZECH REPUBLIC AI TRAINING DATASET SYSTEM CURRENT AND FUTURE END USER ANALYSIS, 2025–2034, (USD MILLION)
FIGURE 60 ROMANIA AI TRAINING DATASET SYSTEM CURRENT AND FUTURE TYPE ANALYSIS, 2025–2034, (USD MILLION)
FIGURE 61 ROMANIA AI TRAINING DATASET SYSTEM CURRENT AND FUTURE END USER ANALYSIS, 2025–2034, (USD MILLION)
FIGURE 62 REST OF EASTERN EUROPE AI TRAINING DATASET SYSTEM CURRENT AND FUTURE TYPE ANALYSIS, 2025–2034, (USD MILLION)
FIGURE 63 REST OF EASTERN EUROPE AI TRAINING DATASET SYSTEM CURRENT AND FUTURE END USER ANALYSIS, 2025–2034, (USD MILLION)
FIGURE 64 WESTERN EUROPE AI TRAINING DATASET SYSTEM CURRENT AND FUTURE MARKET VOLUME SHARE REGIONAL ANALYSIS, 2025–2034, (USD MILLION)
FIGURE 65 GERMANY AI TRAINING DATASET SYSTEM CURRENT AND FUTURE TYPE ANALYSIS, 2025–2034, (USD MILLION)
FIGURE 66 GERMANY AI TRAINING DATASET SYSTEM CURRENT AND FUTURE END USER ANALYSIS, 2025–2034, (USD MILLION)
FIGURE 67 FRANCE AI TRAINING DATASET SYSTEM CURRENT AND FUTURE TYPE ANALYSIS, 2025–2034, (USD MILLION)
FIGURE 68 FRANCE AI TRAINING DATASET SYSTEM CURRENT AND FUTURE END USER ANALYSIS, 2025–2034, (USD MILLION)
FIGURE 69 UK AI TRAINING DATASET SYSTEM CURRENT AND FUTURE TYPE ANALYSIS, 2025–2034, (USD MILLION)
FIGURE 70 UK AI TRAINING DATASET SYSTEM CURRENT AND FUTURE END USER ANALYSIS, 2025–2034, (USD MILLION)
FIGURE 71 SPAIN AI TRAINING DATASET SYSTEM CURRENT AND FUTURE TYPE ANALYSIS, 2025–2034, (USD MILLION)
FIGURE 72 SPAIN AI TRAINING DATASET SYSTEM CURRENT AND FUTURE END USER ANALYSIS, 2025–2034, (USD MILLION)
FIGURE 73 ITALY AI TRAINING DATASET SYSTEM CURRENT AND FUTURE TYPE ANALYSIS, 2025–2034, (USD MILLION)
FIGURE 74 ITALY AI TRAINING DATASET SYSTEM CURRENT AND FUTURE END USER ANALYSIS, 2025–2034, (USD MILLION)
FIGURE 75 REST OF WESTERN EUROPE AI TRAINING DATASET SYSTEM CURRENT AND FUTURE TYPE ANALYSIS, 2025–2034, (USD MILLION)
FIGURE 76 REST OF WESTERN EUROPE AI TRAINING DATASET SYSTEM CURRENT AND FUTURE END USER ANALYSIS, 2025–2034, (USD MILLION)
FIGURE 77 EAST ASIA AND PACIFIC AI TRAINING DATASET SYSTEM CURRENT AND FUTURE MARKET VOLUME SHARE REGIONAL ANALYSIS, 2025–2034, (USD MILLION)
FIGURE 78 CHINA AI TRAINING DATASET SYSTEM CURRENT AND FUTURE TYPE ANALYSIS, 2025–2034, (USD MILLION)
FIGURE 79 CHINA AI TRAINING DATASET SYSTEM CURRENT AND FUTURE END USER ANALYSIS, 2025–2034, (USD MILLION)
FIGURE 80 JAPAN AI TRAINING DATASET SYSTEM CURRENT AND FUTURE TYPE ANALYSIS, 2025–2034, (USD MILLION)
FIGURE 81 JAPAN AI TRAINING DATASET SYSTEM CURRENT AND FUTURE END USER ANALYSIS, 2025–2034, (USD MILLION)
FIGURE 82 AUSTRALIA AI TRAINING DATASET SYSTEM CURRENT AND FUTURE TYPE ANALYSIS, 2025–2034, (USD MILLION)
FIGURE 83 AUSTRALIA AI TRAINING DATASET SYSTEM CURRENT AND FUTURE END USER ANALYSIS, 2025–2034, (USD MILLION)
FIGURE 84 CAMBODIA AI TRAINING DATASET SYSTEM CURRENT AND FUTURE TYPE ANALYSIS, 2025–2034, (USD MILLION)
FIGURE 85 CAMBODIA AI TRAINING DATASET SYSTEM CURRENT AND FUTURE END USER ANALYSIS, 2025–2034, (USD MILLION)
FIGURE 86 FIJI AI TRAINING DATASET SYSTEM CURRENT AND FUTURE TYPE ANALYSIS, 2025–2034, (USD MILLION)
FIGURE 87 FIJI AI TRAINING DATASET SYSTEM CURRENT AND FUTURE END USER ANALYSIS, 2025–2034, (USD MILLION)
FIGURE 88 INDONESIA AI TRAINING DATASET SYSTEM CURRENT AND FUTURE TYPE ANALYSIS, 2025–2034, (USD MILLION)
FIGURE 89 INDONESIA AI TRAINING DATASET SYSTEM CURRENT AND FUTURE END USER ANALYSIS, 2025–2034, (USD MILLION)
FIGURE 90 SOUTH KOREA AI TRAINING DATASET SYSTEM CURRENT AND FUTURE TYPE ANALYSIS, 2025–2034, (USD MILLION)
FIGURE 91 SOUTH KOREA AI TRAINING DATASET SYSTEM CURRENT AND FUTURE END USER ANALYSIS, 2025–2034, (USD MILLION)
FIGURE 92 REST OF EAST ASIA AND PACIFIC AI TRAINING DATASET SYSTEM CURRENT AND FUTURE TYPE ANALYSIS, 2025–2034, (USD MILLION)
FIGURE 93 REST OF EAST ASIA AND PACIFIC AI TRAINING DATASET SYSTEM CURRENT AND FUTURE END USER ANALYSIS, 2025–2034, (USD MILLION)
FIGURE 94 SEA AND SOUTH ASIA AI TRAINING DATASET SYSTEM CURRENT AND FUTURE MARKET VOLUME SHARE REGIONAL ANALYSIS, 2025–2034, (USD MILLION)
FIGURE 95 BANGLADESH AI TRAINING DATASET SYSTEM CURRENT AND FUTURE TYPE ANALYSIS, 2025–2034, (USD MILLION)
FIGURE 96 BANGLADESH AI TRAINING DATASET SYSTEM CURRENT AND FUTURE END USER ANALYSIS, 2025–2034, (USD MILLION)
FIGURE 97 NEW ZEALAND AI TRAINING DATASET SYSTEM CURRENT AND FUTURE TYPE ANALYSIS, 2025–2034, (USD MILLION)
FIGURE 98 NEW ZEALAND AI TRAINING DATASET SYSTEM CURRENT AND FUTURE END USER ANALYSIS, 2025–2034, (USD MILLION)
FIGURE 99 INDIA AI TRAINING DATASET SYSTEM CURRENT AND FUTURE TYPE ANALYSIS, 2025–2034, (USD MILLION)
FIGURE 100 INDIA AI TRAINING DATASET SYSTEM CURRENT AND FUTURE END USER ANALYSIS, 2025–2034, (USD MILLION)
FIGURE 101 SINGAPORE AI TRAINING DATASET SYSTEM CURRENT AND FUTURE TYPE ANALYSIS, 2025–2034, (USD MILLION)
FIGURE 102 SINGAPORE AI TRAINING DATASET SYSTEM CURRENT AND FUTURE END USER ANALYSIS, 2025–2034, (USD MILLION)
FIGURE 103 THAILAND AI TRAINING DATASET SYSTEM CURRENT AND FUTURE TYPE ANALYSIS, 2025–2034, (USD MILLION)
FIGURE 104 THAILAND AI TRAINING DATASET SYSTEM CURRENT AND FUTURE END USER ANALYSIS, 2025–2034, (USD MILLION)
FIGURE 105 TAIWAN AI TRAINING DATASET SYSTEM CURRENT AND FUTURE TYPE ANALYSIS, 2025–2034, (USD MILLION)
FIGURE 106 TAIWAN AI TRAINING DATASET SYSTEM CURRENT AND FUTURE END USER ANALYSIS, 2025–2034, (USD MILLION)
FIGURE 107 MALAYSIA AI TRAINING DATASET SYSTEM CURRENT AND FUTURE TYPE ANALYSIS, 2025–2034, (USD MILLION)
FIGURE 108 MALAYSIA AI TRAINING DATASET SYSTEM CURRENT AND FUTURE END USER ANALYSIS, 2025–2034, (USD MILLION)
FIGURE 109 REST OF SEA AND SOUTH ASIA AI TRAINING DATASET SYSTEM CURRENT AND FUTURE TYPE ANALYSIS, 2025–2034, (USD MILLION)
FIGURE 110 REST OF SEA AND SOUTH ASIA AI TRAINING DATASET SYSTEM CURRENT AND FUTURE END USER ANALYSIS, 2025–2034, (USD MILLION)
FIGURE 111 MIDDLE EAST AND AFRICA AI TRAINING DATASET SYSTEM CURRENT AND FUTURE MARKET VOLUME SHARE REGIONAL ANALYSIS, 2025–2034, (USD MILLION)
FIGURE 112 GCC COUNTRIES AI TRAINING DATASET SYSTEM CURRENT AND FUTURE TYPE ANALYSIS, 2025–2034, (USD MILLION)
FIGURE 113 GCC COUNTRIES AI TRAINING DATASET SYSTEM CURRENT AND FUTURE END USER ANALYSIS, 2025–2034, (USD MILLION)
FIGURE 114 SAUDI ARABIA AI TRAINING DATASET SYSTEM CURRENT AND FUTURE TYPE ANALYSIS, 2025–2034, (USD MILLION)
FIGURE 115 SAUDI ARABIA AI TRAINING DATASET SYSTEM CURRENT AND FUTURE END USER ANALYSIS, 2025–2034, (USD MILLION)
FIGURE 116 UAE AI TRAINING DATASET SYSTEM CURRENT AND FUTURE TYPE ANALYSIS, 2025–2034, (USD MILLION)
FIGURE 117 UAE AI TRAINING DATASET SYSTEM CURRENT AND FUTURE END USER ANALYSIS, 2025–2034, (USD MILLION)
FIGURE 118 BAHRAIN AI TRAINING DATASET SYSTEM CURRENT AND FUTURE TYPE ANALYSIS, 2025–2034, (USD MILLION)
FIGURE 119 BAHRAIN AI TRAINING DATASET SYSTEM CURRENT AND FUTURE END USER ANALYSIS, 2025–2034, (USD MILLION)
FIGURE 120 KUWAIT AI TRAINING DATASET SYSTEM CURRENT AND FUTURE TYPE ANALYSIS, 2025–2034, (USD MILLION)
FIGURE 121 KUWAIT AI TRAINING DATASET SYSTEM CURRENT AND FUTURE END USER ANALYSIS, 2025–2034, (USD MILLION)
FIGURE 122 OMAN AI TRAINING DATASET SYSTEM CURRENT AND FUTURE TYPE ANALYSIS, 2025–2034, (USD MILLION)
FIGURE 123 OMAN AI TRAINING DATASET SYSTEM CURRENT AND FUTURE END USER ANALYSIS, 2025–2034, (USD MILLION)
FIGURE 124 QATAR AI TRAINING DATASET SYSTEM CURRENT AND FUTURE TYPE ANALYSIS, 2025–2034, (USD MILLION)
FIGURE 125 QATAR AI TRAINING DATASET SYSTEM CURRENT AND FUTURE END USER ANALYSIS, 2025–2034, (USD MILLION)
FIGURE 126 EGYPT AI TRAINING DATASET SYSTEM CURRENT AND FUTURE TYPE ANALYSIS, 2025–2034, (USD MILLION)
FIGURE 127 EGYPT AI TRAINING DATASET SYSTEM CURRENT AND FUTURE END USER ANALYSIS, 2025–2034, (USD MILLION)
FIGURE 128 NIGERIA AI TRAINING DATASET SYSTEM CURRENT AND FUTURE TYPE ANALYSIS, 2025–2034, (USD MILLION)
FIGURE 129 NIGERIA AI TRAINING DATASET SYSTEM CURRENT AND FUTURE END USER ANALYSIS, 2025–2034, (USD MILLION)
FIGURE 130 SOUTH AFRICA AI TRAINING DATASET SYSTEM CURRENT AND FUTURE TYPE ANALYSIS, 2025–2034, (USD MILLION)
FIGURE 131 SOUTH AFRICA AI TRAINING DATASET SYSTEM CURRENT AND FUTURE END USER ANALYSIS, 2025–2034, (USD MILLION)
FIGURE 132 ISRAEL AI TRAINING DATASET SYSTEM CURRENT AND FUTURE TYPE ANALYSIS, 2025–2034, (USD MILLION)
FIGURE 133 ISRAEL AI TRAINING DATASET SYSTEM CURRENT AND FUTURE END USER ANALYSIS, 2025–2034, (USD MILLION)
FIGURE 134 REST OF MEA AI TRAINING DATASET SYSTEM CURRENT AND FUTURE TYPE ANALYSIS, 2025–2034, (USD MILLION)
FIGURE 135 REST OF MEA AI TRAINING DATASET SYSTEM CURRENT AND FUTURE END USER ANALYSIS, 2025–2034, (USD MILLION)
FIGURE 136 U. S. MARKET SHARE ANALYSIS BY TYPE (2024)
FIGURE 137 U. S. MARKET SHARE ANALYSIS BY END USER (2024)
FIGURE 138 CANADA MARKET SHARE ANALYSIS BY TYPE (2024)
FIGURE 139 CANADA MARKET SHARE ANALYSIS BY END USER (2024)
FIGURE 140 MEXICO MARKET SHARE ANALYSIS BY TYPE (2024)
FIGURE 141 MEXICO MARKET SHARE ANALYSIS BY END USER (2024)
FIGURE 142 CHINA MARKET SHARE ANALYSIS BY TYPE (2024)
FIGURE 143 CHINA MARKET SHARE ANALYSIS BY END USER (2024)
FIGURE 144 JAPAN MARKET SHARE ANALYSIS BY TYPE (2024)
FIGURE 145 JAPAN MARKET SHARE ANALYSIS BY END USER (2024)
FIGURE 146 INDIA MARKET SHARE ANALYSIS BY TYPE (2024)
FIGURE 147 INDIA MARKET SHARE ANALYSIS BY END USER (2024)
FIGURE 148 SOUTH KOREA MARKET SHARE ANALYSIS BY TYPE (2024)
FIGURE 149 SOUTH KOREA MARKET SHARE ANALYSIS BY END USER (2024)
FIGURE 150 SAUDI ARABIA MARKET SHARE ANALYSIS BY TYPE (2024)
FIGURE 151 SAUDI ARABIA MARKET SHARE ANALYSIS BY END USER (2024)
FIGURE 152 UAE MARKET SHARE ANALYSIS BY TYPE (2024)
FIGURE 153 UAE MARKET SHARE ANALYSIS BY END USER (2024)
FIGURE 154 EGYPT MARKET SHARE ANALYSIS BY TYPE (2024)
FIGURE 155 EGYPT MARKET SHARE ANALYSIS BY END USER (2024)
FIGURE 156 NIGERIA MARKET SHARE ANALYSIS BY TYPE (2024)
FIGURE 157 NIGERIA MARKET SHARE ANALYSIS BY END USER (2024)
FIGURE 158 SOUTH AFRICA MARKET SHARE ANALYSIS BY TYPE (2024)
FIGURE 159 SOUTH AFRICA MARKET SHARE ANALYSIS BY END USER (2024)
FIGURE 160 GERMANY MARKET SHARE ANALYSIS BY TYPE (2024)
FIGURE 161 GERMANY MARKET SHARE ANALYSIS BY END USER (2024)
FIGURE 162 FRANCE MARKET SHARE ANALYSIS BY TYPE (2024)
FIGURE 163 FRANCE MARKET SHARE ANALYSIS BY END USER (2024)
FIGURE 164 UK MARKET SHARE ANALYSIS BY TYPE (2024)
FIGURE 165 UK MARKET SHARE ANALYSIS BY END USER (2024)
FIGURE 166 SPAIN MARKET SHARE ANALYSIS BY TYPE (2024)
FIGURE 167 SPAIN MARKET SHARE ANALYSIS BY END USER (2024)
FIGURE 168 ITALY MARKET SHARE ANALYSIS BY TYPE (2024)
FIGURE 169 ITALY MARKET SHARE ANALYSIS BY END USER (2024)
FIGURE 170 BRAZIL MARKET SHARE ANALYSIS BY TYPE (2024)
FIGURE 171 BRAZIL MARKET SHARE ANALYSIS BY END USER (2024)
FIGURE 172 ARGENTINA MARKET SHARE ANALYSIS BY TYPE (2024)
FIGURE 173 ARGENTINA MARKET SHARE ANALYSIS BY END USER (2024)
FIGURE 174 COLUMBIA MARKET SHARE ANALYSIS BY TYPE (2024)
FIGURE 175 COLUMBIA MARKET SHARE ANALYSIS BY END USER (2024)
FIGURE 176 GLOBAL AI TRAINING DATASET SYSTEM CURRENT AND FUTURE MARKET KEY COUNTRY LEVEL ANALYSIS, 2024–2034, (USD MILLION)
FIGURE 177 FINANCIAL OVERVIEW:
Key Player Analysis
Alegion:Positioning: Innovator/Niche Specialist. Alegion focuses on complex, enterprise-grade data collection and annotation for computer vision and NLP, with managed workforces and quality-first workflows designed for safety-critical use cases. The company emphasizes high-fidelity labeling, project governance, and domain expertise (e.g., retail analytics, manufacturing inspection, healthcare imaging), enabling buyers to operationalize data-centric AI in 2025 without scaling internal teams. Its differentiation stems from services depth rather than tooling alone—packaged consulting, QA escalation paths, and program management that reduce iteration cycles and improve ground-truth reliability across multimodal pipelines.
Amazon Web Services, Inc.:Positioning: Ecosystem Leader. AWS anchors the dataset supply chain via Amazon SageMaker Data Labeling—Ground Truth and Ground Truth Plus—combining automated labeling (active learning) with managed expert workforces; Ground Truth Plus advertises up to 40% cost reduction versus do-it-yourself operations. The 2024/2025 SageMaker refresh consolidates data prep, training, and GenAI development, while AWS Data Exchange and the Registry of Open Data expand access to 3,000+ commercial and open datasets through a single marketplace. Together, these assets make AWS a de facto control plane for dataset sourcing, labeling, and governance across regulated industries.
AWS (continued): In 2025, AWS is also scaling physical infrastructure to meet AI demand—committing ~USD 11 billion to new data center capacity in Georgia—supporting customers’ data-intensive training and evaluation workloads. The breadth of services and global reach allow AWS to bundle compute, storage, security, and data procurement, creating switching costs and reinforcing its leadership in the AI training dataset value chain.
Appen Limited:Positioning: Challenger in Turnaround. Appen remains one of the best-known global providers of annotated data for vision, speech, and LLM alignment, but enters 2025 in restructuring mode. The company reported FY2024 revenue of ~US$234.3 million (-14.2% YoY) and a net loss of ~US$20 million, with management highlighting weaker early-2025 project volumes; shares fell ~33% on the update. Appen’s balance sheet showed ~US$55 million cash and no debt (Feb 2025), providing flexibility to continue cost actions while refocusing on higher-margin GenAI programs.
Appen (continued): Strategically, Appen is concentrating on productized offerings (e.g., safety tuning, multilingual speech, and evaluation sets) and selective growth in regions with resilient demand, aiming to reduce revenue volatility tied to mega-customers. Execution on governance, licensing provenance, and RLHF-grade quality will determine whether the firm reclaims share in a market increasingly rewarding accuracy, compliance, and speed to delivery.
Cogito Tech LLC:Positioning: Innovator/Disruptor (mid-market). Cogito provides end-to-end annotation and curation with “Global Innovation Hubs,” offering domain-specific teams for computer vision, NLP, and RLHF services (including red-teaming) tailored to enterprise GenAI rollouts. Its differentiators are precision workflows, multilingual coverage, and compliance-ready operations that appeal to buyers in healthcare, automotive, and financial services seeking auditability and demographic representativeness in 2025.
Cogito (continued): The company’s strategy emphasizes rapid program ramp, iterative QA, and flexible pricing models to compress labeling cycles for multimodal and safety-critical datasets. By pairing curated workforces with playbooks for feedback alignment and bias testing, Cogito positions itself as a partner for enterprises prioritizing model quality over raw data volume—an increasingly important distinction as data-centric AI maturity rises.
Key Market Players
Google
Amazon Web Services (AWS)
Microsoft
Appen
Scale AI
Alegion
Deep Vision Data
Cogito Tech
Lionbridge
Samasource (Sama)
Driver:
AI Scaling and Enterprise Demand Driving Rapid Growth in Training Data
As of 2025, enterprises are moving from AI pilots to scaled deployments, driving sustained demand for high-quality, rights-cleared training data. The market’s expansion—from USD 2.6 billion in 2024 toward roughly USD 18.9 billion by 2034 (22.2% CAGR)—is underpinned by multimodal and generative AI use cases that require large, diverse, and frequently refreshed corpora. Vision-heavy workflows remain a core engine (Image/Video held ~41.2% share in 2024), while IT buyers—responsible for over 34% of spend—standardize governance and evaluation pipelines across cloud and on-prem estates. Strategically, vendors that combine scale with provenance, bias control, and audit-ready documentation are best positioned to win long-cycle enterprise contracts and capture premium pricing.
Restraint:
Data Rights, Privacy, and Governance Regulations Slowing Market Expansion
Data rights, privacy, and emerging AI governance are becoming material speed limits on growth. Cross-border transfers, consent management, and license provenance increase cycle times and costs, with re-licensing and privacy-preserving transforms often adding a low-double-digit percentage to program budgets. The U.S. market’s 17.9% CAGR to 2034—below the global 22.2%—signals maturity and compliance headwinds despite North America’s 35.5% share (USD 0.9 billion in 2024). Strategically, players that cannot evidence content origin, demographic representativeness, and regulatory alignment risk procurement exclusion, slower deal velocity, and elevated legal exposure.
Opportunity:
Synthetic Data and Simulation Frameworks Creating the Strongest Growth Opportunities
Synthetic data and simulation frameworks are emerging as the highest-growth monetization lanes, particularly for safety-critical and privacy-sensitive domains (automotive, healthcare, fintech). As enterprises target edge-case coverage and domain adaptation, demand is shifting to toolchains that blend real and synthetic data, employ active learning, and offer scenario libraries; these categories are tracking mid-20s to ~30% CAGRs through 2030 in many planning cases. Regionally, Asia Pacific—buoyed by data center buildouts and national AI programs—stands to capture an outsized share of the ~USD 16.3 billion global spend added by 2034, with multilingual and low-resource language assets creating defensible niches and higher margins.
Trend:
Shift Toward Data-Centric AI Transforming Procurement and Operating Models
A decisive pivot to “data-centric AI” is reshaping procurement and operating models. Enterprises are prioritizing dataset quality over volume, adopting automated QA, weak supervision, and labeling ops that can trim annotation costs by 15–25% while improving model robustness. Multimodal pipelines (text-vision-audio) and retrieval-augmented/feedback alignment sets are becoming standard in 2025 roadmaps, reinforcing the leadership of Image/Video while elevating speech and enterprise text assets. In parallel, cloud-delivered data platforms with embedded lineage, consent tracking, and model-ready formatting are becoming table stakes—accelerating time-to-value for buyers and favoring vendors that deliver end-to-end, compliance-first data supply chains.
Recent Developments
Dec 2024 – Amazon Web Services (AWS): At re: Invent 2024, AWS unveiled the next-generation Amazon SageMaker (including Data & AI Governance with data lineage GA), introduced EC2 Trn2 instances touting up to 4× faster training performance, and expanded Amazon Bedrock Marketplace to 100+ foundation models—tightening integration from data prep to model evaluation. Strategic impact: Positions AWS as an end-to-end control plane for dataset sourcing, governance, and training at scale, compressing time-to-value for enterprise AI programs.
Feb 2025 – Appen Limited: Appen reported FY2024 operating revenue of USD 234.3 million (-14.2% YoY) following the termination of a major tech contract, narrowed its statutory loss to ~USD 20 million, and returned to USD 3.5 million in underlying EBITDA; FY2025 guidance targets USD 235–260 million revenue and positive underlying EBITDA. Strategic impact: A leaner cost base and pivot to GenAI projects (with China and product lines growing) aim to stabilize volumes and rebuild mix away from single-customer dependence.
Apr 2025 – Microsoft: Microsoft Research (Asia) introduced PIKE-RAG, an industrial retrieval framework emphasizing domain-specific data pipelines for LLM applications, advancing techniques to structure, curate, and evaluate high-value corpora for enterprise use. Strategic impact: Enhances Microsoft’s ability to bundle tooling and best-practice data workflows around Azure AI, lowering customers’ labeled-data burden in regulated and specialized domains. (
Jul 2025 – Google (Kaggle): Kaggle launched Kaggle Benchmarks, a platform for rigorous GenAI evaluation with open documentation and public leaderboards—enabling labs and enterprises to publish, run, and compare standardized tests across models. Strategic impact: Raises the bar on dataset-adjacent evaluation transparency, steering procurement toward vendors that can demonstrate measurable gains on trusted benchmarks.
Aug 2025 – Google DeepMind & Kaggle: The teams introduced Kaggle Game Arena, a public benchmarking environment where AI agents compete head-to-head in strategy games (e.g., chess), offering dynamic, reproducible assessments beyond static benchmarks. Strategic impact: Shifts industry focus from one-off dataset scores to continuous, adversarial evaluation—pressuring dataset providers to deliver higher-quality, provenance-attested corpora that sustain model robustness over time.
Sep 2025 – Scale AI Inc.: Scale AI secured a five-year DoD agreement with a ceiling of USD 100 million to deliver AI-ready data on top-secret networks, with an initial USD 40.7 million task order; the award follows an ~USD 99.5 million U.S. Army R&D contract in Aug 2025. Strategic impact: Deepens Scale’s moat in defense and secure data operations, expanding recurring government pipelines and reinforcing its pivot from pure labeling to mission-grade data infrastructure.
Frequently Asked Questions
How big is the AI Training Dataset Market?
The AI Training Dataset Market will rise from USD 3.6B in 2024 to USD 20.9B by 2034, driven by multimodal data demand, enterprise-scale ML adoption, and strong growth in North America and APAC.
Who are the major players in the AI Training Dataset Market?
Google, Amazon Web Services (AWS), Microsoft, Appen, Scale AI, Alegion, Deep Vision Data, Cogito Tech, Lionbridge, Samasource (Sama)
Which segments covered the AI Training Dataset Market?
By Type (Text, Image & Video, Audio), By Vertical (IT, Automotive, Government, Healthcare, BFSI, Retail & E-commerce, Others)
How can this market research report help my business make strategic decisions?
Our market research reports provide actionable intelligence, including verified market size data, CAGR projections, competitive benchmarking, and segment-level opportunity analysis. These insights support strategic planning, investment decisions, product development, and market entry strategies for enterprises and startups alike.
How frequently is the data updated?
We continuously monitor industry developments and update our reports to reflect regulatory changes, technological advancements, and macroeconomic shifts. Updated editions ensure you receive the latest market intelligence.