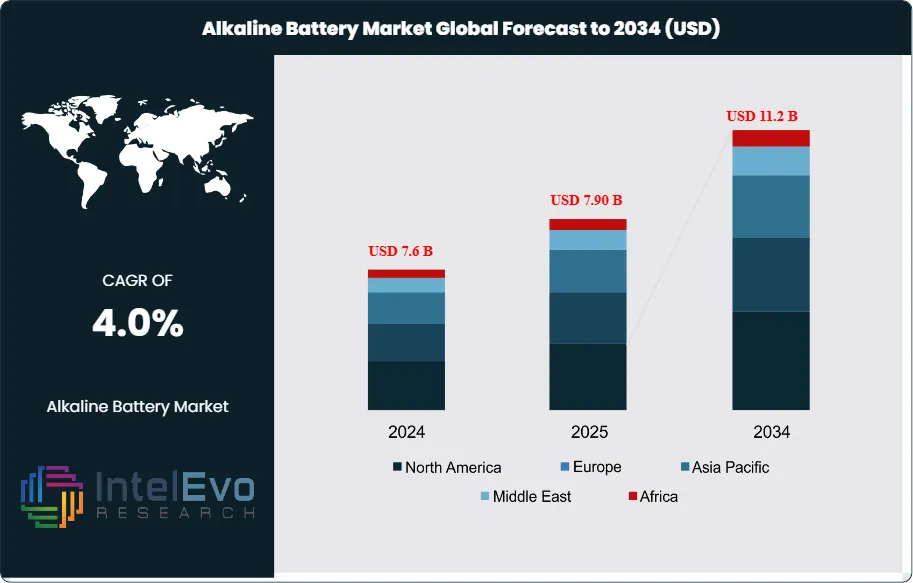
The Alkaline Battery Market is estimated at USD 7.6 billion in 2024 and is projected to reach approximately USD 11.2 billion by 2034, registering a compound annual growth rate (CAGR) of about 4.0% during 2025–2034. This steady expansion is driven by sustained demand from consumer electronics, remote controls, toys, flashlights, and emergency backup devices, particularly in regions with limited access to rechargeable alternatives. Growing preference for low-cost, long-shelf-life power sources, along with continued use in healthcare devices and industrial instrumentation, is reinforcing baseline demand. In addition, retail penetration in emerging markets and incremental improvements in battery chemistry are helping alkaline batteries remain relevant despite rising adoption of rechargeable technologies.
This steady expansion reflects the continued relevance of alkaline batteries in consumer electronics, household devices, and industrial applications despite the rapid growth of rechargeable chemistries. Historically, alkaline batteries have maintained a dominant share of the primary battery segment due to their higher energy density, longer shelf life, and consistent 1.5-volt output compared with zinc-carbon alternatives. Over the past decade, demand has remained resilient, supported by rising consumption of portable devices and the need for reliable, low-maintenance power sources in both developed and emerging markets.
Growth is being driven by several demand-side factors. Rising household penetration of electronic toys, remote controls, flashlights, and medical devices continues to sustain baseline consumption. On the supply side, improvements in electrode materials, particularly the use of high-purity manganese dioxide, have enhanced performance and extended product life. Regulatory pressures on battery disposal and recycling, however, present challenges, particularly in Europe where compliance costs are rising. Price volatility in raw materials such as zinc and manganese also remains a risk for manufacturers, potentially impacting margins in a competitive market.
Technological progress is shaping adoption patterns. While alkaline batteries are a mature product, advances in manufacturing efficiency and packaging have improved energy density, now averaging 6.5 watt hours per cubic inch. At the same time, the broader energy storage sector is attracting significant investment. For example, Form Energy secured a USD 12 million grant in 2023 to develop a 10 MW/1000 MWh iron-air system, highlighting how capital flows into adjacent technologies can influence long-term competitive dynamics. Although such large-scale storage systems do not directly compete with alkaline batteries, they signal a shift in investor attention toward diversified chemistries.
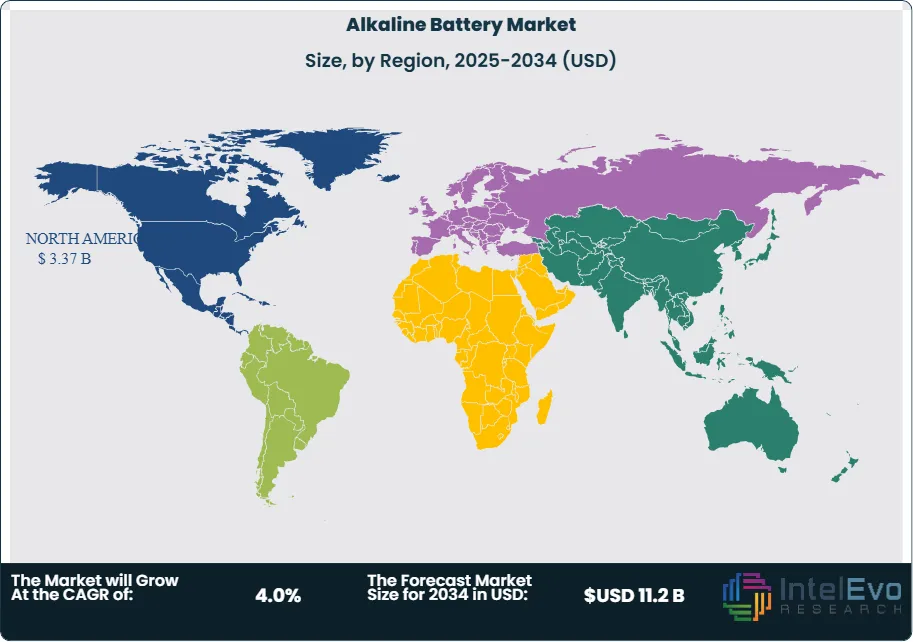
Regionally, North America and Europe remain the largest markets, supported by high per-capita consumption and established retail distribution networks. Asia-Pacific is emerging as the fastest-growing region, driven by population growth, urbanization, and rising disposable incomes in countries such as India and China. Investors should monitor Asia-Pacific closely, as expanding consumer markets and local manufacturing capacity are expected to create new opportunities for both global and regional players. The market outlook points to stable growth, with alkaline batteries retaining their role as a cost-effective and widely accessible power source through 2034.
Key Takeaways
Market Growth: The global alkaline battery market is projected to expand from USD 7.6 billion in 2024 to USD 11.2 billion by 2034, reflecting a CAGR of 4.0% over 2025–2034. Growth is supported by sustained demand in consumer electronics and household devices requiring reliable, disposable power sources.
Battery Type: Primary alkaline batteries accounted for 76.3% of total revenues in 2024, underscoring their continued preference over rechargeable formats due to low upfront cost, long shelf life, and widespread retail availability.
Product Size: AA batteries held a commanding 58.3% share of the market in 2024. Their dominance is linked to high usage in toys, remote controls, and portable medical devices, making them the most commercially significant format.
Driver: Rising global consumption of consumer electronics is a key growth driver. In 2024, the consumer electronics segment represented 48.3% of alkaline battery demand, reflecting the sector’s reliance on disposable power for small devices.
Restraint: Regulatory pressures on battery disposal and recycling are tightening, particularly in Europe. Compliance costs and environmental restrictions are expected to weigh on margins, limiting profitability for manufacturers.
Opportunity: Asia-Pacific presents the strongest growth potential, with rising disposable incomes and expanding retail distribution networks. The region is projected to outpace the global CAGR, creating new opportunities for both multinational and regional suppliers.
Trend: Advances in electrode materials, including high-purity manganese dioxide, have improved energy density to an average of 6.5 watt hours per cubic inch. At the same time, investments in alternative chemistries, such as Form Energy’s USD 12 million iron-air project in 2023, highlight how capital flows are reshaping the broader energy storage landscape.
Regional Analysis: North America led the market in 2024 with a 44.3% share, equivalent to USD 2.8 billion in revenues, supported by high per-capita consumption and established retail channels. Asia-Pacific is emerging as the fastest-growing region, while Europe remains constrained by stringent recycling mandates.
Type Analysis
The alkaline battery market in 2025 continues to be dominated by primary batteries, which accounted for more than 76% of total revenues in 2024. Their widespread use in consumer electronics, toys, and household devices reflects their affordability, convenience, and broad retail availability. Unlike rechargeable alternatives, primary batteries remain the preferred choice for applications requiring short-term but reliable power, particularly in low- to medium-drain devices.
Demand for primary batteries is expected to remain steady through the forecast period, supported by the rising penetration of portable electronics and the continued reliance on disposable power solutions in emerging markets. While secondary alkaline batteries are gaining traction in niche applications, their adoption remains limited due to higher upfront costs and competition from lithium-ion technologies. As a result, the primary battery category is projected to retain its leadership position, with incremental growth driven by both consumer demand and distribution expansion in Asia-Pacific and Latin America.
Size Analysis
AA batteries held a commanding 58.3% share of the alkaline battery market in 2024, underscoring their role as the most widely used format across household and consumer devices. Their balance of compact size and consistent 1.5-volt output makes them the default choice for remote controls, wireless peripherals, toys, and small medical devices. This segment benefits from high replacement cycles, ensuring recurring demand across both developed and emerging economies.
Looking ahead, AA batteries are expected to maintain their dominance as sales of portable consumer electronics continue to expand. The segment also benefits from improvements in energy density, with modern AA alkaline batteries offering longer lifespans and reduced leakage risks. AAA and 9-volt batteries will continue to serve specific applications, but their combined share remains significantly smaller compared with AA, which will remain the volume driver of the industry through 2034.
Application Analysis
Consumer electronics accounted for 48.3% of alkaline battery demand in 2024, making it the largest application segment. Devices such as remote controls, digital cameras, wireless keyboards, and portable audio systems continue to rely heavily on disposable alkaline batteries due to their cost-effectiveness and wide availability. The segment’s growth is closely tied to the rising adoption of wireless and portable technologies, particularly in Asia-Pacific and North America.
Other applications, including toys, radios, and small household appliances, also contribute significantly to demand. The toy industry, in particular, represents a recurring source of consumption, with seasonal sales peaks driving battery replacement cycles. As the global installed base of portable devices expands, alkaline batteries will remain a critical power source, even as rechargeable chemistries gain ground in higher-drain applications.
By Region
North America led the global alkaline battery market in 2024 with a 44.3% share, equivalent to USD 2.8 billion in revenues. The region’s dominance is supported by high per-capita consumption of consumer electronics, advanced retail infrastructure, and strong brand presence. The U.S. remains the largest contributor, driven by widespread adoption of portable devices and consumer preference for high-performance, long-lasting batteries.
Europe follows as a mature market, where regulatory frameworks around recycling and environmental compliance are shaping product development and distribution strategies. Asia-Pacific, however, is emerging as the fastest-growing region, supported by rising disposable incomes, urbanization, and expanding retail networks in countries such as China and India. Latin America and the Middle East & Africa represent smaller but growing markets, where increasing consumer electronics penetration is expected to drive incremental demand. Collectively, these regional dynamics point to stable global growth, with Asia-Pacific offering the strongest expansion opportunities through 2034.
Customization for segments, region/country-level will be provided. Moreover, additional customization can be done based on the requirements.
Pricing and Purchase Options
Avail customized purchase options to meet your exact research needs. We have three licenses to opt for: Single User License, Multi-User License (Up to 5 Users), Corporate Use License (Unlimited User and Printable PDF).
TABLE OF CONTENTS
1. EXECUTIVE SUMMARY
1.1. MARKET SNAPSHOT
1.2. KEY FINDINGS & INSIGHTS
1.3. ANALYST RECOMMENDATIONS
1.4. FUTURE OUTLOOK
2. RESEARCH METHODOLOGY
2.1. MARKET DEFINITION & SCOPE
2.2. RESEARCH OBJECTIVES: PRIMARY & SECONDARY DATA SOURCES
2.3. DATA COLLECTION SOURCES
2.3.1. COVERAGE OF 100+ PRIMARY RESEARCH/CONSULTATION CALLS WITH INDUSTRY STAKEHOLDERS
FIGURE 17 NORTH AMERICA ALKALINE BATTERY CURRENT AND FUTURE TYPE ANALYSIS, 2025–2034, (USD MILLION)
FIGURE 18 NORTH AMERICA ALKALINE BATTERY CURRENT AND FUTURE END USER ANALYSIS, 2025–2034, (USD MILLION)
FIGURE 19 MARKET SHARE BY COUNTRY
FIGURE 20 LATIN AMERICA ALKALINE BATTERY CURRENT AND FUTURE TYPE ANALYSIS, 2025–2034, (USD MILLION)
FIGURE 21 LATIN AMERICA ALKALINE BATTERY CURRENT AND FUTURE END USER ANALYSIS, 2025–2034, (USD MILLION)
FIGURE 22 MARKET SHARE BY COUNTRY
FIGURE 23 EASTERN EUROPE ALKALINE BATTERY CURRENT AND FUTURE TYPE ANALYSIS, 2025–2034, (USD MILLION)
FIGURE 24 EASTERN EUROPE ALKALINE BATTERY CURRENT AND FUTURE END USER ANALYSIS, 2025–2034, (USD MILLION)
FIGURE 25 MARKET SHARE BY COUNTRY
FIGURE 26 WESTERN EUROPE ALKALINE BATTERY CURRENT AND FUTURE TYPE ANALYSIS, 2025–2034, (USD MILLION)
FIGURE 27 WESTERN EUROPE ALKALINE BATTERY CURRENT AND FUTURE END USER ANALYSIS, 2025–2034, (USD MILLION)
FIGURE 28 MARKET SHARE BY COUNTRY
FIGURE 29 EAST ASIA AND PACIFIC ALKALINE BATTERY CURRENT AND FUTURE TYPE ANALYSIS, 2025–2034, (USD MILLION)
FIGURE 30 EAST ASIA AND PACIFIC ALKALINE BATTERY CURRENT AND FUTURE END USER ANALYSIS, 2025–2034, (USD MILLION)
FIGURE 31 MARKET SHARE BY COUNTRY
FIGURE 32 SEA AND SOUTH ASIA ALKALINE BATTERY CURRENT AND FUTURE TYPE ANALYSIS, 2025–2034, (USD MILLION)
FIGURE 33 SEA AND SOUTH ASIA ALKALINE BATTERY CURRENT AND FUTURE END USER ANALYSIS, 2025–2034, (USD MILLION)
FIGURE 34 MARKET SHARE BY COUNTRY
FIGURE 35 MIDDLE EAST AND AFRICA ALKALINE BATTERY CURRENT AND FUTURE TYPE ANALYSIS, 2025–2034, (USD MILLION)
FIGURE 36 MIDDLE EAST AND AFRICA ALKALINE BATTERY CURRENT AND FUTURE END USER ANALYSIS, 2025–2034, (USD MILLION)
FIGURE 37 NORTH AMERICA ALKALINE BATTERY CURRENT AND FUTURE MARKET VOLUME SHARE REGIONAL ANALYSIS, 2025–2034, (USD MILLION)
FIGURE 38 U.S. ALKALINE BATTERY CURRENT AND FUTURE TYPE ANALYSIS, 2025–2034, (USD MILLION)
FIGURE 39 U.S. ALKALINE BATTERY CURRENT AND FUTURE END USER ANALYSIS, 2025–2034, (USD MILLION)
FIGURE 40 CANADA ALKALINE BATTERY CURRENT AND FUTURE TYPE ANALYSIS, 2025–2034, (USD MILLION)
FIGURE 41 CANADA ALKALINE BATTERY CURRENT AND FUTURE END USER ANALYSIS, 2025–2034, (USD MILLION)
FIGURE 42 LATIN AMERICA ALKALINE BATTERY CURRENT AND FUTURE MARKET VOLUME SHARE REGIONAL ANALYSIS, 2025–2034, (USD MILLION)
FIGURE 43 MEXICO ALKALINE BATTERY CURRENT AND FUTURE TYPE ANALYSIS, 2025–2034, (USD MILLION)
FIGURE 44 MEXICO ALKALINE BATTERY CURRENT AND FUTURE END USER ANALYSIS, 2025–2034, (USD MILLION)
FIGURE 45 BRAZIL ALKALINE BATTERY CURRENT AND FUTURE TYPE ANALYSIS, 2025–2034, (USD MILLION)
FIGURE 46 BRAZIL ALKALINE BATTERY CURRENT AND FUTURE END USER ANALYSIS, 2025–2034, (USD MILLION)
FIGURE 47 ARGENTINA ALKALINE BATTERY CURRENT AND FUTURE TYPE ANALYSIS, 2025–2034, (USD MILLION)
FIGURE 48 ARGENTINA ALKALINE BATTERY CURRENT AND FUTURE END USER ANALYSIS, 2025–2034, (USD MILLION)
FIGURE 49 COLUMBIA ALKALINE BATTERY CURRENT AND FUTURE TYPE ANALYSIS, 2025–2034, (USD MILLION)
FIGURE 50 COLUMBIA ALKALINE BATTERY CURRENT AND FUTURE END USER ANALYSIS, 2025–2034, (USD MILLION)
FIGURE 51 REST OF LATIN AMERICA ALKALINE BATTERY CURRENT AND FUTURE TYPE ANALYSIS, 2025–2034, (USD MILLION)
FIGURE 52 REST OF LATIN AMERICA ALKALINE BATTERY CURRENT AND FUTURE END USER ANALYSIS, 2025–2034, (USD MILLION)
FIGURE 53 EASTERN EUROPE ALKALINE BATTERY CURRENT AND FUTURE MARKET VOLUME SHARE REGIONAL ANALYSIS, 2025–2034, (USD MILLION)
FIGURE 54 POLAND ALKALINE BATTERY CURRENT AND FUTURE TYPE ANALYSIS, 2025–2034, (USD MILLION)
FIGURE 55 POLAND ALKALINE BATTERY CURRENT AND FUTURE END USER ANALYSIS, 2025–2034, (USD MILLION)
FIGURE 56 RUSSIA ALKALINE BATTERY CURRENT AND FUTURE TYPE ANALYSIS, 2025–2034, (USD MILLION)
FIGURE 57 RUSSIA ALKALINE BATTERY CURRENT AND FUTURE END USER ANALYSIS, 2025–2034, (USD MILLION)
FIGURE 58 CZECH REPUBLIC ALKALINE BATTERY CURRENT AND FUTURE TYPE ANALYSIS, 2025–2034, (USD MILLION)
FIGURE 59 CZECH REPUBLIC ALKALINE BATTERY CURRENT AND FUTURE END USER ANALYSIS, 2025–2034, (USD MILLION)
FIGURE 60 ROMANIA ALKALINE BATTERY CURRENT AND FUTURE TYPE ANALYSIS, 2025–2034, (USD MILLION)
FIGURE 61 ROMANIA ALKALINE BATTERY CURRENT AND FUTURE END USER ANALYSIS, 2025–2034, (USD MILLION)
FIGURE 62 REST OF EASTERN EUROPE ALKALINE BATTERY CURRENT AND FUTURE TYPE ANALYSIS, 2025–2034, (USD MILLION)
FIGURE 63 REST OF EASTERN EUROPE ALKALINE BATTERY CURRENT AND FUTURE END USER ANALYSIS, 2025–2034, (USD MILLION)
FIGURE 64 WESTERN EUROPE ALKALINE BATTERY CURRENT AND FUTURE MARKET VOLUME SHARE REGIONAL ANALYSIS, 2025–2034, (USD MILLION)
FIGURE 65 GERMANY ALKALINE BATTERY CURRENT AND FUTURE TYPE ANALYSIS, 2025–2034, (USD MILLION)
FIGURE 66 GERMANY ALKALINE BATTERY CURRENT AND FUTURE END USER ANALYSIS, 2025–2034, (USD MILLION)
FIGURE 67 FRANCE ALKALINE BATTERY CURRENT AND FUTURE TYPE ANALYSIS, 2025–2034, (USD MILLION)
FIGURE 68 FRANCE ALKALINE BATTERY CURRENT AND FUTURE END USER ANALYSIS, 2025–2034, (USD MILLION)
FIGURE 69 UK ALKALINE BATTERY CURRENT AND FUTURE TYPE ANALYSIS, 2025–2034, (USD MILLION)
FIGURE 70 UK ALKALINE BATTERY CURRENT AND FUTURE END USER ANALYSIS, 2025–2034, (USD MILLION)
FIGURE 71 SPAIN ALKALINE BATTERY CURRENT AND FUTURE TYPE ANALYSIS, 2025–2034, (USD MILLION)
FIGURE 72 SPAIN ALKALINE BATTERY CURRENT AND FUTURE END USER ANALYSIS, 2025–2034, (USD MILLION)
FIGURE 73 ITALY ALKALINE BATTERY CURRENT AND FUTURE TYPE ANALYSIS, 2025–2034, (USD MILLION)
FIGURE 74 ITALY ALKALINE BATTERY CURRENT AND FUTURE END USER ANALYSIS, 2025–2034, (USD MILLION)
FIGURE 75 REST OF WESTERN EUROPE ALKALINE BATTERY CURRENT AND FUTURE TYPE ANALYSIS, 2025–2034, (USD MILLION)
FIGURE 76 REST OF WESTERN EUROPE ALKALINE BATTERY CURRENT AND FUTURE END USER ANALYSIS, 2025–2034, (USD MILLION)
FIGURE 77 EAST ASIA AND PACIFIC ALKALINE BATTERY CURRENT AND FUTURE MARKET VOLUME SHARE REGIONAL ANALYSIS, 2025–2034, (USD MILLION)
FIGURE 78 CHINA ALKALINE BATTERY CURRENT AND FUTURE TYPE ANALYSIS, 2025–2034, (USD MILLION)
FIGURE 79 CHINA ALKALINE BATTERY CURRENT AND FUTURE END USER ANALYSIS, 2025–2034, (USD MILLION)
FIGURE 80 JAPAN ALKALINE BATTERY CURRENT AND FUTURE TYPE ANALYSIS, 2025–2034, (USD MILLION)
FIGURE 81 JAPAN ALKALINE BATTERY CURRENT AND FUTURE END USER ANALYSIS, 2025–2034, (USD MILLION)
FIGURE 82 AUSTRALIA ALKALINE BATTERY CURRENT AND FUTURE TYPE ANALYSIS, 2025–2034, (USD MILLION)
FIGURE 83 AUSTRALIA ALKALINE BATTERY CURRENT AND FUTURE END USER ANALYSIS, 2025–2034, (USD MILLION)
FIGURE 84 CAMBODIA ALKALINE BATTERY CURRENT AND FUTURE TYPE ANALYSIS, 2025–2034, (USD MILLION)
FIGURE 85 CAMBODIA ALKALINE BATTERY CURRENT AND FUTURE END USER ANALYSIS, 2025–2034, (USD MILLION)
FIGURE 86 FIJI ALKALINE BATTERY CURRENT AND FUTURE TYPE ANALYSIS, 2025–2034, (USD MILLION)
FIGURE 87 FIJI ALKALINE BATTERY CURRENT AND FUTURE END USER ANALYSIS, 2025–2034, (USD MILLION)
FIGURE 88 INDONESIA ALKALINE BATTERY CURRENT AND FUTURE TYPE ANALYSIS, 2025–2034, (USD MILLION)
FIGURE 89 INDONESIA ALKALINE BATTERY CURRENT AND FUTURE END USER ANALYSIS, 2025–2034, (USD MILLION)
FIGURE 90 SOUTH KOREA ALKALINE BATTERY CURRENT AND FUTURE TYPE ANALYSIS, 2025–2034, (USD MILLION)
FIGURE 91 SOUTH KOREA ALKALINE BATTERY CURRENT AND FUTURE END USER ANALYSIS, 2025–2034, (USD MILLION)
FIGURE 92 REST OF EAST ASIA AND PACIFIC ALKALINE BATTERY CURRENT AND FUTURE TYPE ANALYSIS, 2025–2034, (USD MILLION)
FIGURE 93 REST OF EAST ASIA AND PACIFIC ALKALINE BATTERY CURRENT AND FUTURE END USER ANALYSIS, 2025–2034, (USD MILLION)
FIGURE 94 SEA AND SOUTH ASIA ALKALINE BATTERY CURRENT AND FUTURE MARKET VOLUME SHARE REGIONAL ANALYSIS, 2025–2034, (USD MILLION)
FIGURE 95 BANGLADESH ALKALINE BATTERY CURRENT AND FUTURE TYPE ANALYSIS, 2025–2034, (USD MILLION)
FIGURE 96 BANGLADESH ALKALINE BATTERY CURRENT AND FUTURE END USER ANALYSIS, 2025–2034, (USD MILLION)
FIGURE 97 NEW ZEALAND ALKALINE BATTERY CURRENT AND FUTURE TYPE ANALYSIS, 2025–2034, (USD MILLION)
FIGURE 98 NEW ZEALAND ALKALINE BATTERY CURRENT AND FUTURE END USER ANALYSIS, 2025–2034, (USD MILLION)
FIGURE 99 INDIA ALKALINE BATTERY CURRENT AND FUTURE TYPE ANALYSIS, 2025–2034, (USD MILLION)
FIGURE 100 INDIA ALKALINE BATTERY CURRENT AND FUTURE END USER ANALYSIS, 2025–2034, (USD MILLION)
FIGURE 101 SINGAPORE ALKALINE BATTERY CURRENT AND FUTURE TYPE ANALYSIS, 2025–2034, (USD MILLION)
FIGURE 102 SINGAPORE ALKALINE BATTERY CURRENT AND FUTURE END USER ANALYSIS, 2025–2034, (USD MILLION)
FIGURE 103 THAILAND ALKALINE BATTERY CURRENT AND FUTURE TYPE ANALYSIS, 2025–2034, (USD MILLION)
FIGURE 104 THAILAND ALKALINE BATTERY CURRENT AND FUTURE END USER ANALYSIS, 2025–2034, (USD MILLION)
FIGURE 105 TAIWAN ALKALINE BATTERY CURRENT AND FUTURE TYPE ANALYSIS, 2025–2034, (USD MILLION)
FIGURE 106 TAIWAN ALKALINE BATTERY CURRENT AND FUTURE END USER ANALYSIS, 2025–2034, (USD MILLION)
FIGURE 107 MALAYSIA ALKALINE BATTERY CURRENT AND FUTURE TYPE ANALYSIS, 2025–2034, (USD MILLION)
FIGURE 108 MALAYSIA ALKALINE BATTERY CURRENT AND FUTURE END USER ANALYSIS, 2025–2034, (USD MILLION)
FIGURE 109 REST OF SEA AND SOUTH ASIA ALKALINE BATTERY CURRENT AND FUTURE TYPE ANALYSIS, 2025–2034, (USD MILLION)
FIGURE 110 REST OF SEA AND SOUTH ASIA ALKALINE BATTERY CURRENT AND FUTURE END USER ANALYSIS, 2025–2034, (USD MILLION)
FIGURE 111 MIDDLE EAST AND AFRICA ALKALINE BATTERY CURRENT AND FUTURE MARKET VOLUME SHARE REGIONAL ANALYSIS, 2025–2034, (USD MILLION)
FIGURE 112 GCC COUNTRIES ALKALINE BATTERY CURRENT AND FUTURE TYPE ANALYSIS, 2025–2034, (USD MILLION)
FIGURE 113 GCC COUNTRIES ALKALINE BATTERY CURRENT AND FUTURE END USER ANALYSIS, 2025–2034, (USD MILLION)
FIGURE 114 SAUDI ARABIA ALKALINE BATTERY CURRENT AND FUTURE TYPE ANALYSIS, 2025–2034, (USD MILLION)
FIGURE 115 SAUDI ARABIA ALKALINE BATTERY CURRENT AND FUTURE END USER ANALYSIS, 2025–2034, (USD MILLION)
FIGURE 116 UAE ALKALINE BATTERY CURRENT AND FUTURE TYPE ANALYSIS, 2025–2034, (USD MILLION)
FIGURE 117 UAE ALKALINE BATTERY CURRENT AND FUTURE END USER ANALYSIS, 2025–2034, (USD MILLION)
FIGURE 118 BAHRAIN ALKALINE BATTERY CURRENT AND FUTURE TYPE ANALYSIS, 2025–2034, (USD MILLION)
FIGURE 119 BAHRAIN ALKALINE BATTERY CURRENT AND FUTURE END USER ANALYSIS, 2025–2034, (USD MILLION)
FIGURE 120 KUWAIT ALKALINE BATTERY CURRENT AND FUTURE TYPE ANALYSIS, 2025–2034, (USD MILLION)
FIGURE 121 KUWAIT ALKALINE BATTERY CURRENT AND FUTURE END USER ANALYSIS, 2025–2034, (USD MILLION)
FIGURE 122 OMAN ALKALINE BATTERY CURRENT AND FUTURE TYPE ANALYSIS, 2025–2034, (USD MILLION)
FIGURE 123 OMAN ALKALINE BATTERY CURRENT AND FUTURE END USER ANALYSIS, 2025–2034, (USD MILLION)
FIGURE 124 QATAR ALKALINE BATTERY CURRENT AND FUTURE TYPE ANALYSIS, 2025–2034, (USD MILLION)
FIGURE 125 QATAR ALKALINE BATTERY CURRENT AND FUTURE END USER ANALYSIS, 2025–2034, (USD MILLION)
FIGURE 126 EGYPT ALKALINE BATTERY CURRENT AND FUTURE TYPE ANALYSIS, 2025–2034, (USD MILLION)
FIGURE 127 EGYPT ALKALINE BATTERY CURRENT AND FUTURE END USER ANALYSIS, 2025–2034, (USD MILLION)
FIGURE 128 NIGERIA ALKALINE BATTERY CURRENT AND FUTURE TYPE ANALYSIS, 2025–2034, (USD MILLION)
FIGURE 129 NIGERIA ALKALINE BATTERY CURRENT AND FUTURE END USER ANALYSIS, 2025–2034, (USD MILLION)
FIGURE 130 SOUTH AFRICA ALKALINE BATTERY CURRENT AND FUTURE TYPE ANALYSIS, 2025–2034, (USD MILLION)
FIGURE 131 SOUTH AFRICA ALKALINE BATTERY CURRENT AND FUTURE END USER ANALYSIS, 2025–2034, (USD MILLION)
FIGURE 132 ISRAEL ALKALINE BATTERY CURRENT AND FUTURE TYPE ANALYSIS, 2025–2034, (USD MILLION)
FIGURE 133 ISRAEL ALKALINE BATTERY CURRENT AND FUTURE END USER ANALYSIS, 2025–2034, (USD MILLION)
FIGURE 134 REST OF MEA ALKALINE BATTERY CURRENT AND FUTURE TYPE ANALYSIS, 2025–2034, (USD MILLION)
FIGURE 135 REST OF MEA ALKALINE BATTERY CURRENT AND FUTURE END USER ANALYSIS, 2025–2034, (USD MILLION)
FIGURE 136 U. S. MARKET SHARE ANALYSIS BY TYPE (2024)
FIGURE 137 U. S. MARKET SHARE ANALYSIS BY END USER (2024)
FIGURE 138 CANADA MARKET SHARE ANALYSIS BY TYPE (2024)
FIGURE 139 CANADA MARKET SHARE ANALYSIS BY END USER (2024)
FIGURE 140 MEXICO MARKET SHARE ANALYSIS BY TYPE (2024)
FIGURE 141 MEXICO MARKET SHARE ANALYSIS BY END USER (2024)
FIGURE 142 CHINA MARKET SHARE ANALYSIS BY TYPE (2024)
FIGURE 143 CHINA MARKET SHARE ANALYSIS BY END USER (2024)
FIGURE 144 JAPAN MARKET SHARE ANALYSIS BY TYPE (2024)
FIGURE 145 JAPAN MARKET SHARE ANALYSIS BY END USER (2024)
FIGURE 146 INDIA MARKET SHARE ANALYSIS BY TYPE (2024)
FIGURE 147 INDIA MARKET SHARE ANALYSIS BY END USER (2024)
FIGURE 148 SOUTH KOREA MARKET SHARE ANALYSIS BY TYPE (2024)
FIGURE 149 SOUTH KOREA MARKET SHARE ANALYSIS BY END USER (2024)
FIGURE 150 SAUDI ARABIA MARKET SHARE ANALYSIS BY TYPE (2024)
FIGURE 151 SAUDI ARABIA MARKET SHARE ANALYSIS BY END USER (2024)
FIGURE 152 UAE MARKET SHARE ANALYSIS BY TYPE (2024)
FIGURE 153 UAE MARKET SHARE ANALYSIS BY END USER (2024)
FIGURE 154 EGYPT MARKET SHARE ANALYSIS BY TYPE (2024)
FIGURE 155 EGYPT MARKET SHARE ANALYSIS BY END USER (2024)
FIGURE 156 NIGERIA MARKET SHARE ANALYSIS BY TYPE (2024)
FIGURE 157 NIGERIA MARKET SHARE ANALYSIS BY END USER (2024)
FIGURE 158 SOUTH AFRICA MARKET SHARE ANALYSIS BY TYPE (2024)
FIGURE 159 SOUTH AFRICA MARKET SHARE ANALYSIS BY END USER (2024)
FIGURE 160 GERMANY MARKET SHARE ANALYSIS BY TYPE (2024)
FIGURE 161 GERMANY MARKET SHARE ANALYSIS BY END USER (2024)
FIGURE 162 FRANCE MARKET SHARE ANALYSIS BY TYPE (2024)
FIGURE 163 FRANCE MARKET SHARE ANALYSIS BY END USER (2024)
FIGURE 164 UK MARKET SHARE ANALYSIS BY TYPE (2024)
FIGURE 165 UK MARKET SHARE ANALYSIS BY END USER (2024)
FIGURE 166 SPAIN MARKET SHARE ANALYSIS BY TYPE (2024)
FIGURE 167 SPAIN MARKET SHARE ANALYSIS BY END USER (2024)
FIGURE 168 ITALY MARKET SHARE ANALYSIS BY TYPE (2024)
FIGURE 169 ITALY MARKET SHARE ANALYSIS BY END USER (2024)
FIGURE 170 BRAZIL MARKET SHARE ANALYSIS BY TYPE (2024)
FIGURE 171 BRAZIL MARKET SHARE ANALYSIS BY END USER (2024)
FIGURE 172 ARGENTINA MARKET SHARE ANALYSIS BY TYPE (2024)
FIGURE 173 ARGENTINA MARKET SHARE ANALYSIS BY END USER (2024)
FIGURE 174 COLUMBIA MARKET SHARE ANALYSIS BY TYPE (2024)
FIGURE 175 COLUMBIA MARKET SHARE ANALYSIS BY END USER (2024)
FIGURE 176 GLOBAL ALKALINE BATTERY CURRENT AND FUTURE MARKET KEY COUNTRY LEVEL ANALYSIS, 2024–2034, (USD MILLION)
FIGURE 177 FINANCIAL OVERVIEW:
Key Player Analysis
Energizer Holdings Inc.: Leader. Energizer maintains a top position in alkaline batteries across North America and Europe, with strong retail penetration and a broad SKU mix in AA, AAA, C, D, and 9V. The company reports resilient primary battery revenues, supported by high replacement cycles in consumer electronics and small medical devices. In 2025, Energizer is prioritizing margin protection and mix upgrades, including higher-capacity AA lines and eco-labeled products. Strategic initiatives focus on brand consolidation, expansion in dollar and convenience channels, and packaging redesigns that improve recyclability. Differentiators include strong distributor relationships, premium positioning in leak-resistant technology, and targeted promotions that protect share in high-volume formats.
Panasonic Corporation: Challenger. Panasonic commands a large presence in Asia Pacific with strong retail and OEM channels for alkaline batteries under Eneloop and Evolta sub-brands for adjacent categories. In 2025, the company is aligning battery production with sustainability targets and regional product standards. The portfolio spans AA, AAA, and 9V with performance tiers tailored to toys, remote controls, and peripherals. Strategic moves include capacity balancing across Japan and Southeast Asia, selective price adjustments, and partnerships with retailers to drive high-turnover SKUs. Differentiators include robust manufacturing quality, consistent voltage performance across temperature ranges, and regional brand strength that supports share gains in emerging markets.
Toshiba Corporation: Niche player. Toshiba’s alkaline battery business focuses on mid-tier consumer devices and private-label contracts, particularly in Asia and parts of Europe. The company emphasizes reliability and cost discipline in AA and AAA formats. In 2025, Toshiba is enhancing packaging efficiency and distribution coverage in modern trade and e-commerce channels. Initiatives include SKU rationalization, inventory optimization, and selective promotions in toy and remote-control categories. Differentiators center on competitive pricing, dependable product performance, and strong relationships with regional retailers that value consistent supply and low return rates.
GP Batteries International Ltd.: Challenger. GP Batteries has a strong footprint in Asia Pacific with growing reach in Europe through retail and B2B channels. The company offers a full alkaline range, with AA and AAA driving volume. In 2025, GP is investing in brand visibility, local warehousing, and sustainability claims tied to reduced packaging materials. Strategic priorities include expanding distribution in India and Southeast Asia, targeted pricing for high-volume accounts, and co-marketing with electronics brands to boost attachment rates. Differentiators include regional agility, competitive cost positioning, and ability to scale promotions quickly in fast-growing markets. These strengths help the company capture share where consumption of disposable batteries is rising with portable device adoption.
Market Key Players
Sunwoda Electronic Co., Ltd.
Toshiba Corporation
Camelion Battery Co., Ltd.
Energizer Holdings Inc.
PKCELL Battery Co., Ltd.
Sony Corporation
Fujitsu Limited
Varta Consumer Batteries
Ningbo Baowang Battery Co., Ltd.
Duracell Inc
GP Batteries International Ltd.
Hitachi Maxell Ltd.
Eveready Industries India Ltd.
Spectrum Brands Holdings, Inc.
Gao Huan Photoelectric Technology Co., Ltd.
Samsung SDI Co., Ltd.
Panasonic Corporation
Zhongyin (Ningbo) Battery Co., Ltd.
Rayovac
LEOCH Battery Corporation
Driver
Rising Dependence on Portable Consumer Devices
By 2025, global demand for portable and wireless devices will keep growing, directly supporting the alkaline battery market. Sales of consumer electronics like remote controls, toys, flashlights, and small medical devices remain strong. More than 180 million portable devices were shipped worldwide in 2024. Alkaline batteries are popular in these areas because they are affordable, last a long time, and provide a stable 1.5-volt output. This makes them ideal for everyday, low-drain use.
Reliability and Cost Advantage in Primary Batteries
Alkaline batteries perform well across a wide temperature range and hold their charge during long storage periods. This makes them important for households, healthcare kits, and emergency preparedness. From an industry viewpoint, this continued use ensures a steady baseline demand. The primary battery segment is expected to keep over 70% of the market share through 2030, which will support consistent revenue for manufacturers.
Restraint
Tightening Environmental Regulations on Disposable Batteries
Environmental regulations are putting pressure on the alkaline battery market. The European Union’s updated Battery Regulation, effective from 2025, requires higher collection, recycling, and reporting standards, raising compliance costs by about 15 to 20% for manufacturers. Similar tightening of regulations in North America and parts of Asia is increasing operational challenges throughout the supply chain.
Shifting Consumer Preference Toward Rechargeables
Consumer preferences are changing as more than 60% of buyers express a desire for products with lower environmental impacts. This trend is speeding up the use of rechargeable alternatives in some applications, slowing down long-term growth for single-use alkaline batteries. It is also pushing producers to invest in recycling systems, redesign packaging, and clearly communicate sustainability practices.
Opportunity
Strong Demand Growth in Emerging Economies
Emerging markets present a strong growth opportunity for alkaline batteries in the next decade. Southeast Asia, Africa, and Latin America are seeing rapid growth in consumer electronics usage, fueled by rising incomes and more access to digital devices. In areas with unreliable electrical grids, disposable batteries are still vital for household electronics, lighting, and emergency situations.
Public Sector and Infrastructure-Led Consumption
Government investments in digital education, rural electrification, and healthcare access are increasing demand for portable power solutions. Consequently, alkaline battery use in these regions is expected to grow at a compound annual growth rate (CAGR) of over 6% through 2034. This offers manufacturers chances to expand through localized production, larger retail networks, and strategic distribution partnerships.
Trend
Transition Toward Eco-Friendly Alkaline Batteries
Sustainability is changing how products are developed in the alkaline battery industry. Leading manufacturers are launching low-toxicity designs with very little mercury content and better material recovery. This allows for greater recycling efficiency for zinc and manganese components. Recycling rates in Europe currently exceed 60%, setting examples for other regions.
Sustainability as a Competitive Differentiator
Consumer behavior supports this change. Almost 40% of households in developed markets are willing to pay more for environmentally responsible battery products. As regulations become stricter and sustainability becomes a major purchasing factor, investments in recyclable alkaline technologies and clear environmental labeling are becoming essential for long-term competitiveness, not just optional improvements.
Recent Developments
Dec 2024 – Gold Peak/GPPD: Gold Peak subsidiary GPPD increased its Vietnam investment to USD 34.6 million and mapped a third-phase expansion targeting 700 million mercury-free alkaline cells per year by 2026, doubling total site capacity to ~1.3 billion units; equipment installation scheduled for Mar–Apr 2025 with trials in Oct 2025–Mar 2026. This secures low-cost Southeast Asia capacity and strengthens OEM supply for private-label and regional brands.
May 2025 – Energizer Holdings: Energizer completed the acquisition of Advanced Power Solutions NV, expanding OEM and private-label manufacturing reach in primary batteries; Q2 disclosures also cited net sales of USD 662.9 million and the fourth straight quarter of organic revenue growth, supporting scale and procurement leverage in alkaline. The deal deepens channel penetration in Europe and improves cost positions across AA/AAA lines.
Jun 2025 – Duracell vs. Energizer: Duracell filed suit against Energizer over advertising claims on alkaline battery life, escalating brand competition in the premium segment with potential implications for claims standards and marketing spend during peak seasons. The case may reshape comparative messaging and could influence price–performance positioning at retail.
Jul 2025 – Market Growth Signals: Global alkaline battery growth projections were reiterated, with 2024 market size near USD 8.7–8.9 billion and expected CAGR of ~5.2–5.5 percent through 2033–2034; forecasts imply USD 14.3 billion by 2033 as consumer electronics and medical devices sustain AA/AAA demand despite rechargeable adoption. The outlook supports capacity commitments and inventory planning for holiday cycles and emerging markets.
Aug 2025 – Shelf-life and Premium Mix: Category coverage highlighted mainstream shelf-life positioning up to 15 years for alkaline and ongoing trade-up to premium variants in toys and small devices during back-to-school peaks. This trend increases average selling prices and reinforces merchandising strategies around high-drain use cases.
Sep 2025 – Panasonic and Medium-duty EV Partnerships: Panasonic Energy was named official 2170 cell supplier to Harbinger in April 2025 and outlined an anode-free cell roadmap targeting ~25 percent capacity gains by 2027; while centered on lithium-ion, these moves reinforce Panasonic’s battery leadership and cross-segment procurement strength that also benefits primary battery lines in retail channels. Broader brand halo and scale advantages can support shelf space, distribution negotiations, and marketing effectiveness in alkaline.