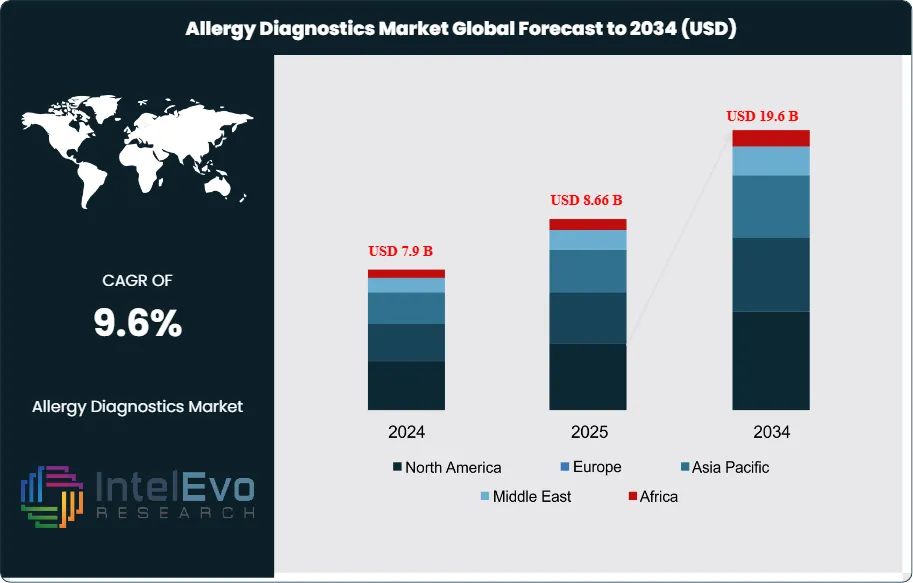
The Allergy Diagnostics Market is estimated at USD 7.9 billion in 2024 and is projected to reach approximately USD 19.6 billion by 2034, registering a compound annual growth rate (CAGR) of about 9.6% during 2025–2034. This sustained expansion is driven by the rising global prevalence of allergic disorders, increased awareness of early and accurate diagnosis, and growing adoption of in-vitro diagnostic tests over traditional methods. Technological advances in molecular diagnostics, expanding pediatric and geriatric patient pools, and improved reimbursement for allergy testing are further supporting long-term market momentum across both developed and emerging healthcare systems.
This market has expanded rapidly over the past decade, driven by rising allergy prevalence and improved diagnostic capabilities. Urbanization now affects over 80% of the global population, according to WHO, exposing millions to poor air quality and increasing the incidence of allergic rhinitis and asthma. In low-income regions, this exposure is more acute, accelerating demand for reliable allergy testing. Between 2018 and 2023, the market grew at a steady pace, with skin prick and blood tests dominating clinical workflows. From 2024 onward, growth is expected to accelerate as healthcare systems prioritize early detection and personalized treatment.
Demand-side drivers include rising awareness, improved access to healthcare, and growing cases of food, drug, and insect allergies. On the supply side, manufacturers are expanding test menus and integrating automated platforms to meet clinical demand. Regulatory bodies continue to push for standardization and accuracy, especially in pediatric and immunocompromised populations. However, reimbursement gaps and limited infrastructure in emerging economies remain key challenges.
Technology is reshaping the landscape. AI-based diagnostic algorithms, digital phenotyping, and multiplex assays are gaining traction. Labs are adopting automated platforms that reduce turnaround time and improve test sensitivity. Blood-based assays are increasingly preferred for their scalability and reduced patient discomfort. You’ll also see a shift toward integrated allergy panels that combine multiple allergens in a single test, improving efficiency and clinical decision-making.
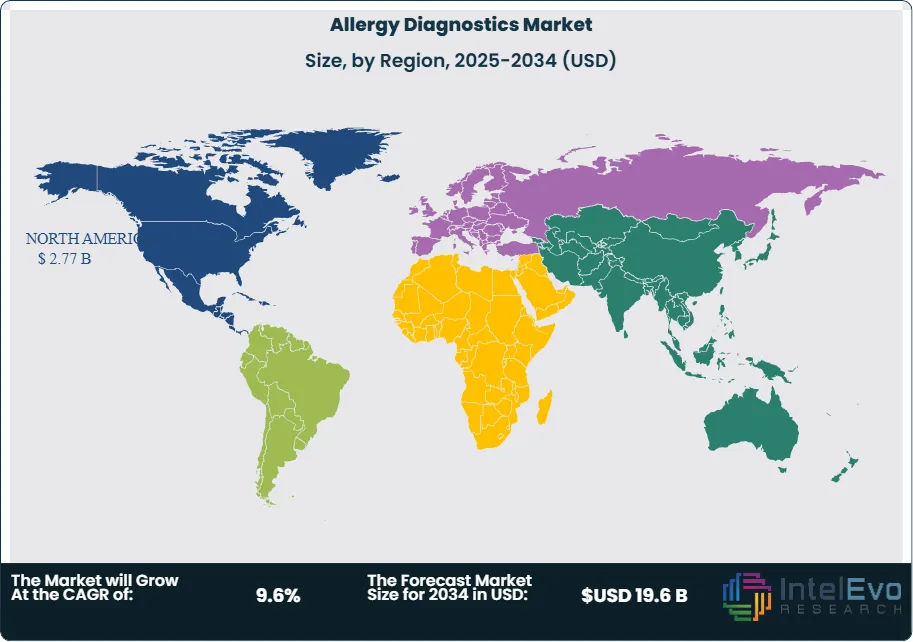
North America leads the market, accounting for over 35% of global revenue in 2023. Europe follows closely, driven by strong public health initiatives and reimbursement support. Asia-Pacific is the fastest-growing region, with China and India showing double-digit growth due to rising urbanization and healthcare investments. Investors should watch Southeast Asia and Latin America, where allergy prevalence is rising but diagnostic infrastructure remains underdeveloped.
As allergy cases continue to climb, the need for accurate, fast, and accessible diagnostics will intensify. Your opportunity lies in identifying platforms that combine clinical precision with operational efficiency across diverse healthcare settings.
Key Takeaways
Market Growth: The global Allergy Diagnostics market was valued at USD 7.9 billion in 2024 and is projected to reach USD 19.6 billion by 2034, expanding at a CAGR of 9.6% from 2025 to 2034. Rising allergy prevalence linked to urbanization and air pollution remains the primary growth driver.
Product & Service: Consumables accounted for 45% of total revenue in 2023, reflecting recurring demand for reagents, kits, and testing supplies that support high testing volumes in clinical settings.
Test Type: In vivo testing led the market with a 58% share in 2023, supported by widespread adoption of skin prick and intradermal tests as first-line diagnostic tools due to their cost-effectiveness and clinical reliability.
Allergen Source: Inhaled allergens represented 43% of global revenue in 2023, driven by rising cases of asthma and allergic rhinitis linked to pollen, dust mites, and pet dander exposure in urban populations.
End Use: Diagnostic laboratories captured 54% of the market in 2023, reflecting their central role in allergy testing infrastructure and their ability to integrate advanced automated platforms for high-throughput analysis.
Driver: Increasing urban exposure to poor air quality is fueling demand. WHO estimates that 80% of the global population now lives in urban areas, with air pollution strongly correlated to higher allergy incidence.
Restraint: Limited reimbursement policies and high test costs in emerging economies restrict adoption, with affordability gaps reducing patient access to advanced diagnostic solutions.
Opportunity: Asia-Pacific is expected to post double-digit CAGR through 2033, supported by rising healthcare investments in China and India and growing awareness of allergy-related conditions.
Trend: Multiplex assays and AI-driven diagnostic platforms are gaining traction, enabling simultaneous detection of multiple allergens and reducing turnaround times. Companies are investing in digital phenotyping and automated workflows to improve accuracy and efficiency.
Regional Analysis: North America led with 35% of global revenue in 2023, supported by strong reimbursement frameworks and established diagnostic infrastructure. Asia-Pacific is the fastest-growing region, while Latin America and Southeast Asia present emerging opportunities due to rising allergy prevalence and underpenetrated diagnostic capacity.
Type Analysis
Consumables remain the largest revenue contributor in the allergy diagnostics market, accounting for approximately 45% of global sales in 2024 and expected to maintain dominance through 2030. These include reagents, assay kits, and plates that are essential for routine testing. Their recurring demand reflects the rising global prevalence of allergic conditions, with WHO estimating that over 30% of the global population now suffers from at least one allergy-related disorder. The steady consumption of these products ensures consistent revenue streams for suppliers.
Instruments form the second-largest segment, supported by growing adoption of automated analyzers and integrated testing platforms. These systems improve throughput and accuracy, enabling laboratories to process higher test volumes. With healthcare providers under pressure to deliver faster results, demand for advanced diagnostic equipment is expected to grow at a CAGR above 10% through 2030.
Services, including testing, consultation, and result interpretation, are gaining traction as healthcare systems shift toward integrated care models. Clinical laboratories and allergists provide specialized expertise that complements consumables and instruments. The expansion of outsourced diagnostic services, particularly in Asia-Pacific and Latin America, is expected to accelerate growth in this segment.
Application Analysis
In vivo testing continues to dominate, representing nearly 58% of the market in 2024. Skin prick, intradermal, and patch tests remain the first-line diagnostic tools due to their cost-effectiveness and clinical reliability. Their widespread use in both developed and emerging markets ensures strong demand, particularly in primary care and hospital settings.
In vitro testing, while smaller in share, is expanding rapidly. Blood-based assays such as ELISA, RAST, and allergen microarrays are increasingly adopted for their noninvasive nature and ability to detect allergen-specific IgE antibodies with high precision. This segment is projected to grow at a CAGR above 12% through 2030, driven by rising patient preference for less invasive procedures and the growing role of multiplex testing technologies.
The shift toward faster, more accurate, and patient-friendly diagnostics is expected to balance the market between in vivo and in vitro methods by the end of the decade. This diversification strengthens the overall testing ecosystem and creates opportunities for companies offering hybrid diagnostic solutions.
End-Use Analysis
Diagnostic laboratories accounted for 54% of global revenue in 2024, reflecting their central role in allergy testing infrastructure. Equipped with advanced analyzers and skilled personnel, these facilities handle the majority of test volumes across inhaled, food, and drug allergens. Their dominance is reinforced by the growing trend of outsourcing diagnostic services to specialized labs.
Hospital-based laboratories represent the second-largest segment, providing essential allergy testing within clinical care pathways. Their integration into patient management ensures timely diagnosis and treatment, particularly for acute allergic reactions. Growth in this segment is supported by rising hospital investments in diagnostic automation.
Academic research institutes, while smaller in share, play a critical role in advancing testing methodologies and developing new allergen panels. Their collaborations with diagnostic companies and healthcare providers contribute to the evolution of precision medicine in allergy care. The combined efforts of these end-users are shaping a more comprehensive and efficient diagnostic landscape.
Regional Analysis
North America led the market in 2024 with a 35% revenue share, supported by high allergy prevalence, strong reimbursement frameworks, and advanced healthcare infrastructure. The United States remains the largest contributor, with significant investments in diagnostic technologies and ongoing clinical research.
Europe follows closely, driven by widespread awareness programs, favorable regulatory standards, and government-backed healthcare initiatives. Countries such as Germany, the UK, and France are key contributors, with strong adoption of both in vivo and in vitro testing.
Asia-Pacific is the fastest-growing region, projected to expand at a CAGR above 13% through 2030. Rising urbanization, increasing healthcare expenditure, and growing awareness of allergic diseases in China and India are fueling demand. Latin America and the Middle East & Africa are emerging markets, where improving healthcare infrastructure and rising allergy incidence present untapped opportunities for diagnostic providers.
Overall, regional growth patterns highlight a dual market dynamic: mature regions driving steady revenues through established infrastructure, and emerging economies offering high-growth potential through expanding access and rising demand.
Product & Service (Consumables, Instruments, Services), Test Type (In Vivo, In Vitro), Allergen (Inhaled Allergens, Food Allergens, Drug Allergens, Other Allgerens), End-user (Diagnostic Laboratories, Hospital-based Laboratories, Academic Research Institutes, Other End-Users)
Research Methodology
Primary Research- 100 Interviews of Stakeholders
Secondary Research
Desk Research
Regional scope
North America (United States, Canada, Mexico)
Latin America (Brazil, Argentina, Columbia)
East Asia And Pacific (China, Japan, South Korea, Australia, Cambodia, Fiji, Indonesia)
Sea And South Asia (India, Singapore, Thailand, Taiwan, Malaysia)
Eastern Europe (Poland, Russia, Czech Republic, Romania)
Western Europe (Germany, U.K., France, Spain, Itlay)
Middle East & Africa (GCC Countries, Egypt, Nigeria, South Africa, Israel)
Competitive Landscape
Eurofins Scientific, Siemens Healthcare Diagnostics, Inc., Alerchek Inc., Thermo Fisher Scientific Inc., Omega Diagnostic LLC, bioMérieux SA, Danaher Corporation, Hitachi Chemical Diagnostic Inc., Omega Diagnostics Group PLC
Customization Scope
Customization for segments, region/country-level will be provided. Moreover, additional customization can be done based on the requirements.
Pricing and Purchase Options
Avail customized purchase options to meet your exact research needs. We have three licenses to opt for: Single User License, Multi-User License (Up to 5 Users), Corporate Use License (Unlimited User and Printable PDF).
TABLE OF CONTENTS
1. EXECUTIVE SUMMARY
1.1. MARKET SNAPSHOT
1.2. KEY FINDINGS & INSIGHTS
1.3. ANALYST RECOMMENDATIONS
1.4. FUTURE OUTLOOK
2. RESEARCH METHODOLOGY
2.1. MARKET DEFINITION & SCOPE
2.2. RESEARCH OBJECTIVES: PRIMARY & SECONDARY DATA SOURCES
2.3. DATA COLLECTION SOURCES
2.3.1. COVERAGE OF 100+ PRIMARY RESEARCH/CONSULTATION CALLS WITH INDUSTRY STAKEHOLDERS
FIGURE 17 NORTH AMERICA ALLERGY DIAGNOSTICS CURRENT AND FUTURE TYPE ANALYSIS, 2025–2034, (USD MILLION)
FIGURE 18 NORTH AMERICA ALLERGY DIAGNOSTICS CURRENT AND FUTURE END USER ANALYSIS, 2025–2034, (USD MILLION)
FIGURE 19 MARKET SHARE BY COUNTRY
FIGURE 20 LATIN AMERICA ALLERGY DIAGNOSTICS CURRENT AND FUTURE TYPE ANALYSIS, 2025–2034, (USD MILLION)
FIGURE 21 LATIN AMERICA ALLERGY DIAGNOSTICS CURRENT AND FUTURE END USER ANALYSIS, 2025–2034, (USD MILLION)
FIGURE 22 MARKET SHARE BY COUNTRY
FIGURE 23 EASTERN EUROPE ALLERGY DIAGNOSTICS CURRENT AND FUTURE TYPE ANALYSIS, 2025–2034, (USD MILLION)
FIGURE 24 EASTERN EUROPE ALLERGY DIAGNOSTICS CURRENT AND FUTURE END USER ANALYSIS, 2025–2034, (USD MILLION)
FIGURE 25 MARKET SHARE BY COUNTRY
FIGURE 26 WESTERN EUROPE ALLERGY DIAGNOSTICS CURRENT AND FUTURE TYPE ANALYSIS, 2025–2034, (USD MILLION)
FIGURE 27 WESTERN EUROPE ALLERGY DIAGNOSTICS CURRENT AND FUTURE END USER ANALYSIS, 2025–2034, (USD MILLION)
FIGURE 28 MARKET SHARE BY COUNTRY
FIGURE 29 EAST ASIA AND PACIFIC ALLERGY DIAGNOSTICS CURRENT AND FUTURE TYPE ANALYSIS, 2025–2034, (USD MILLION)
FIGURE 30 EAST ASIA AND PACIFIC ALLERGY DIAGNOSTICS CURRENT AND FUTURE END USER ANALYSIS, 2025–2034, (USD MILLION)
FIGURE 31 MARKET SHARE BY COUNTRY
FIGURE 32 SEA AND SOUTH ASIA ALLERGY DIAGNOSTICS CURRENT AND FUTURE TYPE ANALYSIS, 2025–2034, (USD MILLION)
FIGURE 33 SEA AND SOUTH ASIA ALLERGY DIAGNOSTICS CURRENT AND FUTURE END USER ANALYSIS, 2025–2034, (USD MILLION)
FIGURE 34 MARKET SHARE BY COUNTRY
FIGURE 35 MIDDLE EAST AND AFRICA ALLERGY DIAGNOSTICS CURRENT AND FUTURE TYPE ANALYSIS, 2025–2034, (USD MILLION)
FIGURE 36 MIDDLE EAST AND AFRICA ALLERGY DIAGNOSTICS CURRENT AND FUTURE END USER ANALYSIS, 2025–2034, (USD MILLION)
FIGURE 37 NORTH AMERICA ALLERGY DIAGNOSTICS CURRENT AND FUTURE MARKET VOLUME SHARE REGIONAL ANALYSIS, 2025–2034, (USD MILLION)
FIGURE 38 U.S. ALLERGY DIAGNOSTICS CURRENT AND FUTURE TYPE ANALYSIS, 2025–2034, (USD MILLION)
FIGURE 39 U.S. ALLERGY DIAGNOSTICS CURRENT AND FUTURE END USER ANALYSIS, 2025–2034, (USD MILLION)
FIGURE 40 CANADA ALLERGY DIAGNOSTICS CURRENT AND FUTURE TYPE ANALYSIS, 2025–2034, (USD MILLION)
FIGURE 41 CANADA ALLERGY DIAGNOSTICS CURRENT AND FUTURE END USER ANALYSIS, 2025–2034, (USD MILLION)
FIGURE 42 LATIN AMERICA ALLERGY DIAGNOSTICS CURRENT AND FUTURE MARKET VOLUME SHARE REGIONAL ANALYSIS, 2025–2034, (USD MILLION)
FIGURE 43 MEXICO ALLERGY DIAGNOSTICS CURRENT AND FUTURE TYPE ANALYSIS, 2025–2034, (USD MILLION)
FIGURE 44 MEXICO ALLERGY DIAGNOSTICS CURRENT AND FUTURE END USER ANALYSIS, 2025–2034, (USD MILLION)
FIGURE 45 BRAZIL ALLERGY DIAGNOSTICS CURRENT AND FUTURE TYPE ANALYSIS, 2025–2034, (USD MILLION)
FIGURE 46 BRAZIL ALLERGY DIAGNOSTICS CURRENT AND FUTURE END USER ANALYSIS, 2025–2034, (USD MILLION)
FIGURE 47 ARGENTINA ALLERGY DIAGNOSTICS CURRENT AND FUTURE TYPE ANALYSIS, 2025–2034, (USD MILLION)
FIGURE 48 ARGENTINA ALLERGY DIAGNOSTICS CURRENT AND FUTURE END USER ANALYSIS, 2025–2034, (USD MILLION)
FIGURE 49 COLUMBIA ALLERGY DIAGNOSTICS CURRENT AND FUTURE TYPE ANALYSIS, 2025–2034, (USD MILLION)
FIGURE 50 COLUMBIA ALLERGY DIAGNOSTICS CURRENT AND FUTURE END USER ANALYSIS, 2025–2034, (USD MILLION)
FIGURE 51 REST OF LATIN AMERICA ALLERGY DIAGNOSTICS CURRENT AND FUTURE TYPE ANALYSIS, 2025–2034, (USD MILLION)
FIGURE 52 REST OF LATIN AMERICA ALLERGY DIAGNOSTICS CURRENT AND FUTURE END USER ANALYSIS, 2025–2034, (USD MILLION)
FIGURE 53 EASTERN EUROPE ALLERGY DIAGNOSTICS CURRENT AND FUTURE MARKET VOLUME SHARE REGIONAL ANALYSIS, 2025–2034, (USD MILLION)
FIGURE 54 POLAND ALLERGY DIAGNOSTICS CURRENT AND FUTURE TYPE ANALYSIS, 2025–2034, (USD MILLION)
FIGURE 55 POLAND ALLERGY DIAGNOSTICS CURRENT AND FUTURE END USER ANALYSIS, 2025–2034, (USD MILLION)
FIGURE 56 RUSSIA ALLERGY DIAGNOSTICS CURRENT AND FUTURE TYPE ANALYSIS, 2025–2034, (USD MILLION)
FIGURE 57 RUSSIA ALLERGY DIAGNOSTICS CURRENT AND FUTURE END USER ANALYSIS, 2025–2034, (USD MILLION)
FIGURE 58 CZECH REPUBLIC ALLERGY DIAGNOSTICS CURRENT AND FUTURE TYPE ANALYSIS, 2025–2034, (USD MILLION)
FIGURE 59 CZECH REPUBLIC ALLERGY DIAGNOSTICS CURRENT AND FUTURE END USER ANALYSIS, 2025–2034, (USD MILLION)
FIGURE 60 ROMANIA ALLERGY DIAGNOSTICS CURRENT AND FUTURE TYPE ANALYSIS, 2025–2034, (USD MILLION)
FIGURE 61 ROMANIA ALLERGY DIAGNOSTICS CURRENT AND FUTURE END USER ANALYSIS, 2025–2034, (USD MILLION)
FIGURE 62 REST OF EASTERN EUROPE ALLERGY DIAGNOSTICS CURRENT AND FUTURE TYPE ANALYSIS, 2025–2034, (USD MILLION)
FIGURE 63 REST OF EASTERN EUROPE ALLERGY DIAGNOSTICS CURRENT AND FUTURE END USER ANALYSIS, 2025–2034, (USD MILLION)
FIGURE 64 WESTERN EUROPE ALLERGY DIAGNOSTICS CURRENT AND FUTURE MARKET VOLUME SHARE REGIONAL ANALYSIS, 2025–2034, (USD MILLION)
FIGURE 65 GERMANY ALLERGY DIAGNOSTICS CURRENT AND FUTURE TYPE ANALYSIS, 2025–2034, (USD MILLION)
FIGURE 66 GERMANY ALLERGY DIAGNOSTICS CURRENT AND FUTURE END USER ANALYSIS, 2025–2034, (USD MILLION)
FIGURE 67 FRANCE ALLERGY DIAGNOSTICS CURRENT AND FUTURE TYPE ANALYSIS, 2025–2034, (USD MILLION)
FIGURE 68 FRANCE ALLERGY DIAGNOSTICS CURRENT AND FUTURE END USER ANALYSIS, 2025–2034, (USD MILLION)
FIGURE 69 UK ALLERGY DIAGNOSTICS CURRENT AND FUTURE TYPE ANALYSIS, 2025–2034, (USD MILLION)
FIGURE 70 UK ALLERGY DIAGNOSTICS CURRENT AND FUTURE END USER ANALYSIS, 2025–2034, (USD MILLION)
FIGURE 71 SPAIN ALLERGY DIAGNOSTICS CURRENT AND FUTURE TYPE ANALYSIS, 2025–2034, (USD MILLION)
FIGURE 72 SPAIN ALLERGY DIAGNOSTICS CURRENT AND FUTURE END USER ANALYSIS, 2025–2034, (USD MILLION)
FIGURE 73 ITALY ALLERGY DIAGNOSTICS CURRENT AND FUTURE TYPE ANALYSIS, 2025–2034, (USD MILLION)
FIGURE 74 ITALY ALLERGY DIAGNOSTICS CURRENT AND FUTURE END USER ANALYSIS, 2025–2034, (USD MILLION)
FIGURE 75 REST OF WESTERN EUROPE ALLERGY DIAGNOSTICS CURRENT AND FUTURE TYPE ANALYSIS, 2025–2034, (USD MILLION)
FIGURE 76 REST OF WESTERN EUROPE ALLERGY DIAGNOSTICS CURRENT AND FUTURE END USER ANALYSIS, 2025–2034, (USD MILLION)
FIGURE 77 EAST ASIA AND PACIFIC ALLERGY DIAGNOSTICS CURRENT AND FUTURE MARKET VOLUME SHARE REGIONAL ANALYSIS, 2025–2034, (USD MILLION)
FIGURE 78 CHINA ALLERGY DIAGNOSTICS CURRENT AND FUTURE TYPE ANALYSIS, 2025–2034, (USD MILLION)
FIGURE 79 CHINA ALLERGY DIAGNOSTICS CURRENT AND FUTURE END USER ANALYSIS, 2025–2034, (USD MILLION)
FIGURE 80 JAPAN ALLERGY DIAGNOSTICS CURRENT AND FUTURE TYPE ANALYSIS, 2025–2034, (USD MILLION)
FIGURE 81 JAPAN ALLERGY DIAGNOSTICS CURRENT AND FUTURE END USER ANALYSIS, 2025–2034, (USD MILLION)
FIGURE 82 AUSTRALIA ALLERGY DIAGNOSTICS CURRENT AND FUTURE TYPE ANALYSIS, 2025–2034, (USD MILLION)
FIGURE 83 AUSTRALIA ALLERGY DIAGNOSTICS CURRENT AND FUTURE END USER ANALYSIS, 2025–2034, (USD MILLION)
FIGURE 84 CAMBODIA ALLERGY DIAGNOSTICS CURRENT AND FUTURE TYPE ANALYSIS, 2025–2034, (USD MILLION)
FIGURE 85 CAMBODIA ALLERGY DIAGNOSTICS CURRENT AND FUTURE END USER ANALYSIS, 2025–2034, (USD MILLION)
FIGURE 86 FIJI ALLERGY DIAGNOSTICS CURRENT AND FUTURE TYPE ANALYSIS, 2025–2034, (USD MILLION)
FIGURE 87 FIJI ALLERGY DIAGNOSTICS CURRENT AND FUTURE END USER ANALYSIS, 2025–2034, (USD MILLION)
FIGURE 88 INDONESIA ALLERGY DIAGNOSTICS CURRENT AND FUTURE TYPE ANALYSIS, 2025–2034, (USD MILLION)
FIGURE 89 INDONESIA ALLERGY DIAGNOSTICS CURRENT AND FUTURE END USER ANALYSIS, 2025–2034, (USD MILLION)
FIGURE 90 SOUTH KOREA ALLERGY DIAGNOSTICS CURRENT AND FUTURE TYPE ANALYSIS, 2025–2034, (USD MILLION)
FIGURE 91 SOUTH KOREA ALLERGY DIAGNOSTICS CURRENT AND FUTURE END USER ANALYSIS, 2025–2034, (USD MILLION)
FIGURE 92 REST OF EAST ASIA AND PACIFIC ALLERGY DIAGNOSTICS CURRENT AND FUTURE TYPE ANALYSIS, 2025–2034, (USD MILLION)
FIGURE 93 REST OF EAST ASIA AND PACIFIC ALLERGY DIAGNOSTICS CURRENT AND FUTURE END USER ANALYSIS, 2025–2034, (USD MILLION)
FIGURE 94 SEA AND SOUTH ASIA ALLERGY DIAGNOSTICS CURRENT AND FUTURE MARKET VOLUME SHARE REGIONAL ANALYSIS, 2025–2034, (USD MILLION)
FIGURE 95 BANGLADESH ALLERGY DIAGNOSTICS CURRENT AND FUTURE TYPE ANALYSIS, 2025–2034, (USD MILLION)
FIGURE 96 BANGLADESH ALLERGY DIAGNOSTICS CURRENT AND FUTURE END USER ANALYSIS, 2025–2034, (USD MILLION)
FIGURE 97 NEW ZEALAND ALLERGY DIAGNOSTICS CURRENT AND FUTURE TYPE ANALYSIS, 2025–2034, (USD MILLION)
FIGURE 98 NEW ZEALAND ALLERGY DIAGNOSTICS CURRENT AND FUTURE END USER ANALYSIS, 2025–2034, (USD MILLION)
FIGURE 99 INDIA ALLERGY DIAGNOSTICS CURRENT AND FUTURE TYPE ANALYSIS, 2025–2034, (USD MILLION)
FIGURE 100 INDIA ALLERGY DIAGNOSTICS CURRENT AND FUTURE END USER ANALYSIS, 2025–2034, (USD MILLION)
FIGURE 101 SINGAPORE ALLERGY DIAGNOSTICS CURRENT AND FUTURE TYPE ANALYSIS, 2025–2034, (USD MILLION)
FIGURE 102 SINGAPORE ALLERGY DIAGNOSTICS CURRENT AND FUTURE END USER ANALYSIS, 2025–2034, (USD MILLION)
FIGURE 103 THAILAND ALLERGY DIAGNOSTICS CURRENT AND FUTURE TYPE ANALYSIS, 2025–2034, (USD MILLION)
FIGURE 104 THAILAND ALLERGY DIAGNOSTICS CURRENT AND FUTURE END USER ANALYSIS, 2025–2034, (USD MILLION)
FIGURE 105 TAIWAN ALLERGY DIAGNOSTICS CURRENT AND FUTURE TYPE ANALYSIS, 2025–2034, (USD MILLION)
FIGURE 106 TAIWAN ALLERGY DIAGNOSTICS CURRENT AND FUTURE END USER ANALYSIS, 2025–2034, (USD MILLION)
FIGURE 107 MALAYSIA ALLERGY DIAGNOSTICS CURRENT AND FUTURE TYPE ANALYSIS, 2025–2034, (USD MILLION)
FIGURE 108 MALAYSIA ALLERGY DIAGNOSTICS CURRENT AND FUTURE END USER ANALYSIS, 2025–2034, (USD MILLION)
FIGURE 109 REST OF SEA AND SOUTH ASIA ALLERGY DIAGNOSTICS CURRENT AND FUTURE TYPE ANALYSIS, 2025–2034, (USD MILLION)
FIGURE 110 REST OF SEA AND SOUTH ASIA ALLERGY DIAGNOSTICS CURRENT AND FUTURE END USER ANALYSIS, 2025–2034, (USD MILLION)
FIGURE 111 MIDDLE EAST AND AFRICA ALLERGY DIAGNOSTICS CURRENT AND FUTURE MARKET VOLUME SHARE REGIONAL ANALYSIS, 2025–2034, (USD MILLION)
FIGURE 112 GCC COUNTRIES ALLERGY DIAGNOSTICS CURRENT AND FUTURE TYPE ANALYSIS, 2025–2034, (USD MILLION)
FIGURE 113 GCC COUNTRIES ALLERGY DIAGNOSTICS CURRENT AND FUTURE END USER ANALYSIS, 2025–2034, (USD MILLION)
FIGURE 114 SAUDI ARABIA ALLERGY DIAGNOSTICS CURRENT AND FUTURE TYPE ANALYSIS, 2025–2034, (USD MILLION)
FIGURE 115 SAUDI ARABIA ALLERGY DIAGNOSTICS CURRENT AND FUTURE END USER ANALYSIS, 2025–2034, (USD MILLION)
FIGURE 116 UAE ALLERGY DIAGNOSTICS CURRENT AND FUTURE TYPE ANALYSIS, 2025–2034, (USD MILLION)
FIGURE 117 UAE ALLERGY DIAGNOSTICS CURRENT AND FUTURE END USER ANALYSIS, 2025–2034, (USD MILLION)
FIGURE 118 BAHRAIN ALLERGY DIAGNOSTICS CURRENT AND FUTURE TYPE ANALYSIS, 2025–2034, (USD MILLION)
FIGURE 119 BAHRAIN ALLERGY DIAGNOSTICS CURRENT AND FUTURE END USER ANALYSIS, 2025–2034, (USD MILLION)
FIGURE 120 KUWAIT ALLERGY DIAGNOSTICS CURRENT AND FUTURE TYPE ANALYSIS, 2025–2034, (USD MILLION)
FIGURE 121 KUWAIT ALLERGY DIAGNOSTICS CURRENT AND FUTURE END USER ANALYSIS, 2025–2034, (USD MILLION)
FIGURE 122 OMAN ALLERGY DIAGNOSTICS CURRENT AND FUTURE TYPE ANALYSIS, 2025–2034, (USD MILLION)
FIGURE 123 OMAN ALLERGY DIAGNOSTICS CURRENT AND FUTURE END USER ANALYSIS, 2025–2034, (USD MILLION)
FIGURE 124 QATAR ALLERGY DIAGNOSTICS CURRENT AND FUTURE TYPE ANALYSIS, 2025–2034, (USD MILLION)
FIGURE 125 QATAR ALLERGY DIAGNOSTICS CURRENT AND FUTURE END USER ANALYSIS, 2025–2034, (USD MILLION)
FIGURE 126 EGYPT ALLERGY DIAGNOSTICS CURRENT AND FUTURE TYPE ANALYSIS, 2025–2034, (USD MILLION)
FIGURE 127 EGYPT ALLERGY DIAGNOSTICS CURRENT AND FUTURE END USER ANALYSIS, 2025–2034, (USD MILLION)
FIGURE 128 NIGERIA ALLERGY DIAGNOSTICS CURRENT AND FUTURE TYPE ANALYSIS, 2025–2034, (USD MILLION)
FIGURE 129 NIGERIA ALLERGY DIAGNOSTICS CURRENT AND FUTURE END USER ANALYSIS, 2025–2034, (USD MILLION)
FIGURE 130 SOUTH AFRICA ALLERGY DIAGNOSTICS CURRENT AND FUTURE TYPE ANALYSIS, 2025–2034, (USD MILLION)
FIGURE 131 SOUTH AFRICA ALLERGY DIAGNOSTICS CURRENT AND FUTURE END USER ANALYSIS, 2025–2034, (USD MILLION)
FIGURE 132 ISRAEL ALLERGY DIAGNOSTICS CURRENT AND FUTURE TYPE ANALYSIS, 2025–2034, (USD MILLION)
FIGURE 133 ISRAEL ALLERGY DIAGNOSTICS CURRENT AND FUTURE END USER ANALYSIS, 2025–2034, (USD MILLION)
FIGURE 134 REST OF MEA ALLERGY DIAGNOSTICS CURRENT AND FUTURE TYPE ANALYSIS, 2025–2034, (USD MILLION)
FIGURE 135 REST OF MEA ALLERGY DIAGNOSTICS CURRENT AND FUTURE END USER ANALYSIS, 2025–2034, (USD MILLION)
FIGURE 136 U. S. MARKET SHARE ANALYSIS BY TYPE (2024)
FIGURE 137 U. S. MARKET SHARE ANALYSIS BY END USER (2024)
FIGURE 138 CANADA MARKET SHARE ANALYSIS BY TYPE (2024)
FIGURE 139 CANADA MARKET SHARE ANALYSIS BY END USER (2024)
FIGURE 140 MEXICO MARKET SHARE ANALYSIS BY TYPE (2024)
FIGURE 141 MEXICO MARKET SHARE ANALYSIS BY END USER (2024)
FIGURE 142 CHINA MARKET SHARE ANALYSIS BY TYPE (2024)
FIGURE 143 CHINA MARKET SHARE ANALYSIS BY END USER (2024)
FIGURE 144 JAPAN MARKET SHARE ANALYSIS BY TYPE (2024)
FIGURE 145 JAPAN MARKET SHARE ANALYSIS BY END USER (2024)
FIGURE 146 INDIA MARKET SHARE ANALYSIS BY TYPE (2024)
FIGURE 147 INDIA MARKET SHARE ANALYSIS BY END USER (2024)
FIGURE 148 SOUTH KOREA MARKET SHARE ANALYSIS BY TYPE (2024)
FIGURE 149 SOUTH KOREA MARKET SHARE ANALYSIS BY END USER (2024)
FIGURE 150 SAUDI ARABIA MARKET SHARE ANALYSIS BY TYPE (2024)
FIGURE 151 SAUDI ARABIA MARKET SHARE ANALYSIS BY END USER (2024)
FIGURE 152 UAE MARKET SHARE ANALYSIS BY TYPE (2024)
FIGURE 153 UAE MARKET SHARE ANALYSIS BY END USER (2024)
FIGURE 154 EGYPT MARKET SHARE ANALYSIS BY TYPE (2024)
FIGURE 155 EGYPT MARKET SHARE ANALYSIS BY END USER (2024)
FIGURE 156 NIGERIA MARKET SHARE ANALYSIS BY TYPE (2024)
FIGURE 157 NIGERIA MARKET SHARE ANALYSIS BY END USER (2024)
FIGURE 158 SOUTH AFRICA MARKET SHARE ANALYSIS BY TYPE (2024)
FIGURE 159 SOUTH AFRICA MARKET SHARE ANALYSIS BY END USER (2024)
FIGURE 160 GERMANY MARKET SHARE ANALYSIS BY TYPE (2024)
FIGURE 161 GERMANY MARKET SHARE ANALYSIS BY END USER (2024)
FIGURE 162 FRANCE MARKET SHARE ANALYSIS BY TYPE (2024)
FIGURE 163 FRANCE MARKET SHARE ANALYSIS BY END USER (2024)
FIGURE 164 UK MARKET SHARE ANALYSIS BY TYPE (2024)
FIGURE 165 UK MARKET SHARE ANALYSIS BY END USER (2024)
FIGURE 166 SPAIN MARKET SHARE ANALYSIS BY TYPE (2024)
FIGURE 167 SPAIN MARKET SHARE ANALYSIS BY END USER (2024)
FIGURE 168 ITALY MARKET SHARE ANALYSIS BY TYPE (2024)
FIGURE 169 ITALY MARKET SHARE ANALYSIS BY END USER (2024)
FIGURE 170 BRAZIL MARKET SHARE ANALYSIS BY TYPE (2024)
FIGURE 171 BRAZIL MARKET SHARE ANALYSIS BY END USER (2024)
FIGURE 172 ARGENTINA MARKET SHARE ANALYSIS BY TYPE (2024)
FIGURE 173 ARGENTINA MARKET SHARE ANALYSIS BY END USER (2024)
FIGURE 174 COLUMBIA MARKET SHARE ANALYSIS BY TYPE (2024)
FIGURE 175 COLUMBIA MARKET SHARE ANALYSIS BY END USER (2024)
FIGURE 176 GLOBAL ALLERGY DIAGNOSTICS CURRENT AND FUTURE MARKET KEY COUNTRY LEVEL ANALYSIS, 2024–2034, (USD MILLION)
FIGURE 177 FINANCIAL OVERVIEW:
Key Player Analysis
Alerchek Inc.: Alerchek positions as a niche player focused on rapid allergy screening and point-of-care formats. The portfolio centers on lateral flow and ELISA-based kits for IgE detection across inhaled and food allergens, targeting physician offices and mid-size labs. In 2025, the company is expanding pharmacy and primary care distribution, piloting AI-assisted readers for semi-quantitative interpretation and integrating digital result capture into EHRs. The strategy aims to grow recurring consumables revenue by double digits through broader access and faster turnaround. Alerchek’s differentiators include compact test formats, competitive pricing, and strong penetration in ambulatory care. You should expect incremental share gains as POC adoption rises and as payers support lower-cost screening pathways.
Omega Diagnostics Group PLC: Omega operates as a challenger with a diversified IVD footprint and an expanding allergy diagnostics line in select markets. Core offerings include ELISA platforms, allergen panels, and accessories that fit mid-throughput laboratory workflows. In 2025, Omega is refocusing on profitable segments, streamlining manufacturing, and partnering with regional distributors in Africa, South Asia, and Latin America to accelerate market entry. The company is investing in menu expansion for food allergens and in data connectivity that links instruments to LIS platforms. Omega differentiates on affordability and channel reach, positioning for volume growth in price-sensitive geographies. The near-term aim is high single-digit revenue growth from allergy testing, supported by tender wins and private lab contracts.
bioMérieux SA: bioMérieux is a leader with broad IVD scale and strong hospital relationships. The company’s allergy diagnostics portfolio leverages automated immunoassay systems, multiplex panels, and lab informatics that enable high-throughput IgE testing. In 2025, bioMérieux is integrating AI-driven quality controls and predictive maintenance across installed analyzers, reducing downtime and improving reproducibility. Strategic initiatives include targeted partnerships with hospital networks in Europe and North America, and selective acquisitions to strengthen assay menus. With a large installed base and service infrastructure, bioMérieux benefits from durable consumables pull-through. The differentiators are automation depth, compliance track record, and enterprise connectivity. Expect steady mid- to high-single-digit growth from allergy testing as hospitals consolidate vendors and favor integrated platforms.
Hitachi Chemical Diagnostic Inc.: Hitachi Chemical Diagnostic (often branded within the Hitachi group) positions as an innovator in automated immunoassay systems and reagent development for allergy testing. The portfolio emphasizes compact analyzers for medium labs, chemiluminescent assays, and standardized allergen panels. In 2025, the company is advancing instrument miniaturization, expanding into Southeast Asia through local distributors, and deploying remote device monitoring to lower service costs. It is also pursuing co-development agreements for advanced food allergen assays with regional research institutes. Differentiators include manufacturing quality, instrument reliability, and cost-efficient reagent packs designed for steady throughput. The growth thesis rests on capturing share in mid-tier laboratories and supporting rising test volumes with stable total cost of ownership.
Market Key Players:
Eurofins Scientific
Siemens Healthcare Diagnostics, Inc.
Alerchek Inc.
Thermo Fisher Scientific Inc.
Omega Diagnostic LLC
bioMérieux SA
Danaher Corporation
Hitachi Chemical Diagnostic Inc.
Omega Diagnostics Group PLC
Driver:
Rising Global Allergy Prevalence
As of 2025, the global burden of allergic diseases continues to climb, with asthma, allergic rhinitis, and food-related hypersensitivities affecting more than 30% of the population in urban regions. Rising exposure to air pollution, dietary shifts, and lifestyle changes are intensifying the prevalence of these conditions, creating sustained demand for accurate diagnostic solutions. The market, valued at USD 6.1 billion in 2025, is projected to grow at a CAGR of over 11% through 2033, with diagnostics positioned as a critical first step in effective allergy management.
Technology-Led Advances in Diagnostic Accuracy
Technology is accelerating this growth. Advanced immunoassays, PCR-based platforms, and next-generation sequencing (NGS) are improving test sensitivity and specificity, enabling earlier and more reliable detection. Companies investing in automated analyzers and multiplex testing are gaining competitive advantage by reducing turnaround times and expanding test menus. For investors, the convergence of rising disease incidence and technological progress signals a strong growth trajectory for the sector.
Restraint:
High Cost Barriers in Advanced Testing
Despite rising demand, affordability remains a significant barrier. Advanced molecular and sequencing-based tests often cost several hundred dollars per patient, limiting adoption in low- and middle-income countries where healthcare budgets are constrained. This cost burden restricts routine screening and delays diagnosis, particularly in regions where allergy prevalence is rising fastest.
Regulatory and Reimbursement Constraints
Regulatory and reimbursement challenges further slow market expansion. Lengthy approval timelines for new diagnostic products increase development costs, while inconsistent reimbursement policies reduce patient access. In Europe, for example, reimbursement rates for advanced allergy panels remain below 50% in several markets, discouraging adoption. These structural hurdles create uneven growth across geographies and force manufacturers to balance innovation with affordability.
Opportunity:
Rapid Expansion in Emerging Healthcare Markets
Emerging economies represent the strongest growth frontier. Rapid urbanization in Asia-Pacific and Latin America is driving higher allergy incidence, while healthcare spending in these regions is expanding at annual rates above 8%. By 2030, Asia-Pacific alone is expected to account for more than 25% of global allergy diagnostics revenue, creating significant opportunities for companies offering cost-effective and accessible solutions.
Digital Health and Remote Allergy Testing Integration
Digital health platforms add another layer of opportunity. The integration of allergy testing into telemedicine and e-health ecosystems is expanding patient access, particularly in underserved areas. Remote testing kits and digital reporting tools are gaining traction, allowing patients to complete diagnostics at home and share results with clinicians in real time. This shift is expected to generate new revenue streams and strengthen recurring demand for consumables and services.
Trend:
Growth of Point-of-Care Allergy Diagnostics
Point-of-care (POC) testing is reshaping the market in 2025. Rapid test kits that deliver results within minutes are increasingly adopted in primary care and pharmacy settings, particularly in regions with limited laboratory infrastructure. The global POC allergy testing segment is projected to grow at a CAGR above 13% through 2030, supported by rising demand for convenience and faster clinical decision-making.
Shift Toward Precision and Personalized Allergy Testing
At the same time, precision medicine is gaining momentum. Advances in molecular diagnostics and genomic profiling are enabling allergen-specific insights that support personalized treatment plans. Leading diagnostic providers are investing in multiplex assays capable of screening dozens of allergens simultaneously, improving efficiency and tailoring care to individual patient profiles. This trend is not only enhancing patient outcomes but also reshaping competitive strategies, as companies that integrate precision diagnostics into broader care pathways are positioned to capture long-term market share.
Recent Developments
October 2024 – ALK: The company launched a new series of allergy skin testing devices, including the AllerTest-1, AllerTest-8, and AllerTest-10, designed to streamline allergy testing and diagnosis. This introduction strengthens ALK’s market position by offering advanced, user-friendly tools for healthcare providers.
March 2025 – Thermo Fisher Scientific: The company released the 2025 edition of its Phadia product catalogue for the ImmunoCAP and EliA systems. This move reinforces its product leadership in the in-vitro diagnostics space by updating offerings for its flagship automated testing platforms.
April 2025 – Beckman Coulter Life Sciences: The firm introduced its next-generation Basophil Activation Test (BAT) to improve food allergy research without exposing patients to potential allergens. This provides a safer and more efficient alternative to traditional oral food challenges, helping to accelerate food allergy research and drug development.
June 2025 – Macro Array Diagnostics (MADx): The Viennese allergy diagnostics manufacturer entered into a partnership with the Carlsen publishing house. This collaboration is aimed at creating educational materials to increase public awareness and understanding of allergies, expanding the company's reach beyond clinical settings.