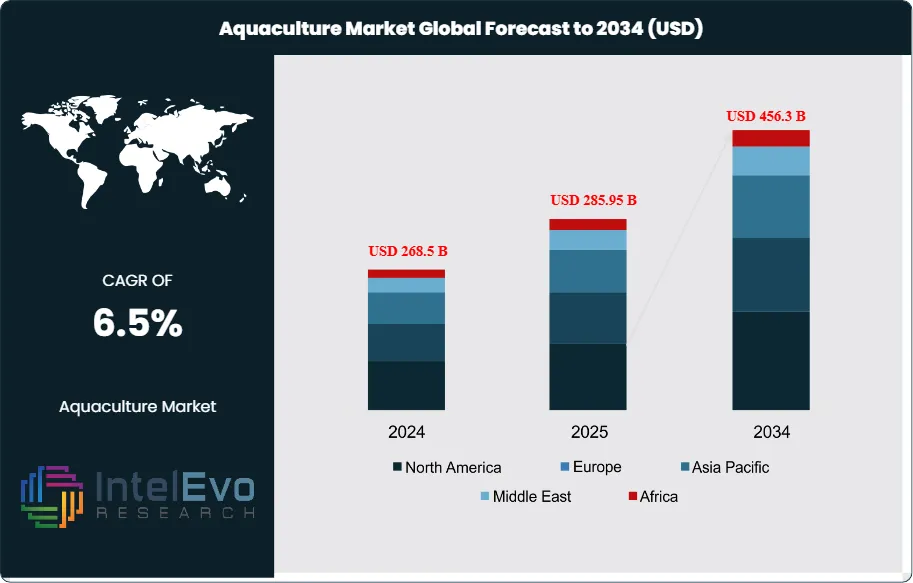
The Aquaculture Market, valued at USD 268.5 billion in 2024, is projected to reach USD 456.3 billion by 2034, advancing at a CAGR of 6.5% during 2025–2034, driven by rising seafood demand and sustainability concerns, offering strategic opportunities for stakeholders across food production, technology, and investment sectors.
Aquaculture has evolved into one of the most critical pillars of global food security, providing a reliable and regulated alternative to capture fisheries. With wild fish stocks under increasing pressure from overfishing and environmental degradation, controlled breeding, rearing, and harvesting of aquatic species such as fish, crustaceans, mollusks, and seaweed have become essential to ensuring a stable seafood supply. The industry now accounts for over half of the world’s seafood production, underscoring its growing role in meeting the dietary needs of a rapidly expanding population.
Market growth is supported by multiple drivers, most notably the rising demand for protein-rich diets as the global population heads toward 10.7 billion by 2050. Seafood consumption is further reinforced by consumer preference for nutritious, heart-healthy, and sustainable food sources. In addition, supportive government initiatives—including subsidies, tax incentives, and policies promoting sustainable aquaculture practices—are fostering long-term industry resilience and encouraging adoption in both developed and emerging economies.
Technological innovation remains a defining force in shaping market dynamics. Advanced systems such as recirculating aquaculture systems (RAS), integrated multi-trophic aquaculture (IMTA), offshore farming platforms, and genetically improved species are enabling higher yields, improved disease resistance, and reduced environmental impact. The emergence of alternative feed solutions, including insect- and algae-based proteins, is also addressing ecological challenges tied to fishmeal dependency, ensuring more sustainable supply chains.
Regionally, Asia-Pacific dominates the market, with China, India, and Vietnam spearheading production due to favorable climatic conditions, strong domestic demand, and technology adoption. Norway remains a global leader in salmon aquaculture, while opportunities are emerging in Africa and Latin America, where abundant water resources and improving infrastructure are attracting investor interest.
Looking ahead, the aquaculture industry is poised for sustained expansion, shaped by the dual imperatives of meeting rising seafood demand and ensuring environmental sustainability. Opportunities in premium organic seafood, aquaponics-based integrated farming, and biotechnology-driven productivity improvements are expected to define the next phase of growth, positioning aquaculture as a cornerstone of the future global food economy.
Market Growth: The global Aquaculture Market is projected to grow from USD 268.5 billion in 2024 to USD 456.3 billion by 2034, advancing at a CAGR of 6.5%. Growth is fueled by rising seafood consumption, overexploitation of wild fisheries, and the shift toward sustainable protein sources.
Culture Environment: Freshwater aquaculture leads the market, accounting for over 48.6% of total revenue in 2024. Its dominance is attributed to ease of accessibility, lower operational costs, and the widespread farming of species such as carp, tilapia, and catfish.
Species: Aquatic animals represented the largest share, capturing more than 81.3% in 2024. Fish species remain the primary contributor, with salmon, carp, and tilapia driving volume due to high demand across global food supply chains.
By End Use: The food industry dominates aquaculture applications, holding more than 71.2% market share in 2024. This is driven by growing global demand for seafood as a staple protein source, supported by retail expansion and international trade.
Driver: Rising global population and growing preference for protein-rich, health-focused diets are accelerating aquaculture adoption. In 2022, aquaculture already accounted for over 50% of seafood consumed worldwide, a figure expected to climb further.
Restraint: Environmental and disease management challenges, including water pollution and the spread of pathogens in densely stocked farms, pose risks to productivity and sustainability, limiting potential output in certain regions.
Opportunity: Offshore aquaculture and alternative feed solutions, such as algae- and insect-based proteins, present significant growth opportunities by addressing ecological concerns and enabling large-scale, sustainable production.
Trend: Advanced farming technologies—including recirculating aquaculture systems (RAS), integrated multi-trophic aquaculture (IMTA), and biotechnology for disease-resistant species—are reshaping industry efficiency and reducing environmental impact.
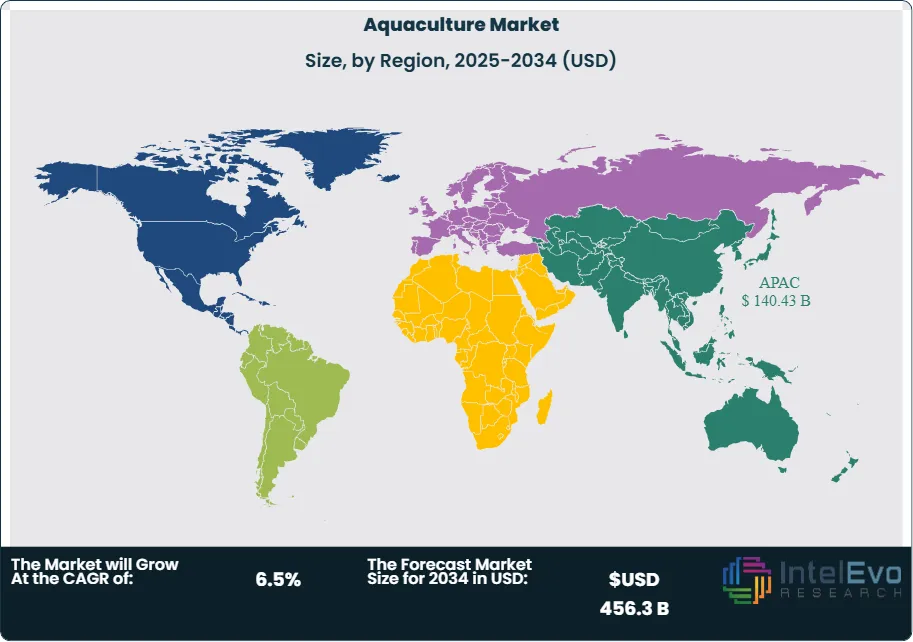
Regional Analysis: Asia-Pacific dominates the market with a 52.3% share in 2024, valued at USD 137.7 billion, led by China, India, and Vietnam. Meanwhile, Africa and Latin America are emerging hotspots due to favorable climatic conditions and untapped water resources attracting new investments.
Environment Analysis
Freshwater Aquaculture: As of 2025, freshwater aquaculture continues to represent the largest share of the global market, accounting for nearly half of overall production. Its dominance stems from the abundance of inland water bodies, relatively low capital requirements, and operational efficiencies compared to marine and brackish systems. Popular species such as carp, tilapia, and trout thrive in ponds, lakes, and controlled tank systems, making this environment highly adaptable and scalable. Rising consumer demand for affordable, protein-rich fish varieties, especially across Asia and Africa, is expected to sustain long-term growth.
Marine Water Aquaculture: Marine water farming, or mariculture, remains a high-value segment, supported by strong global demand for premium seafood such as salmon, shrimp, and oysters. While it accounts for a smaller share compared to freshwater aquaculture, this segment benefits from its ability to command higher prices in international markets. Advances in offshore farming systems, cage technologies, and digital monitoring tools are enabling sustainable production at scale, helping countries like Norway, Chile, and Japan strengthen their leadership in marine aquaculture. With rising pressure on wild fisheries, mariculture is expected to gain further prominence in the next decade.
Brackish Water Aquaculture: Brackish water systems occupy a niche yet growing share of the aquaculture market, particularly in coastal regions with natural estuaries or artificially managed salinity levels. Species such as barramundi and seabass dominate this category due to their preference for mixed-salinity habitats. In 2025, this environment is gaining traction as producers increasingly adopt hybrid farming systems that leverage transitional water zones for efficiency. The segment also benefits from consumer interest in diverse, nutrient-rich fish varieties, positioning it as an attractive growth area for markets in Southeast Asia and the Middle East.
Species Analysis
Aquatic Animals: Aquatic animals remain the cornerstone of global aquaculture, representing more than 80% of market share in 2025. Fish species—including carp, salmon, tilapia, and catfish—continue to dominate production, while crustaceans such as shrimp and crabs, along with mollusks like mussels and oysters, expand the segment’s diversity. Strong consumer demand for protein-rich diets, coupled with improved breeding, vaccination, and water quality management systems, has enhanced productivity and disease resistance across species. Global leaders such as Mowi ASA, Cooke Aquaculture, and China’s aquaculture cooperatives are investing in advanced hatcheries and sustainable farming models to meet surging seafood demand.
Aquatic Plants: Although smaller in scale, the aquatic plant segment—encompassing seaweed and microalgae—is experiencing rapid growth. Demand is being driven by applications in pharmaceuticals, nutraceuticals, cosmetics, and alternative proteins. Seaweed farming, in particular, is gaining momentum in countries like South Korea, China, and Indonesia, where government incentives and sustainability initiatives support large-scale cultivation. Microalgae are increasingly used in biofuel development, high-value nutritional supplements, and eco-friendly packaging. By 2025, technological innovations such as automated harvesting and bioreactor systems are positioning aquatic plants as a critical growth frontier in aquaculture.
End Use Analysis
Food Industry: The food industry remains the dominant end-use sector, accounting for over 70% of aquaculture demand in 2025. Rising global seafood consumption, coupled with growing health awareness around omega-3 fatty acids and lean proteins, continues to drive this segment. Farmed salmon, tilapia, and shrimp are widely integrated into retail, hospitality, and export supply chains, ensuring aquaculture’s central role in global food security. The sector is also benefiting from consumer shifts toward traceable and sustainably certified seafood, encouraging adoption of eco-labeling and blockchain-enabled transparency.
Agriculture: Agriculture applications are gaining ground through aquaponics, where fish farming is combined with hydroponic plant cultivation. Although relatively small in market share, this segment appeals to urban farmers and eco-conscious consumers seeking resource-efficient systems that recycle water and minimize chemical fertilizers. Cities across North America, Europe, and the Middle East are witnessing increased investment in aquaponics as part of controlled-environment agriculture (CEA) strategies.
Animal Feed: Aquaculture by-products play a vital role in the animal feed industry. Fishmeal and fish oil derived from processing remain highly valued for poultry, swine, and livestock feed, thanks to their high protein and omega-3 content. As global demand for feed-grade fishmeal rises, producers are also exploring alternatives such as algae-based and insect-based ingredients to reduce reliance on wild-caught fish. This shift is expected to improve sustainability while maintaining nutritional integrity across feed supply chains.
Regional Analysis
Asia-Pacific: Asia-Pacific leads the global aquaculture market, accounting for over half of total production and expected to surpass USD 140.43 Billion by 2024. China, India, Vietnam, and Indonesia dominate due to extensive water resources, favorable climates, and government-driven policies supporting sustainable practices. Rapid urbanization and rising seafood consumption across the region further reinforce demand. Investments in advanced hatcheries, integrated aquaculture systems, and offshore farming technologies are expanding production capacity, making Asia-Pacific the undisputed growth hub of the industry.
North America: North America is witnessing accelerated growth driven by technological innovation, sustainable farming initiatives, and increasing consumer preference for locally sourced seafood. The U.S. and Canada are investing in recirculating aquaculture systems (RAS) to reduce dependence on imports and minimize environmental impacts. Regulatory support and private investments in sustainable salmon and trout farming are also strengthening regional market prospects.
Europe: Europe remains a mature yet innovation-driven market, shaped by stringent sustainability regulations and strong demand for premium seafood. Norway leads the region with large-scale salmon farming, while countries such as Scotland, Spain, and Greece are key players in marine and brackish water production. The European Union’s emphasis on green aquaculture practices, coupled with funding for R&D in aquaponics and offshore systems, ensures continued expansion.
Emerging Regions: Latin America and Africa are increasingly viewed as high-potential markets due to favorable climatic conditions, untapped water resources, and rising investment in aquaculture infrastructure. Chile has established itself as a global salmon hub, while nations like Brazil, Kenya, and Nigeria are ramping up production to enhance food security and create export opportunities. These emerging regions are expected to play a critical role in diversifying global supply chains in the coming decade.
By Environment (Marine Water, Fresh Water, Brackish Water), By Species (Aquatic Plants , Aquatic Animals), By End-use (Food Industry, Agriculture, Animal Feed, Others)
Research Methodology
Primary Research- 100 Interviews of Stakeholders
Secondary Research
Desk Research
Regional scope
North America (United States, Canada, Mexico)
Latin America (Brazil, Argentina, Columbia)
East Asia And Pacific (China, Japan, South Korea, Australia, Cambodia, Fiji, Indonesia)
Sea And South Asia (India, Singapore, Thailand, Taiwan, Malaysia)
Eastern Europe (Poland, Russia, Czech Republic, Romania)
Western Europe (Germany, U.K., France, Spain, Itlay)
Middle East & Africa (GCC Countries, Egypt, Nigeria, South Africa, Israel)
Competitive Landscape
Thai Union Group Plc, Cooke Aquaculture Inc., Grieg Seafood, Leroy Seafood Group, Promarisco, Mowi ASA, Huon Aquaculture Group Pty Ltd., Cermaq Group AS, Eastern Fish Company, Asmak, Blue Ridge Aquaculture, Inc., Nireus Aquaculture S.A., Bakkafrost Scotland, SalMar, Other Key Players
Customization Scope
Customization for segments, region/country-level will be provided. Moreover, additional customization can be done based on the requirements.
Pricing and Purchase Options
Avail customized purchase options to meet your exact research needs. We have three licenses to opt for: Single User License, Multi-User License (Up to 5 Users), Corporate Use License (Unlimited User and Printable PDF).
TABLE OF CONTENTS
1. EXECUTIVE SUMMARY
1.1. MARKET SNAPSHOT
1.2. KEY FINDINGS & INSIGHTS
1.3. ANALYST RECOMMENDATIONS
1.4. FUTURE OUTLOOK
2. RESEARCH METHODOLOGY
2.1. MARKET DEFINITION & SCOPE
2.2. RESEARCH OBJECTIVES: PRIMARY & SECONDARY DATA SOURCES
2.3. DATA COLLECTION SOURCES
2.3.1. COVERAGE OF 100+ PRIMARY RESEARCH/CONSULTATION CALLS WITH INDUSTRY STAKEHOLDERS
FIGURE 17 NORTH AMERICA AQUACULTURE CURRENT AND FUTURE TYPE ANALYSIS, 2025–2034, (USD MILLION)
FIGURE 18 NORTH AMERICA AQUACULTURE CURRENT AND FUTURE END USER ANALYSIS, 2025–2034, (USD MILLION)
FIGURE 19 MARKET SHARE BY COUNTRY
FIGURE 20 LATIN AMERICA AQUACULTURE CURRENT AND FUTURE TYPE ANALYSIS, 2025–2034, (USD MILLION)
FIGURE 21 LATIN AMERICA AQUACULTURE CURRENT AND FUTURE END USER ANALYSIS, 2025–2034, (USD MILLION)
FIGURE 22 MARKET SHARE BY COUNTRY
FIGURE 23 EASTERN EUROPE AQUACULTURE CURRENT AND FUTURE TYPE ANALYSIS, 2025–2034, (USD MILLION)
FIGURE 24 EASTERN EUROPE AQUACULTURE CURRENT AND FUTURE END USER ANALYSIS, 2025–2034, (USD MILLION)
FIGURE 25 MARKET SHARE BY COUNTRY
FIGURE 26 WESTERN EUROPE AQUACULTURE CURRENT AND FUTURE TYPE ANALYSIS, 2025–2034, (USD MILLION)
FIGURE 27 WESTERN EUROPE AQUACULTURE CURRENT AND FUTURE END USER ANALYSIS, 2025–2034, (USD MILLION)
FIGURE 28 MARKET SHARE BY COUNTRY
FIGURE 29 EAST ASIA AND PACIFIC AQUACULTURE CURRENT AND FUTURE TYPE ANALYSIS, 2025–2034, (USD MILLION)
FIGURE 30 EAST ASIA AND PACIFIC AQUACULTURE CURRENT AND FUTURE END USER ANALYSIS, 2025–2034, (USD MILLION)
FIGURE 31 MARKET SHARE BY COUNTRY
FIGURE 32 SEA AND SOUTH ASIA AQUACULTURE CURRENT AND FUTURE TYPE ANALYSIS, 2025–2034, (USD MILLION)
FIGURE 33 SEA AND SOUTH ASIA AQUACULTURE CURRENT AND FUTURE END USER ANALYSIS, 2025–2034, (USD MILLION)
FIGURE 34 MARKET SHARE BY COUNTRY
FIGURE 35 MIDDLE EAST AND AFRICA AQUACULTURE CURRENT AND FUTURE TYPE ANALYSIS, 2025–2034, (USD MILLION)
FIGURE 36 MIDDLE EAST AND AFRICA AQUACULTURE CURRENT AND FUTURE END USER ANALYSIS, 2025–2034, (USD MILLION)
FIGURE 37 NORTH AMERICA AQUACULTURE CURRENT AND FUTURE MARKET VOLUME SHARE REGIONAL ANALYSIS, 2025–2034, (USD MILLION)
FIGURE 38 U.S. AQUACULTURE CURRENT AND FUTURE TYPE ANALYSIS, 2025–2034, (USD MILLION)
FIGURE 39 U.S. AQUACULTURE CURRENT AND FUTURE END USER ANALYSIS, 2025–2034, (USD MILLION)
FIGURE 40 CANADA AQUACULTURE CURRENT AND FUTURE TYPE ANALYSIS, 2025–2034, (USD MILLION)
FIGURE 41 CANADA AQUACULTURE CURRENT AND FUTURE END USER ANALYSIS, 2025–2034, (USD MILLION)
FIGURE 42 LATIN AMERICA AQUACULTURE CURRENT AND FUTURE MARKET VOLUME SHARE REGIONAL ANALYSIS, 2025–2034, (USD MILLION)
FIGURE 43 MEXICO AQUACULTURE CURRENT AND FUTURE TYPE ANALYSIS, 2025–2034, (USD MILLION)
FIGURE 44 MEXICO AQUACULTURE CURRENT AND FUTURE END USER ANALYSIS, 2025–2034, (USD MILLION)
FIGURE 45 BRAZIL AQUACULTURE CURRENT AND FUTURE TYPE ANALYSIS, 2025–2034, (USD MILLION)
FIGURE 46 BRAZIL AQUACULTURE CURRENT AND FUTURE END USER ANALYSIS, 2025–2034, (USD MILLION)
FIGURE 47 ARGENTINA AQUACULTURE CURRENT AND FUTURE TYPE ANALYSIS, 2025–2034, (USD MILLION)
FIGURE 48 ARGENTINA AQUACULTURE CURRENT AND FUTURE END USER ANALYSIS, 2025–2034, (USD MILLION)
FIGURE 49 COLUMBIA AQUACULTURE CURRENT AND FUTURE TYPE ANALYSIS, 2025–2034, (USD MILLION)
FIGURE 50 COLUMBIA AQUACULTURE CURRENT AND FUTURE END USER ANALYSIS, 2025–2034, (USD MILLION)
FIGURE 51 REST OF LATIN AMERICA AQUACULTURE CURRENT AND FUTURE TYPE ANALYSIS, 2025–2034, (USD MILLION)
FIGURE 52 REST OF LATIN AMERICA AQUACULTURE CURRENT AND FUTURE END USER ANALYSIS, 2025–2034, (USD MILLION)
FIGURE 53 EASTERN EUROPE AQUACULTURE CURRENT AND FUTURE MARKET VOLUME SHARE REGIONAL ANALYSIS, 2025–2034, (USD MILLION)
FIGURE 54 POLAND AQUACULTURE CURRENT AND FUTURE TYPE ANALYSIS, 2025–2034, (USD MILLION)
FIGURE 55 POLAND AQUACULTURE CURRENT AND FUTURE END USER ANALYSIS, 2025–2034, (USD MILLION)
FIGURE 56 RUSSIA AQUACULTURE CURRENT AND FUTURE TYPE ANALYSIS, 2025–2034, (USD MILLION)
FIGURE 57 RUSSIA AQUACULTURE CURRENT AND FUTURE END USER ANALYSIS, 2025–2034, (USD MILLION)
FIGURE 58 CZECH REPUBLIC AQUACULTURE CURRENT AND FUTURE TYPE ANALYSIS, 2025–2034, (USD MILLION)
FIGURE 59 CZECH REPUBLIC AQUACULTURE CURRENT AND FUTURE END USER ANALYSIS, 2025–2034, (USD MILLION)
FIGURE 60 ROMANIA AQUACULTURE CURRENT AND FUTURE TYPE ANALYSIS, 2025–2034, (USD MILLION)
FIGURE 61 ROMANIA AQUACULTURE CURRENT AND FUTURE END USER ANALYSIS, 2025–2034, (USD MILLION)
FIGURE 62 REST OF EASTERN EUROPE AQUACULTURE CURRENT AND FUTURE TYPE ANALYSIS, 2025–2034, (USD MILLION)
FIGURE 63 REST OF EASTERN EUROPE AQUACULTURE CURRENT AND FUTURE END USER ANALYSIS, 2025–2034, (USD MILLION)
FIGURE 64 WESTERN EUROPE AQUACULTURE CURRENT AND FUTURE MARKET VOLUME SHARE REGIONAL ANALYSIS, 2025–2034, (USD MILLION)
FIGURE 65 GERMANY AQUACULTURE CURRENT AND FUTURE TYPE ANALYSIS, 2025–2034, (USD MILLION)
FIGURE 66 GERMANY AQUACULTURE CURRENT AND FUTURE END USER ANALYSIS, 2025–2034, (USD MILLION)
FIGURE 67 FRANCE AQUACULTURE CURRENT AND FUTURE TYPE ANALYSIS, 2025–2034, (USD MILLION)
FIGURE 68 FRANCE AQUACULTURE CURRENT AND FUTURE END USER ANALYSIS, 2025–2034, (USD MILLION)
FIGURE 69 UK AQUACULTURE CURRENT AND FUTURE TYPE ANALYSIS, 2025–2034, (USD MILLION)
FIGURE 70 UK AQUACULTURE CURRENT AND FUTURE END USER ANALYSIS, 2025–2034, (USD MILLION)
FIGURE 71 SPAIN AQUACULTURE CURRENT AND FUTURE TYPE ANALYSIS, 2025–2034, (USD MILLION)
FIGURE 72 SPAIN AQUACULTURE CURRENT AND FUTURE END USER ANALYSIS, 2025–2034, (USD MILLION)
FIGURE 73 ITALY AQUACULTURE CURRENT AND FUTURE TYPE ANALYSIS, 2025–2034, (USD MILLION)
FIGURE 74 ITALY AQUACULTURE CURRENT AND FUTURE END USER ANALYSIS, 2025–2034, (USD MILLION)
FIGURE 75 REST OF WESTERN EUROPE AQUACULTURE CURRENT AND FUTURE TYPE ANALYSIS, 2025–2034, (USD MILLION)
FIGURE 76 REST OF WESTERN EUROPE AQUACULTURE CURRENT AND FUTURE END USER ANALYSIS, 2025–2034, (USD MILLION)
FIGURE 77 EAST ASIA AND PACIFIC AQUACULTURE CURRENT AND FUTURE MARKET VOLUME SHARE REGIONAL ANALYSIS, 2025–2034, (USD MILLION)
FIGURE 78 CHINA AQUACULTURE CURRENT AND FUTURE TYPE ANALYSIS, 2025–2034, (USD MILLION)
FIGURE 79 CHINA AQUACULTURE CURRENT AND FUTURE END USER ANALYSIS, 2025–2034, (USD MILLION)
FIGURE 80 JAPAN AQUACULTURE CURRENT AND FUTURE TYPE ANALYSIS, 2025–2034, (USD MILLION)
FIGURE 81 JAPAN AQUACULTURE CURRENT AND FUTURE END USER ANALYSIS, 2025–2034, (USD MILLION)
FIGURE 82 AUSTRALIA AQUACULTURE CURRENT AND FUTURE TYPE ANALYSIS, 2025–2034, (USD MILLION)
FIGURE 83 AUSTRALIA AQUACULTURE CURRENT AND FUTURE END USER ANALYSIS, 2025–2034, (USD MILLION)
FIGURE 84 CAMBODIA AQUACULTURE CURRENT AND FUTURE TYPE ANALYSIS, 2025–2034, (USD MILLION)
FIGURE 85 CAMBODIA AQUACULTURE CURRENT AND FUTURE END USER ANALYSIS, 2025–2034, (USD MILLION)
FIGURE 86 FIJI AQUACULTURE CURRENT AND FUTURE TYPE ANALYSIS, 2025–2034, (USD MILLION)
FIGURE 87 FIJI AQUACULTURE CURRENT AND FUTURE END USER ANALYSIS, 2025–2034, (USD MILLION)
FIGURE 88 INDONESIA AQUACULTURE CURRENT AND FUTURE TYPE ANALYSIS, 2025–2034, (USD MILLION)
FIGURE 89 INDONESIA AQUACULTURE CURRENT AND FUTURE END USER ANALYSIS, 2025–2034, (USD MILLION)
FIGURE 90 SOUTH KOREA AQUACULTURE CURRENT AND FUTURE TYPE ANALYSIS, 2025–2034, (USD MILLION)
FIGURE 91 SOUTH KOREA AQUACULTURE CURRENT AND FUTURE END USER ANALYSIS, 2025–2034, (USD MILLION)
FIGURE 92 REST OF EAST ASIA AND PACIFIC AQUACULTURE CURRENT AND FUTURE TYPE ANALYSIS, 2025–2034, (USD MILLION)
FIGURE 93 REST OF EAST ASIA AND PACIFIC AQUACULTURE CURRENT AND FUTURE END USER ANALYSIS, 2025–2034, (USD MILLION)
FIGURE 94 SEA AND SOUTH ASIA AQUACULTURE CURRENT AND FUTURE MARKET VOLUME SHARE REGIONAL ANALYSIS, 2025–2034, (USD MILLION)
FIGURE 95 BANGLADESH AQUACULTURE CURRENT AND FUTURE TYPE ANALYSIS, 2025–2034, (USD MILLION)
FIGURE 96 BANGLADESH AQUACULTURE CURRENT AND FUTURE END USER ANALYSIS, 2025–2034, (USD MILLION)
FIGURE 97 NEW ZEALAND AQUACULTURE CURRENT AND FUTURE TYPE ANALYSIS, 2025–2034, (USD MILLION)
FIGURE 98 NEW ZEALAND AQUACULTURE CURRENT AND FUTURE END USER ANALYSIS, 2025–2034, (USD MILLION)
FIGURE 99 INDIA AQUACULTURE CURRENT AND FUTURE TYPE ANALYSIS, 2025–2034, (USD MILLION)
FIGURE 100 INDIA AQUACULTURE CURRENT AND FUTURE END USER ANALYSIS, 2025–2034, (USD MILLION)
FIGURE 101 SINGAPORE AQUACULTURE CURRENT AND FUTURE TYPE ANALYSIS, 2025–2034, (USD MILLION)
FIGURE 102 SINGAPORE AQUACULTURE CURRENT AND FUTURE END USER ANALYSIS, 2025–2034, (USD MILLION)
FIGURE 103 THAILAND AQUACULTURE CURRENT AND FUTURE TYPE ANALYSIS, 2025–2034, (USD MILLION)
FIGURE 104 THAILAND AQUACULTURE CURRENT AND FUTURE END USER ANALYSIS, 2025–2034, (USD MILLION)
FIGURE 105 TAIWAN AQUACULTURE CURRENT AND FUTURE TYPE ANALYSIS, 2025–2034, (USD MILLION)
FIGURE 106 TAIWAN AQUACULTURE CURRENT AND FUTURE END USER ANALYSIS, 2025–2034, (USD MILLION)
FIGURE 107 MALAYSIA AQUACULTURE CURRENT AND FUTURE TYPE ANALYSIS, 2025–2034, (USD MILLION)
FIGURE 108 MALAYSIA AQUACULTURE CURRENT AND FUTURE END USER ANALYSIS, 2025–2034, (USD MILLION)
FIGURE 109 REST OF SEA AND SOUTH ASIA AQUACULTURE CURRENT AND FUTURE TYPE ANALYSIS, 2025–2034, (USD MILLION)
FIGURE 110 REST OF SEA AND SOUTH ASIA AQUACULTURE CURRENT AND FUTURE END USER ANALYSIS, 2025–2034, (USD MILLION)
FIGURE 111 MIDDLE EAST AND AFRICA AQUACULTURE CURRENT AND FUTURE MARKET VOLUME SHARE REGIONAL ANALYSIS, 2025–2034, (USD MILLION)
FIGURE 112 GCC COUNTRIES AQUACULTURE CURRENT AND FUTURE TYPE ANALYSIS, 2025–2034, (USD MILLION)
FIGURE 113 GCC COUNTRIES AQUACULTURE CURRENT AND FUTURE END USER ANALYSIS, 2025–2034, (USD MILLION)
FIGURE 114 SAUDI ARABIA AQUACULTURE CURRENT AND FUTURE TYPE ANALYSIS, 2025–2034, (USD MILLION)
FIGURE 115 SAUDI ARABIA AQUACULTURE CURRENT AND FUTURE END USER ANALYSIS, 2025–2034, (USD MILLION)
FIGURE 116 UAE AQUACULTURE CURRENT AND FUTURE TYPE ANALYSIS, 2025–2034, (USD MILLION)
FIGURE 117 UAE AQUACULTURE CURRENT AND FUTURE END USER ANALYSIS, 2025–2034, (USD MILLION)
FIGURE 118 BAHRAIN AQUACULTURE CURRENT AND FUTURE TYPE ANALYSIS, 2025–2034, (USD MILLION)
FIGURE 119 BAHRAIN AQUACULTURE CURRENT AND FUTURE END USER ANALYSIS, 2025–2034, (USD MILLION)
FIGURE 120 KUWAIT AQUACULTURE CURRENT AND FUTURE TYPE ANALYSIS, 2025–2034, (USD MILLION)
FIGURE 121 KUWAIT AQUACULTURE CURRENT AND FUTURE END USER ANALYSIS, 2025–2034, (USD MILLION)
FIGURE 122 OMAN AQUACULTURE CURRENT AND FUTURE TYPE ANALYSIS, 2025–2034, (USD MILLION)
FIGURE 123 OMAN AQUACULTURE CURRENT AND FUTURE END USER ANALYSIS, 2025–2034, (USD MILLION)
FIGURE 124 QATAR AQUACULTURE CURRENT AND FUTURE TYPE ANALYSIS, 2025–2034, (USD MILLION)
FIGURE 125 QATAR AQUACULTURE CURRENT AND FUTURE END USER ANALYSIS, 2025–2034, (USD MILLION)
FIGURE 126 EGYPT AQUACULTURE CURRENT AND FUTURE TYPE ANALYSIS, 2025–2034, (USD MILLION)
FIGURE 127 EGYPT AQUACULTURE CURRENT AND FUTURE END USER ANALYSIS, 2025–2034, (USD MILLION)
FIGURE 128 NIGERIA AQUACULTURE CURRENT AND FUTURE TYPE ANALYSIS, 2025–2034, (USD MILLION)
FIGURE 129 NIGERIA AQUACULTURE CURRENT AND FUTURE END USER ANALYSIS, 2025–2034, (USD MILLION)
FIGURE 130 SOUTH AFRICA AQUACULTURE CURRENT AND FUTURE TYPE ANALYSIS, 2025–2034, (USD MILLION)
FIGURE 131 SOUTH AFRICA AQUACULTURE CURRENT AND FUTURE END USER ANALYSIS, 2025–2034, (USD MILLION)
FIGURE 132 ISRAEL AQUACULTURE CURRENT AND FUTURE TYPE ANALYSIS, 2025–2034, (USD MILLION)
FIGURE 133 ISRAEL AQUACULTURE CURRENT AND FUTURE END USER ANALYSIS, 2025–2034, (USD MILLION)
FIGURE 134 REST OF MEA AQUACULTURE CURRENT AND FUTURE TYPE ANALYSIS, 2025–2034, (USD MILLION)
FIGURE 135 REST OF MEA AQUACULTURE CURRENT AND FUTURE END USER ANALYSIS, 2025–2034, (USD MILLION)
FIGURE 136 U. S. MARKET SHARE ANALYSIS BY TYPE (2024)
FIGURE 137 U. S. MARKET SHARE ANALYSIS BY END USER (2024)
FIGURE 138 CANADA MARKET SHARE ANALYSIS BY TYPE (2024)
FIGURE 139 CANADA MARKET SHARE ANALYSIS BY END USER (2024)
FIGURE 140 MEXICO MARKET SHARE ANALYSIS BY TYPE (2024)
FIGURE 141 MEXICO MARKET SHARE ANALYSIS BY END USER (2024)
FIGURE 142 CHINA MARKET SHARE ANALYSIS BY TYPE (2024)
FIGURE 143 CHINA MARKET SHARE ANALYSIS BY END USER (2024)
FIGURE 144 JAPAN MARKET SHARE ANALYSIS BY TYPE (2024)
FIGURE 145 JAPAN MARKET SHARE ANALYSIS BY END USER (2024)
FIGURE 146 INDIA MARKET SHARE ANALYSIS BY TYPE (2024)
FIGURE 147 INDIA MARKET SHARE ANALYSIS BY END USER (2024)
FIGURE 148 SOUTH KOREA MARKET SHARE ANALYSIS BY TYPE (2024)
FIGURE 149 SOUTH KOREA MARKET SHARE ANALYSIS BY END USER (2024)
FIGURE 150 SAUDI ARABIA MARKET SHARE ANALYSIS BY TYPE (2024)
FIGURE 151 SAUDI ARABIA MARKET SHARE ANALYSIS BY END USER (2024)
FIGURE 152 UAE MARKET SHARE ANALYSIS BY TYPE (2024)
FIGURE 153 UAE MARKET SHARE ANALYSIS BY END USER (2024)
FIGURE 154 EGYPT MARKET SHARE ANALYSIS BY TYPE (2024)
FIGURE 155 EGYPT MARKET SHARE ANALYSIS BY END USER (2024)
FIGURE 156 NIGERIA MARKET SHARE ANALYSIS BY TYPE (2024)
FIGURE 157 NIGERIA MARKET SHARE ANALYSIS BY END USER (2024)
FIGURE 158 SOUTH AFRICA MARKET SHARE ANALYSIS BY TYPE (2024)
FIGURE 159 SOUTH AFRICA MARKET SHARE ANALYSIS BY END USER (2024)
FIGURE 160 GERMANY MARKET SHARE ANALYSIS BY TYPE (2024)
FIGURE 161 GERMANY MARKET SHARE ANALYSIS BY END USER (2024)
FIGURE 162 FRANCE MARKET SHARE ANALYSIS BY TYPE (2024)
FIGURE 163 FRANCE MARKET SHARE ANALYSIS BY END USER (2024)
FIGURE 164 UK MARKET SHARE ANALYSIS BY TYPE (2024)
FIGURE 165 UK MARKET SHARE ANALYSIS BY END USER (2024)
FIGURE 166 SPAIN MARKET SHARE ANALYSIS BY TYPE (2024)
FIGURE 167 SPAIN MARKET SHARE ANALYSIS BY END USER (2024)
FIGURE 168 ITALY MARKET SHARE ANALYSIS BY TYPE (2024)
FIGURE 169 ITALY MARKET SHARE ANALYSIS BY END USER (2024)
FIGURE 170 BRAZIL MARKET SHARE ANALYSIS BY TYPE (2024)
FIGURE 171 BRAZIL MARKET SHARE ANALYSIS BY END USER (2024)
FIGURE 172 ARGENTINA MARKET SHARE ANALYSIS BY TYPE (2024)
FIGURE 173 ARGENTINA MARKET SHARE ANALYSIS BY END USER (2024)
FIGURE 174 COLUMBIA MARKET SHARE ANALYSIS BY TYPE (2024)
FIGURE 175 COLUMBIA MARKET SHARE ANALYSIS BY END USER (2024)
FIGURE 176 GLOBAL AQUACULTURE CURRENT AND FUTURE MARKET KEY COUNTRY LEVEL ANALYSIS, 2024–2034, (USD MILLION)
FIGURE 177 FINANCIAL OVERVIEW:
Key Player Analysis
Mowi ASA: Mowi ASA remains the world’s largest aquaculture company and a clear market leader in salmon farming. As of 2025, the company has solidified its dominance by leveraging advanced automation, AI-driven feeding systems, and real-time environmental monitoring to optimize production. Mowi’s strategic adoption of digital platforms and data analytics allows it to track fish growth, health, and environmental impact at scale, reinforcing its reputation for operational efficiency and sustainability. The company’s focus on vertically integrated operations—from feed production to processing and distribution—gives it a competitive edge in supply chain control, ensuring consistent quality and traceability for global consumers. Mowi’s continued investment in land-based and offshore farming systems highlights its role as both an industry stabilizer and an innovator.
SalMar: SalMar has positioned itself as one of the most forward-looking players in aquaculture, known for pioneering offshore farming concepts. The company’s Ocean Farm and Smart Fish Farm initiatives exemplify its commitment to scalability through technological disruption, integrating robotics, autonomous monitoring, and AI-enabled feeding systems to maximize efficiency in open-sea environments. By 2025, SalMar’s focus on sustainable, large-scale offshore salmon farming has not only expanded production capacity but also alleviated pressure on nearshore ecosystems. Its strong emphasis on R&D partnerships and digital innovation reinforces its status as a disruptor, reshaping the boundaries of aquaculture technology and serving as a model for other producers navigating sustainability challenges.
Lerøy Seafood Group: Lerøy Seafood Group has built its market position on diversification, integrating aquaculture with processing, distribution, and value-added seafood products. In 2025, the company continues to strengthen its role as an innovator in supply chain digitalization, using AI-powered logistics platforms and blockchain-enabled traceability systems to ensure transparency from farm to consumer. Lerøy’s strategy of combining traditional farming expertise with advanced digital twins and data-driven simulations allows it to optimize fish health, reduce mortality, and improve feed efficiency. Its commitment to circular economy principles—through initiatives like waste-to-energy systems and sustainable feed sourcing—further enhances its global positioning as both a responsible and technologically progressive player in aquaculture.
Bakkafrost Scotland: Bakkafrost Scotland, a subsidiary of Bakkafrost, has emerged as a critical player in the premium salmon segment, particularly within European markets. Known for its focus on quality and sustainability, the company has embraced digital farming platforms and AI-enabled monitoring systems to manage fish health and environmental parameters with precision. By 2025, Bakkafrost Scotland’s investments in closed-containment systems and advanced hatchery technologies demonstrate its emphasis on biosecurity and disease prevention, which remain key challenges in the sector. Its integration of renewable energy solutions into farming operations further positions the company as a sustainability-driven innovator, appealing to both regulators and environmentally conscious consumers.
Market Key Players
Thai Union Group Plc
Cooke Aquaculture Inc.
Grieg Seafood
Leroy Seafood Group
Promarisco
Mowi ASA
Huon Aquaculture Group Pty Ltd.
Cermaq Group AS
Eastern Fish Company
Asmak
Blue Ridge Aquaculture, Inc.
Nireus Aquaculture S.A.
Bakkafrost Scotland
SalMar
Other Key Players
Driver
Rising Demand for Sustainable Protein and Health-Focused Seafood Consumption
The aquaculture sector in 2025 is being propelled by the global push for sustainable protein sources and the accelerating demand for seafood as a healthier dietary option. As populations expand and disposable incomes rise, consumers are shifting away from resource-intensive proteins such as beef and pork toward fish and shellfish, which offer higher nutritional value and lower environmental footprints. Seafood’s richness in omega-3 fatty acids, vitamins, and minerals is strengthening its role in preventive health and wellness markets, particularly among urban and health-conscious populations.
Advanced Aquaculture Systems Enhancing Productivity and Food Security
Equally important, aquaculture’s efficiency in converting feed to protein positions it as a cost-effective solution to global food security challenges. Technologies such as recirculating aquaculture systems (RAS) and integrated multi-trophic aquaculture (IMTA) are enhancing productivity while reducing ecological impact. These advances, coupled with strong government support for sustainable practices, have established aquaculture as a critical driver of growth in the global protein economy.
Restraint
Biosecurity Risks and Environmental Challenges Limit Scalable Expansion
Despite its rapid expansion, the aquaculture industry faces significant sustainability and operational challenges in 2025. High stocking densities and limited genetic diversity in commercial farms increase the risk of disease outbreaks, which can lead to severe economic losses and environmental spillover. Incidents of viral and bacterial infections continue to highlight vulnerabilities in biosecurity and water management systems, especially in densely farmed regions.
Dependence on Fishmeal and Regulatory Barriers Restrict Sustainable Growth
Another major barrier is the industry’s reliance on fishmeal and fish oil derived from wild-caught species, which places pressure on already stressed marine ecosystems. Although progress is being made with algae- and insect-based feed alternatives, commercial-scale adoption remains uneven. Additionally, regulatory inconsistencies, weak enforcement in developing markets, and rising compliance costs in developed economies create operational hurdles, slowing large-scale adoption of sustainable aquaculture practices.
Opportunity
Growing Market for Premium, Certified, and Traceable Aquaculture Products
In 2025, one of the most promising opportunities lies in the rising demand for premium and value-added aquaculture products. Consumers are increasingly willing to pay for organic, sustainably certified, and traceable seafood, particularly in North America, Europe, and high-income Asian markets. Producers that can differentiate offerings—such as organic salmon, eco-certified shrimp, or nutritionally enriched mollusks—are well positioned to capture higher margins and brand loyalty.
AI, Automation, and Offshore Farming Unlock Efficiency and New Revenue Streams
In parallel, technological advancements are creating pathways for efficiency-driven growth. Automation, AI-based feeding systems, and remote water-quality monitoring are improving yields while lowering operational risks. Offshore aquaculture, supported by advanced engineering and digital monitoring tools, offers a scalable model for high-value species while reducing pressure on coastal zones. Collectively, these developments open substantial growth opportunities for investors, technology providers, and aquaculture operators seeking to align with sustainability-driven consumer trends.
Trend
Rapid Adoption of Land-Based RAS and Low-Impact Production Models
A defining trend in 2025 is the integration of aquaculture with advanced technologies and cross-sector sustainability models. Land-based recirculating aquaculture systems (RAS) are expanding rapidly, especially in Europe and North America, where environmental regulations and consumer preference for low-carbon seafood are strong. These closed-loop systems allow for higher biosecurity, reduced water use, and year-round production close to consumption hubs, reducing reliance on imports.
Integration of IMTA, Aquaponics, and Blockchain Traceability Reshapes Global Aquaculture
Simultaneously, integrated multi-trophic aquaculture (IMTA) and aquaponics are gaining traction as holistic food production models, combining fish, plants, and algae to optimize resource use and reduce waste. Blockchain-enabled traceability and eco-labeling are also reshaping consumer expectations, making transparency and sustainability non-negotiable in competitive markets. Together, these trends are not only redefining production efficiency but also positioning aquaculture as a cornerstone of the global transition toward resilient, low-impact food systems.
Recent Developments
December 2024 – SalMar ASA: SalMar announced a share-based incentive scheme for senior executives and key personnel to strengthen management continuity and align leadership incentives with long-term operational goals. This initiative supported stability during the company’s ongoing offshore expansion and financing transitions.
January 2025 – Mowi ASA: Mowi revealed its plan to increase ownership in Nova Sea from 49% to 95% through a NOK 7.4 billion transaction (cash and shares). This acquisition consolidates Mowi’s position in northern Norway, enhancing supply-chain integration and scaling its harvest capacity.
January 2025 – Cermaq Group AS: Cermaq secured Norwegian regulatory approval to convert development permits for its iFarm concept, which employs AI-driven monitoring to track individual fish health and automate interventions. The approval paves the way for broader commercialization of data-driven aquaculture practices.
March 2025 – Cooke Aquaculture Inc. (Kelly Cove Salmon): Cooke’s division acquired AquaBounty Canada’s R&D and hatchery facilities on Prince Edward Island, including recirculating aquaculture system (RAS) assets. This acquisition boosts Cooke’s land-based smolt capacity and strengthens its North American hybrid RAS-to-ocean strategy.
March 2025 – SalMar ASA: SalMar completed corporate restructuring that brought SalMar Aker Ocean fully under group ownership, consolidating offshore and semi-offshore projects. The move streamlines governance, supports green-bond financing initiatives, and positions SalMar for large-scale offshore production growth.