Global Asparaginase Market Size, Share & Oncology Drug Analysis By Type (Native, Pegylated, Recombinant), By Indication (Acute Lymphoblastic Leukemia, Rare Hematologic Disorders), By Distribution Channel, Orphan Drug Development, Biotech Innovation, Regional Healthcare Access, Key Manufacturers & Forecast 2025–2034
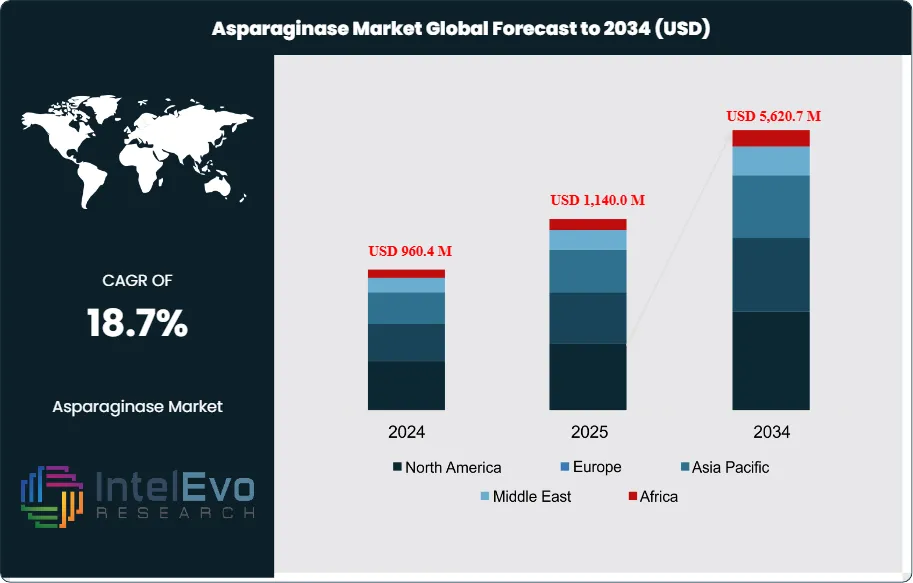
The Asparaginase Market is estimated at USD 960.4 million in 2024 and is projected to reach approximately USD 5,620.7 million by 2034, registering a robust compound annual growth rate (CAGR) of 18.7% during 2025–2034. This accelerated growth reflects the rising global incidence of acute lymphoblastic leukemia (ALL), particularly in pediatric populations, alongside expanding treatment access in emerging healthcare markets. Increasing adoption of pegylated and recombinant asparaginase formulations—driven by improved safety profiles and longer half-life—is further strengthening market momentum. In parallel, favorable regulatory approvals, expanding oncology drug pipelines, and growing investments in biologics manufacturing are positioning asparaginase as a critical component of modern leukemia treatment protocols worldwide.
This sharp expansion reflects both the widening use of asparaginase in oncology and its growing role in food safety applications. Historically, the market was concentrated in pharmaceutical oncology treatments, particularly for acute lymphoblastic leukemia (ALL), where asparaginase remains a frontline therapy. Over the past decade, demand has accelerated as clinical adoption expanded to other hematologic malignancies such as acute myeloid leukemia (AML) and non-Hodgkin’s lymphoma. At the same time, regulatory recognition of acrylamide as a carcinogenic risk in starchy foods has driven uptake of asparaginase in food processing, creating a dual demand base that strengthens long-term growth prospects.
On the demand side, rising global cancer incidence is a critical driver. The World Health Organization projects cancer cases to increase by more than 47% by 2040, intensifying the need for effective enzyme-based therapies. On the supply side, manufacturers face challenges in ensuring consistent production from bacterial strains such as Escherichia coli and Erwinia chrysanthemi, while also addressing adverse effects including hypersensitivity, pancreatitis, and neurological complications. These risks have prompted research into encapsulated formulations and recombinant variants that improve stability and reduce toxicity, signaling a shift toward more efficient delivery methods.
Technological advances are shaping adoption. Encapsulation techniques, recombinant DNA methods, and AI-driven drug development platforms are enabling more precise formulations and faster clinical trial designs. In the food industry, automated enzyme dosing systems are being deployed to reduce acrylamide levels in baked goods and snacks, aligning with stricter regulatory thresholds in Europe and North America.
Regionally, North America accounts for the largest revenue share, supported by strong oncology drug pipelines, favorable reimbursement frameworks, and high healthcare spending. Western Europe follows closely, driven by stringent food safety regulations and established cancer treatment protocols. The Asia-Pacific excluding Japan (APEJ) region is emerging as a high-growth market, with rising cancer prevalence, expanding pharmaceutical manufacturing capacity, and increasing regulatory alignment with international food safety standards. For investors, APEJ represents a key growth frontier, while established markets in North America and Europe continue to provide stable returns.
Overall, the asparaginase market is positioned for sustained expansion, underpinned by dual-use applications, advancing biotechnologies, and widening regional adoption. The combination of rising oncology demand and regulatory-driven food safety measures ensures a robust trajectory through 2034.
Key Takeaways
Market Growth: The global asparaginase market is valued at USD 960.4 million in 2024 and is projected to reach USD 5,620.7 million by 2034, expanding at a CAGR of 18.7%. Growth is driven by rising cancer incidence and regulatory pressure to reduce acrylamide levels in food products.
Source:Escherichia coli-derived asparaginase accounted for 67.1% of global revenue in 2023. Its dominance reflects established clinical use, broad availability, and lower production costs compared with Erwinia-based alternatives.
Route of Administration: Intravenous administration represented 61.2% of sales in 2023 and is expected to grow steadily through 2033. The segment benefits from higher efficacy in oncology treatment protocols and widespread hospital adoption.
Application: Acute lymphoblastic leukemia (ALL) treatments generated 42.1% of market revenue in 2023. The segment remains the largest due to asparaginase’s role as a standard therapy in pediatric and adult ALL protocols.
Distribution Channel: Hospital pharmacies captured 52.5% of revenue in 2023. This reflects the concentration of oncology treatments in hospital settings and the need for controlled administration of enzyme-based therapies.
Driver: Rising global cancer prevalence, with WHO projecting a 47% increase in new cases by 2040, is a key demand driver. Expanding oncology pipelines and inclusion of asparaginase in essential medicine lists further support adoption.
Restraint: Adverse effects such as hypersensitivity, pancreatitis, and neurological complications limit broader use. Clinical data indicates that up to 30% of patients may develop allergic reactions, creating demand for safer formulations.
Opportunity: Asia-Pacific markets, particularly India and China, are expected to post double-digit growth rates through 2033. Expanding healthcare infrastructure and increasing affordability of biologics position these countries as high-potential investment destinations.
Trend: Encapsulation technologies and recombinant DNA methods are improving enzyme stability and reducing toxicity. Companies are investing in long-acting formulations to enhance patient compliance and treatment outcomes.
Regional Analysis: North America led with 45.1% share and USD 350.7 million revenue in 2023, supported by strong oncology pipelines and reimbursement frameworks. Asia-Pacific excluding Japan is the fastest-growing region, with rising cancer incidence and expanding pharmaceutical manufacturing capacity.
Type Analysis
The asparaginase market continues to be dominated by Escherichia coli-derived formulations, which accounted for nearly 67% of global revenue in 2024 and are projected to maintain a leading position through 2030. These products remain the standard of care in multi-agent chemotherapy regimens for acute lymphoblastic leukemia (ALL), particularly in pediatric cases. Commercial brands such as Elspar have established strong clinical adoption due to proven efficacy in tumor suppression.
However, the reliance on E. coli strains presents challenges. A significant proportion of patients develop hypersensitivity or allergic reactions, prompting the need for alternative sources. Erwinia chrysanthemi-based asparaginase, while representing a smaller share of the market, is gaining traction as a substitute for patients intolerant to E. coli products. The introduction of pegylated and recombinant variants is expected to further diversify the product mix, reduce immunogenicity, and extend dosing intervals, creating new growth opportunities for manufacturers.
Looking ahead, the competitive landscape will likely shift toward advanced formulations that balance efficacy with improved safety profiles. Companies investing in recombinant DNA technology and encapsulation methods are positioned to capture market share as demand for safer, longer-acting therapies accelerates.
Application Analysis
Acute lymphoblastic leukemia (ALL) remains the single largest application segment, accounting for over 42% of global revenue in 2024. The high prevalence of ALL, particularly among children, continues to drive demand. According to the American Cancer Society, leukemia represented nearly 25% of all childhood cancers in the United States in 2024, underscoring the critical role of asparaginase in frontline treatment protocols.
Lymphoblastic lymphoma (LBL) represents a smaller but steadily expanding segment. Clinical guidelines increasingly recommend asparaginase-based regimens for LBL, particularly in younger patients, which is expected to support double-digit growth rates through 2030. Other applications, including acute myeloid leukemia (AML) and off-label uses in food processing to reduce acrylamide formation, are gradually contributing to market expansion.
The outlook for applications is shaped by ongoing clinical trials exploring broader oncology indications. If successful, these studies could expand the therapeutic footprint of asparaginase beyond hematologic malignancies, further strengthening its role in oncology pipelines.
End-Use Analysis
Hospital pharmacies remain the dominant distribution channel, accounting for more than 52% of global revenue in 2024. The concentration of oncology treatments in hospital settings, combined with the need for controlled administration of enzyme-based therapies, ensures continued reliance on this channel.
Online pharmacies are emerging as the fastest-growing segment, supported by rising digital adoption and patient preference for home delivery of specialty drugs. This trend is particularly evident in Asia Pacific, where e-pharmacy penetration is accelerating. Retail pharmacies, while holding a smaller share, continue to play a role in developing economies where hospital infrastructure is less accessible.
For end-use industries, healthcare remains the primary driver, but food manufacturing is an emerging contributor. Regulatory pressure to reduce acrylamide levels in baked and fried products is prompting food processors to adopt asparaginase, creating a secondary demand stream outside oncology.
Regional Analysis
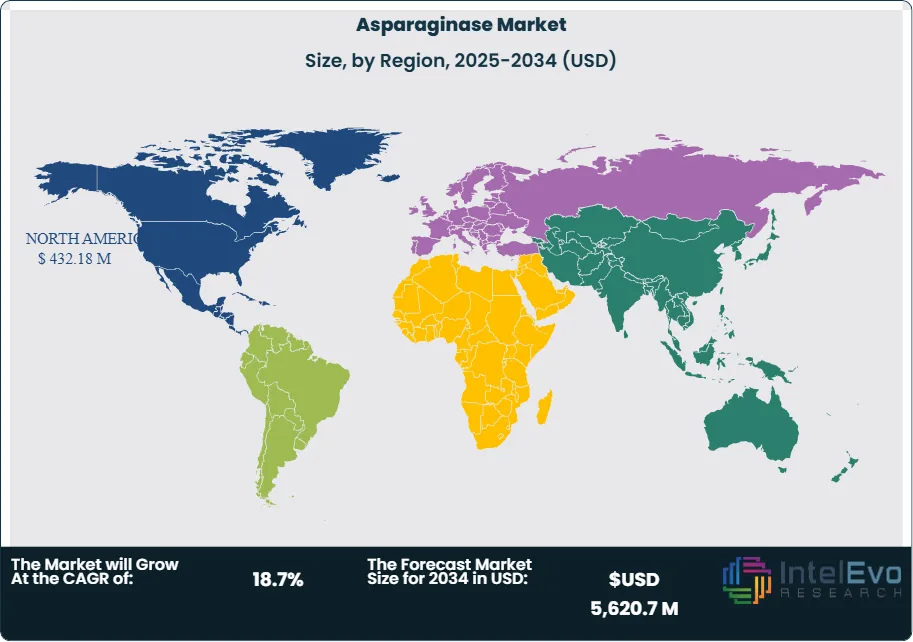
North America led the global market with a 45% revenue share in 2024, valued at approximately USD 432 million. The region benefits from advanced healthcare infrastructure, high cancer incidence rates, and favorable reimbursement policies. The United States remains the largest single-country market, supported by strong oncology pipelines and FDA approvals of new asparaginase formulations.
Europe follows closely, with demand driven by stringent food safety regulations and established cancer treatment protocols. Germany, France, and the United Kingdom represent key markets, with ongoing clinical research further supporting adoption.
Asia Pacific is the fastest-growing region, projected to record a CAGR above 18% through 2030. Rising cancer prevalence, expanding pharmaceutical manufacturing capacity, and increasing healthcare spending in China and India are driving growth. Latin America and the Middle East & Africa remain smaller markets but present long-term opportunities as healthcare access improves and regulatory frameworks align with global standards.
East Asia And Pacific (China, Japan, South Korea, Australia, Cambodia, Fiji, Indonesia)
Sea And South Asia (India, Singapore, Thailand, Taiwan, Malaysia)
Eastern Europe (Poland, Russia, Czech Republic, Romania)
Western Europe (Germany, U.K., France, Spain, Itlay)
Middle East & Africa (GCC Countries, Egypt, Nigeria, South Africa, Israel)
Competitive Landscape
Servier Pharmaceuticals LLC, Taj Pharmaceuticals Ltd., Novus Biologicals LLC, Jazz Pharmaceuticals, Kyowa Hakko Kirin Co., Ltd., Medac GmbH, Actiza Pharmaceutical Pvt. Ltd., Merck (Germany), LGM Pharma, Gennova Biopharmaceuticals
Customization Scope
Customization for segments, region/country-level will be provided. Moreover, additional customization can be done based on the requirements.
Pricing and Purchase Options
Avail customized purchase options to meet your exact research needs. We have three licenses to opt for: Single User License, Multi-User License (Up to 5 Users), Corporate Use License (Unlimited User and Printable PDF).
TABLE OF CONTENTS
1. EXECUTIVE SUMMARY
1.1. MARKET SNAPSHOT
1.2. KEY FINDINGS & INSIGHTS
1.3. ANALYST RECOMMENDATIONS
1.4. FUTURE OUTLOOK
2. RESEARCH METHODOLOGY
2.1. MARKET DEFINITION & SCOPE
2.2. RESEARCH OBJECTIVES: PRIMARY & SECONDARY DATA SOURCES
2.3. DATA COLLECTION SOURCES
2.3.1. COVERAGE OF 100+ PRIMARY RESEARCH/CONSULTATION CALLS WITH INDUSTRY STAKEHOLDERS
FIGURE 17 NORTH AMERICA ASPARAGINASE CURRENT AND FUTURE TYPE ANALYSIS, 2025–2034, (USD MILLION)
FIGURE 18 NORTH AMERICA ASPARAGINASE CURRENT AND FUTURE END USER ANALYSIS, 2025–2034, (USD MILLION)
FIGURE 19 MARKET SHARE BY COUNTRY
FIGURE 20 LATIN AMERICA ASPARAGINASE CURRENT AND FUTURE TYPE ANALYSIS, 2025–2034, (USD MILLION)
FIGURE 21 LATIN AMERICA ASPARAGINASE CURRENT AND FUTURE END USER ANALYSIS, 2025–2034, (USD MILLION)
FIGURE 22 MARKET SHARE BY COUNTRY
FIGURE 23 EASTERN EUROPE ASPARAGINASE CURRENT AND FUTURE TYPE ANALYSIS, 2025–2034, (USD MILLION)
FIGURE 24 EASTERN EUROPE ASPARAGINASE CURRENT AND FUTURE END USER ANALYSIS, 2025–2034, (USD MILLION)
FIGURE 25 MARKET SHARE BY COUNTRY
FIGURE 26 WESTERN EUROPE ASPARAGINASE CURRENT AND FUTURE TYPE ANALYSIS, 2025–2034, (USD MILLION)
FIGURE 27 WESTERN EUROPE ASPARAGINASE CURRENT AND FUTURE END USER ANALYSIS, 2025–2034, (USD MILLION)
FIGURE 28 MARKET SHARE BY COUNTRY
FIGURE 29 EAST ASIA AND PACIFIC ASPARAGINASE CURRENT AND FUTURE TYPE ANALYSIS, 2025–2034, (USD MILLION)
FIGURE 30 EAST ASIA AND PACIFIC ASPARAGINASE CURRENT AND FUTURE END USER ANALYSIS, 2025–2034, (USD MILLION)
FIGURE 31 MARKET SHARE BY COUNTRY
FIGURE 32 SEA AND SOUTH ASIA ASPARAGINASE CURRENT AND FUTURE TYPE ANALYSIS, 2025–2034, (USD MILLION)
FIGURE 33 SEA AND SOUTH ASIA ASPARAGINASE CURRENT AND FUTURE END USER ANALYSIS, 2025–2034, (USD MILLION)
FIGURE 34 MARKET SHARE BY COUNTRY
FIGURE 35 MIDDLE EAST AND AFRICA ASPARAGINASE CURRENT AND FUTURE TYPE ANALYSIS, 2025–2034, (USD MILLION)
FIGURE 36 MIDDLE EAST AND AFRICA ASPARAGINASE CURRENT AND FUTURE END USER ANALYSIS, 2025–2034, (USD MILLION)
FIGURE 37 NORTH AMERICA ASPARAGINASE CURRENT AND FUTURE MARKET VOLUME SHARE REGIONAL ANALYSIS, 2025–2034, (USD MILLION)
FIGURE 38 U.S. ASPARAGINASE CURRENT AND FUTURE TYPE ANALYSIS, 2025–2034, (USD MILLION)
FIGURE 39 U.S. ASPARAGINASE CURRENT AND FUTURE END USER ANALYSIS, 2025–2034, (USD MILLION)
FIGURE 40 CANADA ASPARAGINASE CURRENT AND FUTURE TYPE ANALYSIS, 2025–2034, (USD MILLION)
FIGURE 41 CANADA ASPARAGINASE CURRENT AND FUTURE END USER ANALYSIS, 2025–2034, (USD MILLION)
FIGURE 42 LATIN AMERICA ASPARAGINASE CURRENT AND FUTURE MARKET VOLUME SHARE REGIONAL ANALYSIS, 2025–2034, (USD MILLION)
FIGURE 43 MEXICO ASPARAGINASE CURRENT AND FUTURE TYPE ANALYSIS, 2025–2034, (USD MILLION)
FIGURE 44 MEXICO ASPARAGINASE CURRENT AND FUTURE END USER ANALYSIS, 2025–2034, (USD MILLION)
FIGURE 45 BRAZIL ASPARAGINASE CURRENT AND FUTURE TYPE ANALYSIS, 2025–2034, (USD MILLION)
FIGURE 46 BRAZIL ASPARAGINASE CURRENT AND FUTURE END USER ANALYSIS, 2025–2034, (USD MILLION)
FIGURE 47 ARGENTINA ASPARAGINASE CURRENT AND FUTURE TYPE ANALYSIS, 2025–2034, (USD MILLION)
FIGURE 48 ARGENTINA ASPARAGINASE CURRENT AND FUTURE END USER ANALYSIS, 2025–2034, (USD MILLION)
FIGURE 49 COLUMBIA ASPARAGINASE CURRENT AND FUTURE TYPE ANALYSIS, 2025–2034, (USD MILLION)
FIGURE 50 COLUMBIA ASPARAGINASE CURRENT AND FUTURE END USER ANALYSIS, 2025–2034, (USD MILLION)
FIGURE 51 REST OF LATIN AMERICA ASPARAGINASE CURRENT AND FUTURE TYPE ANALYSIS, 2025–2034, (USD MILLION)
FIGURE 52 REST OF LATIN AMERICA ASPARAGINASE CURRENT AND FUTURE END USER ANALYSIS, 2025–2034, (USD MILLION)
FIGURE 53 EASTERN EUROPE ASPARAGINASE CURRENT AND FUTURE MARKET VOLUME SHARE REGIONAL ANALYSIS, 2025–2034, (USD MILLION)
FIGURE 54 POLAND ASPARAGINASE CURRENT AND FUTURE TYPE ANALYSIS, 2025–2034, (USD MILLION)
FIGURE 55 POLAND ASPARAGINASE CURRENT AND FUTURE END USER ANALYSIS, 2025–2034, (USD MILLION)
FIGURE 56 RUSSIA ASPARAGINASE CURRENT AND FUTURE TYPE ANALYSIS, 2025–2034, (USD MILLION)
FIGURE 57 RUSSIA ASPARAGINASE CURRENT AND FUTURE END USER ANALYSIS, 2025–2034, (USD MILLION)
FIGURE 58 CZECH REPUBLIC ASPARAGINASE CURRENT AND FUTURE TYPE ANALYSIS, 2025–2034, (USD MILLION)
FIGURE 59 CZECH REPUBLIC ASPARAGINASE CURRENT AND FUTURE END USER ANALYSIS, 2025–2034, (USD MILLION)
FIGURE 60 ROMANIA ASPARAGINASE CURRENT AND FUTURE TYPE ANALYSIS, 2025–2034, (USD MILLION)
FIGURE 61 ROMANIA ASPARAGINASE CURRENT AND FUTURE END USER ANALYSIS, 2025–2034, (USD MILLION)
FIGURE 62 REST OF EASTERN EUROPE ASPARAGINASE CURRENT AND FUTURE TYPE ANALYSIS, 2025–2034, (USD MILLION)
FIGURE 63 REST OF EASTERN EUROPE ASPARAGINASE CURRENT AND FUTURE END USER ANALYSIS, 2025–2034, (USD MILLION)
FIGURE 64 WESTERN EUROPE ASPARAGINASE CURRENT AND FUTURE MARKET VOLUME SHARE REGIONAL ANALYSIS, 2025–2034, (USD MILLION)
FIGURE 65 GERMANY ASPARAGINASE CURRENT AND FUTURE TYPE ANALYSIS, 2025–2034, (USD MILLION)
FIGURE 66 GERMANY ASPARAGINASE CURRENT AND FUTURE END USER ANALYSIS, 2025–2034, (USD MILLION)
FIGURE 67 FRANCE ASPARAGINASE CURRENT AND FUTURE TYPE ANALYSIS, 2025–2034, (USD MILLION)
FIGURE 68 FRANCE ASPARAGINASE CURRENT AND FUTURE END USER ANALYSIS, 2025–2034, (USD MILLION)
FIGURE 69 UK ASPARAGINASE CURRENT AND FUTURE TYPE ANALYSIS, 2025–2034, (USD MILLION)
FIGURE 70 UK ASPARAGINASE CURRENT AND FUTURE END USER ANALYSIS, 2025–2034, (USD MILLION)
FIGURE 71 SPAIN ASPARAGINASE CURRENT AND FUTURE TYPE ANALYSIS, 2025–2034, (USD MILLION)
FIGURE 72 SPAIN ASPARAGINASE CURRENT AND FUTURE END USER ANALYSIS, 2025–2034, (USD MILLION)
FIGURE 73 ITALY ASPARAGINASE CURRENT AND FUTURE TYPE ANALYSIS, 2025–2034, (USD MILLION)
FIGURE 74 ITALY ASPARAGINASE CURRENT AND FUTURE END USER ANALYSIS, 2025–2034, (USD MILLION)
FIGURE 75 REST OF WESTERN EUROPE ASPARAGINASE CURRENT AND FUTURE TYPE ANALYSIS, 2025–2034, (USD MILLION)
FIGURE 76 REST OF WESTERN EUROPE ASPARAGINASE CURRENT AND FUTURE END USER ANALYSIS, 2025–2034, (USD MILLION)
FIGURE 77 EAST ASIA AND PACIFIC ASPARAGINASE CURRENT AND FUTURE MARKET VOLUME SHARE REGIONAL ANALYSIS, 2025–2034, (USD MILLION)
FIGURE 78 CHINA ASPARAGINASE CURRENT AND FUTURE TYPE ANALYSIS, 2025–2034, (USD MILLION)
FIGURE 79 CHINA ASPARAGINASE CURRENT AND FUTURE END USER ANALYSIS, 2025–2034, (USD MILLION)
FIGURE 80 JAPAN ASPARAGINASE CURRENT AND FUTURE TYPE ANALYSIS, 2025–2034, (USD MILLION)
FIGURE 81 JAPAN ASPARAGINASE CURRENT AND FUTURE END USER ANALYSIS, 2025–2034, (USD MILLION)
FIGURE 82 AUSTRALIA ASPARAGINASE CURRENT AND FUTURE TYPE ANALYSIS, 2025–2034, (USD MILLION)
FIGURE 83 AUSTRALIA ASPARAGINASE CURRENT AND FUTURE END USER ANALYSIS, 2025–2034, (USD MILLION)
FIGURE 84 CAMBODIA ASPARAGINASE CURRENT AND FUTURE TYPE ANALYSIS, 2025–2034, (USD MILLION)
FIGURE 85 CAMBODIA ASPARAGINASE CURRENT AND FUTURE END USER ANALYSIS, 2025–2034, (USD MILLION)
FIGURE 86 FIJI ASPARAGINASE CURRENT AND FUTURE TYPE ANALYSIS, 2025–2034, (USD MILLION)
FIGURE 87 FIJI ASPARAGINASE CURRENT AND FUTURE END USER ANALYSIS, 2025–2034, (USD MILLION)
FIGURE 88 INDONESIA ASPARAGINASE CURRENT AND FUTURE TYPE ANALYSIS, 2025–2034, (USD MILLION)
FIGURE 89 INDONESIA ASPARAGINASE CURRENT AND FUTURE END USER ANALYSIS, 2025–2034, (USD MILLION)
FIGURE 90 SOUTH KOREA ASPARAGINASE CURRENT AND FUTURE TYPE ANALYSIS, 2025–2034, (USD MILLION)
FIGURE 91 SOUTH KOREA ASPARAGINASE CURRENT AND FUTURE END USER ANALYSIS, 2025–2034, (USD MILLION)
FIGURE 92 REST OF EAST ASIA AND PACIFIC ASPARAGINASE CURRENT AND FUTURE TYPE ANALYSIS, 2025–2034, (USD MILLION)
FIGURE 93 REST OF EAST ASIA AND PACIFIC ASPARAGINASE CURRENT AND FUTURE END USER ANALYSIS, 2025–2034, (USD MILLION)
FIGURE 94 SEA AND SOUTH ASIA ASPARAGINASE CURRENT AND FUTURE MARKET VOLUME SHARE REGIONAL ANALYSIS, 2025–2034, (USD MILLION)
FIGURE 95 BANGLADESH ASPARAGINASE CURRENT AND FUTURE TYPE ANALYSIS, 2025–2034, (USD MILLION)
FIGURE 96 BANGLADESH ASPARAGINASE CURRENT AND FUTURE END USER ANALYSIS, 2025–2034, (USD MILLION)
FIGURE 97 NEW ZEALAND ASPARAGINASE CURRENT AND FUTURE TYPE ANALYSIS, 2025–2034, (USD MILLION)
FIGURE 98 NEW ZEALAND ASPARAGINASE CURRENT AND FUTURE END USER ANALYSIS, 2025–2034, (USD MILLION)
FIGURE 99 INDIA ASPARAGINASE CURRENT AND FUTURE TYPE ANALYSIS, 2025–2034, (USD MILLION)
FIGURE 100 INDIA ASPARAGINASE CURRENT AND FUTURE END USER ANALYSIS, 2025–2034, (USD MILLION)
FIGURE 101 SINGAPORE ASPARAGINASE CURRENT AND FUTURE TYPE ANALYSIS, 2025–2034, (USD MILLION)
FIGURE 102 SINGAPORE ASPARAGINASE CURRENT AND FUTURE END USER ANALYSIS, 2025–2034, (USD MILLION)
FIGURE 103 THAILAND ASPARAGINASE CURRENT AND FUTURE TYPE ANALYSIS, 2025–2034, (USD MILLION)
FIGURE 104 THAILAND ASPARAGINASE CURRENT AND FUTURE END USER ANALYSIS, 2025–2034, (USD MILLION)
FIGURE 105 TAIWAN ASPARAGINASE CURRENT AND FUTURE TYPE ANALYSIS, 2025–2034, (USD MILLION)
FIGURE 106 TAIWAN ASPARAGINASE CURRENT AND FUTURE END USER ANALYSIS, 2025–2034, (USD MILLION)
FIGURE 107 MALAYSIA ASPARAGINASE CURRENT AND FUTURE TYPE ANALYSIS, 2025–2034, (USD MILLION)
FIGURE 108 MALAYSIA ASPARAGINASE CURRENT AND FUTURE END USER ANALYSIS, 2025–2034, (USD MILLION)
FIGURE 109 REST OF SEA AND SOUTH ASIA ASPARAGINASE CURRENT AND FUTURE TYPE ANALYSIS, 2025–2034, (USD MILLION)
FIGURE 110 REST OF SEA AND SOUTH ASIA ASPARAGINASE CURRENT AND FUTURE END USER ANALYSIS, 2025–2034, (USD MILLION)
FIGURE 111 MIDDLE EAST AND AFRICA ASPARAGINASE CURRENT AND FUTURE MARKET VOLUME SHARE REGIONAL ANALYSIS, 2025–2034, (USD MILLION)
FIGURE 112 GCC COUNTRIES ASPARAGINASE CURRENT AND FUTURE TYPE ANALYSIS, 2025–2034, (USD MILLION)
FIGURE 113 GCC COUNTRIES ASPARAGINASE CURRENT AND FUTURE END USER ANALYSIS, 2025–2034, (USD MILLION)
FIGURE 114 SAUDI ARABIA ASPARAGINASE CURRENT AND FUTURE TYPE ANALYSIS, 2025–2034, (USD MILLION)
FIGURE 115 SAUDI ARABIA ASPARAGINASE CURRENT AND FUTURE END USER ANALYSIS, 2025–2034, (USD MILLION)
FIGURE 116 UAE ASPARAGINASE CURRENT AND FUTURE TYPE ANALYSIS, 2025–2034, (USD MILLION)
FIGURE 117 UAE ASPARAGINASE CURRENT AND FUTURE END USER ANALYSIS, 2025–2034, (USD MILLION)
FIGURE 118 BAHRAIN ASPARAGINASE CURRENT AND FUTURE TYPE ANALYSIS, 2025–2034, (USD MILLION)
FIGURE 119 BAHRAIN ASPARAGINASE CURRENT AND FUTURE END USER ANALYSIS, 2025–2034, (USD MILLION)
FIGURE 120 KUWAIT ASPARAGINASE CURRENT AND FUTURE TYPE ANALYSIS, 2025–2034, (USD MILLION)
FIGURE 121 KUWAIT ASPARAGINASE CURRENT AND FUTURE END USER ANALYSIS, 2025–2034, (USD MILLION)
FIGURE 122 OMAN ASPARAGINASE CURRENT AND FUTURE TYPE ANALYSIS, 2025–2034, (USD MILLION)
FIGURE 123 OMAN ASPARAGINASE CURRENT AND FUTURE END USER ANALYSIS, 2025–2034, (USD MILLION)
FIGURE 124 QATAR ASPARAGINASE CURRENT AND FUTURE TYPE ANALYSIS, 2025–2034, (USD MILLION)
FIGURE 125 QATAR ASPARAGINASE CURRENT AND FUTURE END USER ANALYSIS, 2025–2034, (USD MILLION)
FIGURE 126 EGYPT ASPARAGINASE CURRENT AND FUTURE TYPE ANALYSIS, 2025–2034, (USD MILLION)
FIGURE 127 EGYPT ASPARAGINASE CURRENT AND FUTURE END USER ANALYSIS, 2025–2034, (USD MILLION)
FIGURE 128 NIGERIA ASPARAGINASE CURRENT AND FUTURE TYPE ANALYSIS, 2025–2034, (USD MILLION)
FIGURE 129 NIGERIA ASPARAGINASE CURRENT AND FUTURE END USER ANALYSIS, 2025–2034, (USD MILLION)
FIGURE 130 SOUTH AFRICA ASPARAGINASE CURRENT AND FUTURE TYPE ANALYSIS, 2025–2034, (USD MILLION)
FIGURE 131 SOUTH AFRICA ASPARAGINASE CURRENT AND FUTURE END USER ANALYSIS, 2025–2034, (USD MILLION)
FIGURE 132 ISRAEL ASPARAGINASE CURRENT AND FUTURE TYPE ANALYSIS, 2025–2034, (USD MILLION)
FIGURE 133 ISRAEL ASPARAGINASE CURRENT AND FUTURE END USER ANALYSIS, 2025–2034, (USD MILLION)
FIGURE 134 REST OF MEA ASPARAGINASE CURRENT AND FUTURE TYPE ANALYSIS, 2025–2034, (USD MILLION)
FIGURE 135 REST OF MEA ASPARAGINASE CURRENT AND FUTURE END USER ANALYSIS, 2025–2034, (USD MILLION)
FIGURE 136 U. S. MARKET SHARE ANALYSIS BY TYPE (2024)
FIGURE 137 U. S. MARKET SHARE ANALYSIS BY END USER (2024)
FIGURE 138 CANADA MARKET SHARE ANALYSIS BY TYPE (2024)
FIGURE 139 CANADA MARKET SHARE ANALYSIS BY END USER (2024)
FIGURE 140 MEXICO MARKET SHARE ANALYSIS BY TYPE (2024)
FIGURE 141 MEXICO MARKET SHARE ANALYSIS BY END USER (2024)
FIGURE 142 CHINA MARKET SHARE ANALYSIS BY TYPE (2024)
FIGURE 143 CHINA MARKET SHARE ANALYSIS BY END USER (2024)
FIGURE 144 JAPAN MARKET SHARE ANALYSIS BY TYPE (2024)
FIGURE 145 JAPAN MARKET SHARE ANALYSIS BY END USER (2024)
FIGURE 146 INDIA MARKET SHARE ANALYSIS BY TYPE (2024)
FIGURE 147 INDIA MARKET SHARE ANALYSIS BY END USER (2024)
FIGURE 148 SOUTH KOREA MARKET SHARE ANALYSIS BY TYPE (2024)
FIGURE 149 SOUTH KOREA MARKET SHARE ANALYSIS BY END USER (2024)
FIGURE 150 SAUDI ARABIA MARKET SHARE ANALYSIS BY TYPE (2024)
FIGURE 151 SAUDI ARABIA MARKET SHARE ANALYSIS BY END USER (2024)
FIGURE 152 UAE MARKET SHARE ANALYSIS BY TYPE (2024)
FIGURE 153 UAE MARKET SHARE ANALYSIS BY END USER (2024)
FIGURE 154 EGYPT MARKET SHARE ANALYSIS BY TYPE (2024)
FIGURE 155 EGYPT MARKET SHARE ANALYSIS BY END USER (2024)
FIGURE 156 NIGERIA MARKET SHARE ANALYSIS BY TYPE (2024)
FIGURE 157 NIGERIA MARKET SHARE ANALYSIS BY END USER (2024)
FIGURE 158 SOUTH AFRICA MARKET SHARE ANALYSIS BY TYPE (2024)
FIGURE 159 SOUTH AFRICA MARKET SHARE ANALYSIS BY END USER (2024)
FIGURE 160 GERMANY MARKET SHARE ANALYSIS BY TYPE (2024)
FIGURE 161 GERMANY MARKET SHARE ANALYSIS BY END USER (2024)
FIGURE 162 FRANCE MARKET SHARE ANALYSIS BY TYPE (2024)
FIGURE 163 FRANCE MARKET SHARE ANALYSIS BY END USER (2024)
FIGURE 164 UK MARKET SHARE ANALYSIS BY TYPE (2024)
FIGURE 165 UK MARKET SHARE ANALYSIS BY END USER (2024)
FIGURE 166 SPAIN MARKET SHARE ANALYSIS BY TYPE (2024)
FIGURE 167 SPAIN MARKET SHARE ANALYSIS BY END USER (2024)
FIGURE 168 ITALY MARKET SHARE ANALYSIS BY TYPE (2024)
FIGURE 169 ITALY MARKET SHARE ANALYSIS BY END USER (2024)
FIGURE 170 BRAZIL MARKET SHARE ANALYSIS BY TYPE (2024)
FIGURE 171 BRAZIL MARKET SHARE ANALYSIS BY END USER (2024)
FIGURE 172 ARGENTINA MARKET SHARE ANALYSIS BY TYPE (2024)
FIGURE 173 ARGENTINA MARKET SHARE ANALYSIS BY END USER (2024)
FIGURE 174 COLUMBIA MARKET SHARE ANALYSIS BY TYPE (2024)
FIGURE 175 COLUMBIA MARKET SHARE ANALYSIS BY END USER (2024)
FIGURE 176 GLOBAL ASPARAGINASE CURRENT AND FUTURE MARKET KEY COUNTRY LEVEL ANALYSIS, 2024–2034, (USD MILLION)
FIGURE 177 FINANCIAL OVERVIEW:
Key Player Analysis
Jazz Pharmaceuticals: Leader. Jazz anchors the market with pegaspargase-based therapies used in frontline ALL regimens. The company’s portfolio centers on long-acting formulations that reduce dosing frequency and improve adherence in pediatric and adult protocols. In 2025, Jazz is focusing on lifecycle management, including label expansions and post-marketing studies that track safety and real-world outcomes. Strategic moves include targeted partnerships with academic centers for biomarker-driven trials and investments in manufacturing reliability to mitigate supply risk. The differentiator is scale and clinician trust. Jazz maintains strong penetration in North America and Europe, with double-digit revenue growth from oncology assets and high formulary inclusion across leading hospital systems.
Medac GmbH: Challenger. Medac offers E. coli–derived asparaginase and supportive oncology products, supplying hospitals through established tender frameworks in Europe. The company is expanding its footprint via incremental process upgrades that improve purity and reduce immunogenicity, supported by quality certifications and consistent batch performance. In 2025, Medac’s strategy emphasizes supply continuity, pharmacovigilance, and pragmatic pricing for payers under fixed-budget schemes. Differentiation comes from dependable delivery, regulatory alignment across EU markets, and a focus on clinician education. The company is well positioned in Germany, France, and the Nordics, with steady mid-single-digit growth from oncology injectables and hospital contracts.
Taj Pharmaceuticals Ltd.: Niche player. Taj supplies asparaginase across India and select export markets, addressing price-sensitive segments with competitive formulations. The 2025 strategy centers on WHO-prequalified manufacturing standards, expansion into government procurement channels, and localized distribution to secondary and tertiary care centers. Taj is pursuing regional partnerships for pharmacovigilance data and batch tracking to strengthen clinician confidence. The differentiators are affordability, wide reach across Tier 2 and Tier 3 cities, and responsiveness to tender-based demand. Growth is driven by rising ALL diagnoses and broader access to enzyme therapies, with high-single-digit sales increases expected in South Asia.
LGM Pharma: Innovator. LGM operates as an API and CDMO partner supporting asparaginase and adjacent oncology supply chains. The firm’s core offering is end-to-end sourcing, quality assurance, and formulation support for clients seeking to introduce or scale enzyme-based therapies. In 2025, LGM is investing in digital supply orchestration, batch genealogy, and cold-chain monitoring to reduce stockouts and QA deviations. Strategic initiatives include partnerships with mid-market biopharma on recombinant and encapsulated variants, plus risk-sharing agreements that accelerate development timelines. Differentiation lies in supply resilience, regulatory documentation depth, and technology-enabled traceability. As clients push into North America and Asia Pacific, LGM’s services underpin faster market entry and lower operational risk.
Market Key Players
Servier Pharmaceuticals LLC
Taj Pharmaceuticals Ltd.
Novus Biologicals LLC
Jazz Pharmaceuticals
Kyowa Hakko Kirin Co., Ltd.
Medac GmbH
Actiza Pharmaceutical Pvt. Ltd.
Merck (Germany)
LGM Pharma
Gennova Biopharmaceuticals
Driver:
Rising ALL Incidence Driving Core Demand
As of 2025, the rising global incidence of acute lymphoblastic leukemia (ALL) remains the single largest driver of the asparaginase market. ALL accounts for nearly 25% of all childhood cancers, with more than 90,000 new pediatric cases reported globally each year. Asparaginase is a cornerstone therapy in multi-agent chemotherapy regimens, and its demand is directly proportional to the growing patient pool. The market is projected to expand at a CAGR of 16–17% through 2033, supported by its inclusion in the World Health Organization’s list of essential medicines.
Biotech Innovation Enhancing Efficacy and Compliance
Advances in biotechnology are further accelerating adoption. Pegylated and recombinant formulations now offer longer half-lives, reduced immunogenicity, and improved patient compliance. Companies investing in encapsulation technologies and AI-driven drug development pipelines are gaining a competitive edge by addressing both efficacy and safety concerns. These innovations are expected to expand the eligible patient base and strengthen long-term revenue growth.
Restraint:
High Therapy Costs Limiting Market Access
High treatment costs remain a critical barrier to wider adoption. Pegylated and recombinant asparaginase therapies can cost up to three times more than conventional formulations, limiting access in low- and middle-income countries. In regions where healthcare budgets are constrained, this pricing challenge restricts penetration and slows overall market expansion.
Safety and Tolerability Concerns Constraining Adoption
Safety concerns also weigh heavily on adoption. Clinical data indicates that up to 30% of patients experience hypersensitivity reactions, while pancreatitis and hepatic toxicity remain significant risks. These adverse effects often necessitate treatment discontinuation or switching to alternative formulations, creating uncertainty for prescribers and payers. Unless manufacturers succeed in developing safer, cost-effective variants, these limitations will continue to cap market growth.
Opportunity:
Orphan Drug Incentives Expanding Commercial Potential
The growing emphasis on orphan drug development presents a major opportunity for asparaginase manufacturers. Orphan drug designation in the United States and Europe provides benefits such as seven to ten years of market exclusivity, tax credits, and accelerated regulatory review. With asparaginase already established in rare hematologic malignancies, companies can expand its use into additional orphan indications, unlocking new revenue streams.
Emerging markets represent another high-growth frontier. Asia Pacific, particularly India and China, is projected to record a CAGR above 18% through 2033 as cancer prevalence rises and healthcare infrastructure expands. Strategic partnerships with local pharmaceutical firms and government-backed oncology programs will be critical for global players seeking to capture share in these fast-growing regions.
Personalized medicine is reshaping the asparaginase market in 2025. Advances in genomic profiling are enabling oncologists to tailor treatment regimens based on patient-specific biomarkers. Asparaginase variants designed for particular leukemia subtypes are gaining traction, improving treatment outcomes and reducing adverse events. This shift toward precision oncology is expected to accelerate clinical adoption and drive premium pricing for specialized formulations.
At the same time, strategic collaborations are becoming central to market expansion. Partnerships between pharmaceutical companies, biotech firms, and academic research centers are accelerating the development of recombinant and encapsulated formulations. Recent alliances in North America and Europe have shortened development timelines and expanded clinical trial pipelines. For investors, these collaborations signal a more competitive landscape where joint ventures and licensing agreements will play a decisive role in shaping market leadership.
Recent Developments
Dec 2024 – Global Research Community: A comprehensive scientific review highlighted significant progress in L-asparaginase enzyme production, focusing on new methods to enhance yield, activity, and specificity. This focus on bioengineering fundamentals is critical for developing more effective and lower-toxicity asparaginase therapies.
Jan 2025 – Jazz Pharmaceuticals: The company secured U.S. FDA approval for Rylaze (asparaginase erwinia chrysanthemi (recombinant)-rywn), a treatment for Acute Lymphoblastic Leukemia (ALL) and Lymphoblastic Lymphoma (LBL). This approval addresses a crucial need for a reliable alternative for patients who develop hypersensitivity to E. coli-derived asparaginase products.
Jun 2025 – College of American Pathologists (CAP): Medical experts highlighted the challenge of "silent inactivation" in E. coli asparaginase therapy, where anti-asparaginase antibodies reduce drug efficacy without causing visible allergic reactions. This clinical finding pressures the market to adopt more advanced therapeutic drug monitoring protocols and non-E. coli-derived formulations.
Jul 2025 – Academic Innovators: Researchers published a study on peptide hydrogels as a novel slow-release formulation for asparaginase, designed to maintain therapeutic levels with less frequent injections. This drug delivery innovation promises to improve patient convenience and treatment adherence, setting a new direction for product development.
Oct 2025 – Clinical Investigators: A new clinical trial began to evaluate the duration of therapeutic asparaginase activity levels following the administration of calaspargase pegol. The study aims to provide data for optimizing dosing schedules, directly impacting treatment efficacy and patient safety in oncology practices.