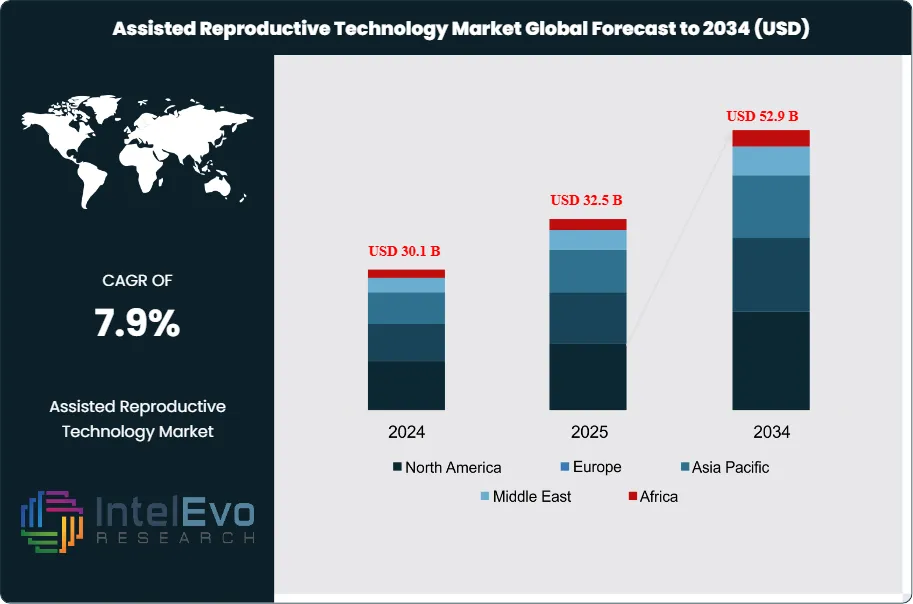
The Assisted Reproductive Technology (ART) market is estimated at USD 30.1 billion in 2024 and is projected to reach approximately USD 52.9 billion by 2034, reflecting a steady CAGR of 7.9% during 2025–2034. Rising infertility rates, greater social acceptance of fertility treatments, and rapid advancements in IVF, ICSI, and genetic screening technologies are accelerating global adoption. Demand is also strengthening as more couples delay parenthood and seek personalized reproductive solutions. With clinics expanding digital care models and integrating AI-driven embryo selection tools, ART is transforming into one of the fastest-evolving segments of modern healthcare.
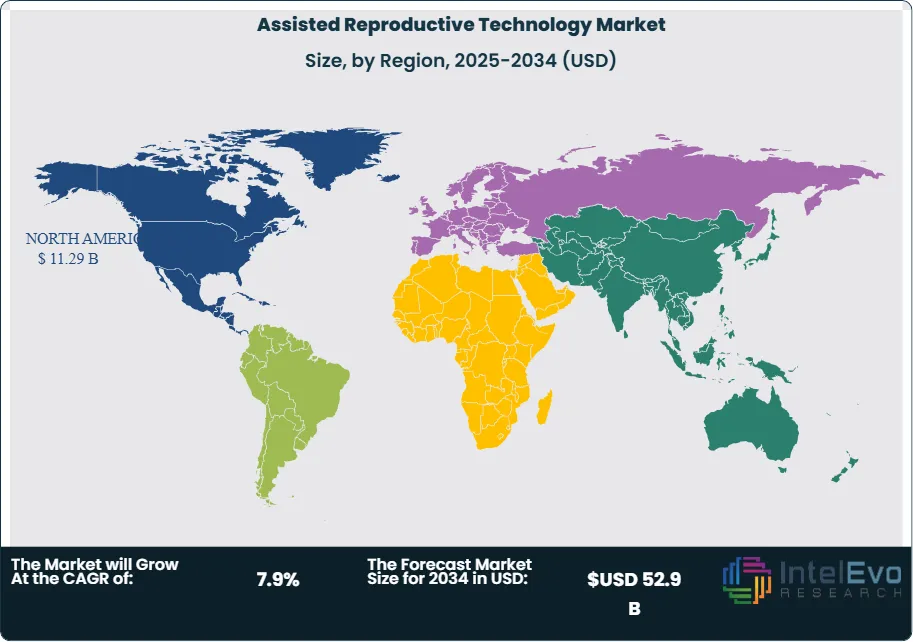
Assisted reproductive technology has moved from a specialized option to a widely adopted healthcare service as infertility rates rise and societal norms around delayed parenthood shift. Over the past decade, clinical success rates, patient access, and insurance coverage have improved across key markets. North America leads the global ART market with a 37.5% share, equivalent to approximately USD 10.5 billion in 2024. The region benefits from well-established fertility clinics, broad insurance reimbursements in select states, and advanced lab infrastructure. However, Asia Pacific is closing the gap. Countries such as India, China, and Japan are seeing double-digit procedure volume growth due to increasing awareness, rising disposable incomes, and medical tourism.
A key factor driving market expansion is the increase in maternal age. In the United States alone, the average age of first-time mothers has risen to over 30 years, contributing to a growing reliance on IVF and other fertility treatments. Demand is also rising among same-sex couples and single individuals seeking parenthood through donor sperm, eggs, or surrogacy arrangements. On the supply side, the field is seeing steady consolidation, with global fertility networks acquiring independent clinics to expand geographic reach and standardize quality.
Technological advancements continue to reshape the ART landscape. Adoption of AI-powered embryo selection, automated lab workflows, and genetic screening tools has helped improve implantation and live birth rates. Meanwhile, egg and embryo cryopreservation are becoming increasingly common, allowing greater flexibility in reproductive planning. However, high treatment costs, limited access in low-income regions, and varied regulatory frameworks remain constraints.
Europe remains a mature but regulated market, while Latin America and the Middle East are emerging as cost-attractive alternatives for cross-border fertility care. Investors should monitor legislative changes, especially in Asia and parts of Africa, where regulatory liberalization could open significant market opportunities. As demand diversifies and care models evolve, the global ART market is positioned for sustained growth, driven by both demographic shifts and ongoing medical innovation.
Key Takeaways
Market Growth: The global assisted reproductive technology (ART) market was valued at USD 30.1 billion in 2024 and is projected to reach USD 52.9 billion by 2034, growing at a CAGR of 7.9%. Rising infertility rates, delayed childbearing, and expanded access to fertility treatments are the primary growth drivers.
By Type: In-vitro fertilization (IVF) accounted for 72.5% of total market share in 2023, making it the dominant procedure type. IVF’s clinical success rates and broader application in both male and female infertility support its continued lead.
By End User: Fertility clinics and specialized reproductive centers captured 66.3% of the market, reflecting patient preference for dedicated facilities offering advanced treatments and personalized care.
Driver: A steady increase in the average maternal age, coupled with growing demand from same-sex couples and single parents, is expanding the ART user base. In developed markets, more than 20% of women now give birth after age 35, significantly boosting procedure volume.
Restraint: High treatment costs and inconsistent insurance coverage remain barriers to access. In many low- and middle-income countries, the out-of-pocket cost for a single IVF cycle can exceed USD 5,000, limiting affordability for a broad segment of the population.
Opportunity: The Asia Pacific region is emerging as a high-growth area, driven by medical tourism, rising infertility awareness, and relaxed regulatory frameworks. Countries like India and Thailand are expected to post CAGR figures above 7% through 2034.
Trend: Adoption of AI-based embryo selection and automated lab processes is gaining traction. Early adopters report improved implantation outcomes and higher efficiency, helping clinics differentiate in competitive urban markets.
Regional Analysis: North America led the global ART market in 2023 with a 37.5% share, supported by robust infrastructure and advanced clinical practice. However, Asia Pacific is closing the gap and is projected to outpace other regions in procedure volume growth by 2027.
Type Analysis
In-vitro fertilization (IVF) continues to hold the largest share within the assisted reproductive technology (ART) market, accounting for approximately 72.5% of global revenue in 2025. IVF remains the most widely adopted technique due to its efficacy in treating a broad spectrum of fertility issues, including blocked fallopian tubes, unexplained infertility, and male factor conditions. The segment’s expansion is strongly tied to rising infertility rates globally, fueled by delayed parenthood, shifting lifestyle patterns, and increased maternal age.
The evolution of IVF protocols has improved success rates, driven by advancements such as genetic screening, embryo vitrification, and blastocyst culture. In parallel, growing affordability in emerging markets and broader insurance coverage in developed economies have lowered access barriers. Markets in Asia and Latin America are seeing double-digit growth in IVF procedures as demand accelerates beyond urban centers. IVF is expected to remain the dominant technology over the next decade, supported by both clinical effectiveness and rising consumer awareness.
End-Use Analysis
Fertility clinics and dedicated ART centers currently account for more than 66.3% of the global market share, making them the primary channel for service delivery. These facilities offer highly specialized reproductive services including IVF, intrauterine insemination (IUI), gamete donation, and genetic diagnostics. Patients increasingly prefer clinics due to shorter wait times, streamlined protocols, and access to the latest reproductive technologies under one roof.
The segment continues to benefit from growing private investment, clinical partnerships, and digital transformation. Many top-tier clinics now offer online consultations, AI-enabled embryo selection, and integrated post-treatment support, improving both access and outcomes. As fertility awareness increases and ART becomes more normalized, particularly among same-sex couples and single parents, the number of specialized clinics is expanding in both mature and emerging markets.
Regional Analysis
North America remains the dominant region in the ART market, holding a 37.5% share in 2025, supported by advanced healthcare infrastructure and widespread use of fertility technologies. In the United States alone, over 432,000 IVF cycles were performed in 2023, resulting in nearly 96,000 births, according to data from SART. Fertility services are increasingly supported by employer-sponsored benefit programs, especially among Fortune 500 companies offering egg freezing, IVF coverage, and fertility counseling.
However, Asia Pacific is projected to record the highest CAGR through 2034, led by rising demand from urban populations in India, China, Japan, and South Korea. Improvements in clinic infrastructure, favorable government initiatives, and competitive pricing have made the region a hub for cross-border reproductive care. Innovations such as time-lapse embryo monitoring and affordable PGT-A testing are being adopted rapidly, further accelerating procedure volume. As social stigma declines and fertility literacy improves, Asia Pacific is set to become the most dynamic growth engine in the global ART market.
By Type (In-Vitro Fertilization (IVF), Frozen Non-Donor, Frozen Donor, Fresh Non-Donor, Fresh Donor, Artificial Insemination, Intravaginal Insemination (IVI), Intrauterine Insemination (IUI), Intratubal Insemination (ITI), Intracervical Insemination (ICI)), By End-User (Fertility Clinics & Other Facilities, Hospitals & Other Settings)
Research Methodology
Primary Research- 100 Interviews of Stakeholders
Secondary Research
Desk Research
Regional scope
North America (United States, Canada, Mexico)
Latin America (Brazil, Argentina, Columbia)
East Asia And Pacific (China, Japan, South Korea, Australia, Cambodia, Fiji, Indonesia)
Sea And South Asia (India, Singapore, Thailand, Taiwan, Malaysia)
Eastern Europe (Poland, Russia, Czech Republic, Romania)
Western Europe (Germany, U.K., France, Spain, Itlay)
Middle East & Africa (GCC Countries, Egypt, Nigeria, South Africa, Israel)
Competitive Landscape
Astorg, Conceive Fertility Foundation, Merck KGaA (EMD Serono, Inc), Vitrolife AB, Oxford Gene Technology, Genera Biomedx, Millendo Therapeutics, Inc, The Cooper Companies, Inc, Progyny Inc, Thermo Fisher Scientific, Inc
Customization Scope
Customization for segments, region/country-level will be provided. Moreover, additional customization can be done based on the requirements.
Pricing and Purchase Options
Avail customized purchase options to meet your exact research needs. We have three licenses to opt for: Single User License, Multi-User License (Up to 5 Users), Corporate Use License (Unlimited User and Printable PDF).
TABLE OF CONTENTS
1. EXECUTIVE SUMMARY
1.1. MARKET SNAPSHOT
1.2. KEY FINDINGS & INSIGHTS
1.3. ANALYST RECOMMENDATIONS
1.4. FUTURE OUTLOOK
2. RESEARCH METHODOLOGY
2.1. MARKET DEFINITION & SCOPE
2.2. RESEARCH OBJECTIVES: PRIMARY & SECONDARY DATA SOURCES
2.3. DATA COLLECTION SOURCES
2.3.1. COVERAGE OF 100+ PRIMARY RESEARCH/CONSULTATION CALLS WITH INDUSTRY STAKEHOLDERS
FIGURE 17 NORTH AMERICA ASSISTED REPRODUCTIVE TECHNOLOGY CURRENT AND FUTURE TYPE ANALYSIS, 2025–2034, (USD MILLION)
FIGURE 18 NORTH AMERICA ASSISTED REPRODUCTIVE TECHNOLOGY CURRENT AND FUTURE END USER ANALYSIS, 2025–2034, (USD MILLION)
FIGURE 19 MARKET SHARE BY COUNTRY
FIGURE 20 LATIN AMERICA ASSISTED REPRODUCTIVE TECHNOLOGY CURRENT AND FUTURE TYPE ANALYSIS, 2025–2034, (USD MILLION)
FIGURE 21 LATIN AMERICA ASSISTED REPRODUCTIVE TECHNOLOGY CURRENT AND FUTURE END USER ANALYSIS, 2025–2034, (USD MILLION)
FIGURE 22 MARKET SHARE BY COUNTRY
FIGURE 23 EASTERN EUROPE ASSISTED REPRODUCTIVE TECHNOLOGY CURRENT AND FUTURE TYPE ANALYSIS, 2025–2034, (USD MILLION)
FIGURE 24 EASTERN EUROPE ASSISTED REPRODUCTIVE TECHNOLOGY CURRENT AND FUTURE END USER ANALYSIS, 2025–2034, (USD MILLION)
FIGURE 25 MARKET SHARE BY COUNTRY
FIGURE 26 WESTERN EUROPE ASSISTED REPRODUCTIVE TECHNOLOGY CURRENT AND FUTURE TYPE ANALYSIS, 2025–2034, (USD MILLION)
FIGURE 27 WESTERN EUROPE ASSISTED REPRODUCTIVE TECHNOLOGY CURRENT AND FUTURE END USER ANALYSIS, 2025–2034, (USD MILLION)
FIGURE 28 MARKET SHARE BY COUNTRY
FIGURE 29 EAST ASIA AND PACIFIC ASSISTED REPRODUCTIVE TECHNOLOGY CURRENT AND FUTURE TYPE ANALYSIS, 2025–2034, (USD MILLION)
FIGURE 30 EAST ASIA AND PACIFIC ASSISTED REPRODUCTIVE TECHNOLOGY CURRENT AND FUTURE END USER ANALYSIS, 2025–2034, (USD MILLION)
FIGURE 31 MARKET SHARE BY COUNTRY
FIGURE 32 SEA AND SOUTH ASIA ASSISTED REPRODUCTIVE TECHNOLOGY CURRENT AND FUTURE TYPE ANALYSIS, 2025–2034, (USD MILLION)
FIGURE 33 SEA AND SOUTH ASIA ASSISTED REPRODUCTIVE TECHNOLOGY CURRENT AND FUTURE END USER ANALYSIS, 2025–2034, (USD MILLION)
FIGURE 34 MARKET SHARE BY COUNTRY
FIGURE 35 MIDDLE EAST AND AFRICA ASSISTED REPRODUCTIVE TECHNOLOGY CURRENT AND FUTURE TYPE ANALYSIS, 2025–2034, (USD MILLION)
FIGURE 36 MIDDLE EAST AND AFRICA ASSISTED REPRODUCTIVE TECHNOLOGY CURRENT AND FUTURE END USER ANALYSIS, 2025–2034, (USD MILLION)
FIGURE 37 NORTH AMERICA ASSISTED REPRODUCTIVE TECHNOLOGY CURRENT AND FUTURE MARKET VOLUME SHARE REGIONAL ANALYSIS, 2025–2034, (USD MILLION)
FIGURE 38 U.S. ASSISTED REPRODUCTIVE TECHNOLOGY CURRENT AND FUTURE TYPE ANALYSIS, 2025–2034, (USD MILLION)
FIGURE 39 U.S. ASSISTED REPRODUCTIVE TECHNOLOGY CURRENT AND FUTURE END USER ANALYSIS, 2025–2034, (USD MILLION)
FIGURE 40 CANADA ASSISTED REPRODUCTIVE TECHNOLOGY CURRENT AND FUTURE TYPE ANALYSIS, 2025–2034, (USD MILLION)
FIGURE 41 CANADA ASSISTED REPRODUCTIVE TECHNOLOGY CURRENT AND FUTURE END USER ANALYSIS, 2025–2034, (USD MILLION)
FIGURE 42 LATIN AMERICA ASSISTED REPRODUCTIVE TECHNOLOGY CURRENT AND FUTURE MARKET VOLUME SHARE REGIONAL ANALYSIS, 2025–2034, (USD MILLION)
FIGURE 43 MEXICO ASSISTED REPRODUCTIVE TECHNOLOGY CURRENT AND FUTURE TYPE ANALYSIS, 2025–2034, (USD MILLION)
FIGURE 44 MEXICO ASSISTED REPRODUCTIVE TECHNOLOGY CURRENT AND FUTURE END USER ANALYSIS, 2025–2034, (USD MILLION)
FIGURE 45 BRAZIL ASSISTED REPRODUCTIVE TECHNOLOGY CURRENT AND FUTURE TYPE ANALYSIS, 2025–2034, (USD MILLION)
FIGURE 46 BRAZIL ASSISTED REPRODUCTIVE TECHNOLOGY CURRENT AND FUTURE END USER ANALYSIS, 2025–2034, (USD MILLION)
FIGURE 47 ARGENTINA ASSISTED REPRODUCTIVE TECHNOLOGY CURRENT AND FUTURE TYPE ANALYSIS, 2025–2034, (USD MILLION)
FIGURE 48 ARGENTINA ASSISTED REPRODUCTIVE TECHNOLOGY CURRENT AND FUTURE END USER ANALYSIS, 2025–2034, (USD MILLION)
FIGURE 49 COLUMBIA ASSISTED REPRODUCTIVE TECHNOLOGY CURRENT AND FUTURE TYPE ANALYSIS, 2025–2034, (USD MILLION)
FIGURE 50 COLUMBIA ASSISTED REPRODUCTIVE TECHNOLOGY CURRENT AND FUTURE END USER ANALYSIS, 2025–2034, (USD MILLION)
FIGURE 51 REST OF LATIN AMERICA ASSISTED REPRODUCTIVE TECHNOLOGY CURRENT AND FUTURE TYPE ANALYSIS, 2025–2034, (USD MILLION)
FIGURE 52 REST OF LATIN AMERICA ASSISTED REPRODUCTIVE TECHNOLOGY CURRENT AND FUTURE END USER ANALYSIS, 2025–2034, (USD MILLION)
FIGURE 53 EASTERN EUROPE ASSISTED REPRODUCTIVE TECHNOLOGY CURRENT AND FUTURE MARKET VOLUME SHARE REGIONAL ANALYSIS, 2025–2034, (USD MILLION)
FIGURE 54 POLAND ASSISTED REPRODUCTIVE TECHNOLOGY CURRENT AND FUTURE TYPE ANALYSIS, 2025–2034, (USD MILLION)
FIGURE 55 POLAND ASSISTED REPRODUCTIVE TECHNOLOGY CURRENT AND FUTURE END USER ANALYSIS, 2025–2034, (USD MILLION)
FIGURE 56 RUSSIA ASSISTED REPRODUCTIVE TECHNOLOGY CURRENT AND FUTURE TYPE ANALYSIS, 2025–2034, (USD MILLION)
FIGURE 57 RUSSIA ASSISTED REPRODUCTIVE TECHNOLOGY CURRENT AND FUTURE END USER ANALYSIS, 2025–2034, (USD MILLION)
FIGURE 58 CZECH REPUBLIC ASSISTED REPRODUCTIVE TECHNOLOGY CURRENT AND FUTURE TYPE ANALYSIS, 2025–2034, (USD MILLION)
FIGURE 59 CZECH REPUBLIC ASSISTED REPRODUCTIVE TECHNOLOGY CURRENT AND FUTURE END USER ANALYSIS, 2025–2034, (USD MILLION)
FIGURE 60 ROMANIA ASSISTED REPRODUCTIVE TECHNOLOGY CURRENT AND FUTURE TYPE ANALYSIS, 2025–2034, (USD MILLION)
FIGURE 61 ROMANIA ASSISTED REPRODUCTIVE TECHNOLOGY CURRENT AND FUTURE END USER ANALYSIS, 2025–2034, (USD MILLION)
FIGURE 62 REST OF EASTERN EUROPE ASSISTED REPRODUCTIVE TECHNOLOGY CURRENT AND FUTURE TYPE ANALYSIS, 2025–2034, (USD MILLION)
FIGURE 63 REST OF EASTERN EUROPE ASSISTED REPRODUCTIVE TECHNOLOGY CURRENT AND FUTURE END USER ANALYSIS, 2025–2034, (USD MILLION)
FIGURE 64 WESTERN EUROPE ASSISTED REPRODUCTIVE TECHNOLOGY CURRENT AND FUTURE MARKET VOLUME SHARE REGIONAL ANALYSIS, 2025–2034, (USD MILLION)
FIGURE 65 GERMANY ASSISTED REPRODUCTIVE TECHNOLOGY CURRENT AND FUTURE TYPE ANALYSIS, 2025–2034, (USD MILLION)
FIGURE 66 GERMANY ASSISTED REPRODUCTIVE TECHNOLOGY CURRENT AND FUTURE END USER ANALYSIS, 2025–2034, (USD MILLION)
FIGURE 67 FRANCE ASSISTED REPRODUCTIVE TECHNOLOGY CURRENT AND FUTURE TYPE ANALYSIS, 2025–2034, (USD MILLION)
FIGURE 68 FRANCE ASSISTED REPRODUCTIVE TECHNOLOGY CURRENT AND FUTURE END USER ANALYSIS, 2025–2034, (USD MILLION)
FIGURE 69 UK ASSISTED REPRODUCTIVE TECHNOLOGY CURRENT AND FUTURE TYPE ANALYSIS, 2025–2034, (USD MILLION)
FIGURE 70 UK ASSISTED REPRODUCTIVE TECHNOLOGY CURRENT AND FUTURE END USER ANALYSIS, 2025–2034, (USD MILLION)
FIGURE 71 SPAIN ASSISTED REPRODUCTIVE TECHNOLOGY CURRENT AND FUTURE TYPE ANALYSIS, 2025–2034, (USD MILLION)
FIGURE 72 SPAIN ASSISTED REPRODUCTIVE TECHNOLOGY CURRENT AND FUTURE END USER ANALYSIS, 2025–2034, (USD MILLION)
FIGURE 73 ITALY ASSISTED REPRODUCTIVE TECHNOLOGY CURRENT AND FUTURE TYPE ANALYSIS, 2025–2034, (USD MILLION)
FIGURE 74 ITALY ASSISTED REPRODUCTIVE TECHNOLOGY CURRENT AND FUTURE END USER ANALYSIS, 2025–2034, (USD MILLION)
FIGURE 75 REST OF WESTERN EUROPE ASSISTED REPRODUCTIVE TECHNOLOGY CURRENT AND FUTURE TYPE ANALYSIS, 2025–2034, (USD MILLION)
FIGURE 76 REST OF WESTERN EUROPE ASSISTED REPRODUCTIVE TECHNOLOGY CURRENT AND FUTURE END USER ANALYSIS, 2025–2034, (USD MILLION)
FIGURE 77 EAST ASIA AND PACIFIC ASSISTED REPRODUCTIVE TECHNOLOGY CURRENT AND FUTURE MARKET VOLUME SHARE REGIONAL ANALYSIS, 2025–2034, (USD MILLION)
FIGURE 78 CHINA ASSISTED REPRODUCTIVE TECHNOLOGY CURRENT AND FUTURE TYPE ANALYSIS, 2025–2034, (USD MILLION)
FIGURE 79 CHINA ASSISTED REPRODUCTIVE TECHNOLOGY CURRENT AND FUTURE END USER ANALYSIS, 2025–2034, (USD MILLION)
FIGURE 80 JAPAN ASSISTED REPRODUCTIVE TECHNOLOGY CURRENT AND FUTURE TYPE ANALYSIS, 2025–2034, (USD MILLION)
FIGURE 81 JAPAN ASSISTED REPRODUCTIVE TECHNOLOGY CURRENT AND FUTURE END USER ANALYSIS, 2025–2034, (USD MILLION)
FIGURE 82 AUSTRALIA ASSISTED REPRODUCTIVE TECHNOLOGY CURRENT AND FUTURE TYPE ANALYSIS, 2025–2034, (USD MILLION)
FIGURE 83 AUSTRALIA ASSISTED REPRODUCTIVE TECHNOLOGY CURRENT AND FUTURE END USER ANALYSIS, 2025–2034, (USD MILLION)
FIGURE 84 CAMBODIA ASSISTED REPRODUCTIVE TECHNOLOGY CURRENT AND FUTURE TYPE ANALYSIS, 2025–2034, (USD MILLION)
FIGURE 85 CAMBODIA ASSISTED REPRODUCTIVE TECHNOLOGY CURRENT AND FUTURE END USER ANALYSIS, 2025–2034, (USD MILLION)
FIGURE 86 FIJI ASSISTED REPRODUCTIVE TECHNOLOGY CURRENT AND FUTURE TYPE ANALYSIS, 2025–2034, (USD MILLION)
FIGURE 87 FIJI ASSISTED REPRODUCTIVE TECHNOLOGY CURRENT AND FUTURE END USER ANALYSIS, 2025–2034, (USD MILLION)
FIGURE 88 INDONESIA ASSISTED REPRODUCTIVE TECHNOLOGY CURRENT AND FUTURE TYPE ANALYSIS, 2025–2034, (USD MILLION)
FIGURE 89 INDONESIA ASSISTED REPRODUCTIVE TECHNOLOGY CURRENT AND FUTURE END USER ANALYSIS, 2025–2034, (USD MILLION)
FIGURE 90 SOUTH KOREA ASSISTED REPRODUCTIVE TECHNOLOGY CURRENT AND FUTURE TYPE ANALYSIS, 2025–2034, (USD MILLION)
FIGURE 91 SOUTH KOREA ASSISTED REPRODUCTIVE TECHNOLOGY CURRENT AND FUTURE END USER ANALYSIS, 2025–2034, (USD MILLION)
FIGURE 92 REST OF EAST ASIA AND PACIFIC ASSISTED REPRODUCTIVE TECHNOLOGY CURRENT AND FUTURE TYPE ANALYSIS, 2025–2034, (USD MILLION)
FIGURE 93 REST OF EAST ASIA AND PACIFIC ASSISTED REPRODUCTIVE TECHNOLOGY CURRENT AND FUTURE END USER ANALYSIS, 2025–2034, (USD MILLION)
FIGURE 94 SEA AND SOUTH ASIA ASSISTED REPRODUCTIVE TECHNOLOGY CURRENT AND FUTURE MARKET VOLUME SHARE REGIONAL ANALYSIS, 2025–2034, (USD MILLION)
FIGURE 95 BANGLADESH ASSISTED REPRODUCTIVE TECHNOLOGY CURRENT AND FUTURE TYPE ANALYSIS, 2025–2034, (USD MILLION)
FIGURE 96 BANGLADESH ASSISTED REPRODUCTIVE TECHNOLOGY CURRENT AND FUTURE END USER ANALYSIS, 2025–2034, (USD MILLION)
FIGURE 97 NEW ZEALAND ASSISTED REPRODUCTIVE TECHNOLOGY CURRENT AND FUTURE TYPE ANALYSIS, 2025–2034, (USD MILLION)
FIGURE 98 NEW ZEALAND ASSISTED REPRODUCTIVE TECHNOLOGY CURRENT AND FUTURE END USER ANALYSIS, 2025–2034, (USD MILLION)
FIGURE 99 INDIA ASSISTED REPRODUCTIVE TECHNOLOGY CURRENT AND FUTURE TYPE ANALYSIS, 2025–2034, (USD MILLION)
FIGURE 100 INDIA ASSISTED REPRODUCTIVE TECHNOLOGY CURRENT AND FUTURE END USER ANALYSIS, 2025–2034, (USD MILLION)
FIGURE 101 SINGAPORE ASSISTED REPRODUCTIVE TECHNOLOGY CURRENT AND FUTURE TYPE ANALYSIS, 2025–2034, (USD MILLION)
FIGURE 102 SINGAPORE ASSISTED REPRODUCTIVE TECHNOLOGY CURRENT AND FUTURE END USER ANALYSIS, 2025–2034, (USD MILLION)
FIGURE 103 THAILAND ASSISTED REPRODUCTIVE TECHNOLOGY CURRENT AND FUTURE TYPE ANALYSIS, 2025–2034, (USD MILLION)
FIGURE 104 THAILAND ASSISTED REPRODUCTIVE TECHNOLOGY CURRENT AND FUTURE END USER ANALYSIS, 2025–2034, (USD MILLION)
FIGURE 105 TAIWAN ASSISTED REPRODUCTIVE TECHNOLOGY CURRENT AND FUTURE TYPE ANALYSIS, 2025–2034, (USD MILLION)
FIGURE 106 TAIWAN ASSISTED REPRODUCTIVE TECHNOLOGY CURRENT AND FUTURE END USER ANALYSIS, 2025–2034, (USD MILLION)
FIGURE 107 MALAYSIA ASSISTED REPRODUCTIVE TECHNOLOGY CURRENT AND FUTURE TYPE ANALYSIS, 2025–2034, (USD MILLION)
FIGURE 108 MALAYSIA ASSISTED REPRODUCTIVE TECHNOLOGY CURRENT AND FUTURE END USER ANALYSIS, 2025–2034, (USD MILLION)
FIGURE 109 REST OF SEA AND SOUTH ASIA ASSISTED REPRODUCTIVE TECHNOLOGY CURRENT AND FUTURE TYPE ANALYSIS, 2025–2034, (USD MILLION)
FIGURE 110 REST OF SEA AND SOUTH ASIA ASSISTED REPRODUCTIVE TECHNOLOGY CURRENT AND FUTURE END USER ANALYSIS, 2025–2034, (USD MILLION)
FIGURE 111 MIDDLE EAST AND AFRICA ASSISTED REPRODUCTIVE TECHNOLOGY CURRENT AND FUTURE MARKET VOLUME SHARE REGIONAL ANALYSIS, 2025–2034, (USD MILLION)
FIGURE 112 GCC COUNTRIES ASSISTED REPRODUCTIVE TECHNOLOGY CURRENT AND FUTURE TYPE ANALYSIS, 2025–2034, (USD MILLION)
FIGURE 113 GCC COUNTRIES ASSISTED REPRODUCTIVE TECHNOLOGY CURRENT AND FUTURE END USER ANALYSIS, 2025–2034, (USD MILLION)
FIGURE 114 SAUDI ARABIA ASSISTED REPRODUCTIVE TECHNOLOGY CURRENT AND FUTURE TYPE ANALYSIS, 2025–2034, (USD MILLION)
FIGURE 115 SAUDI ARABIA ASSISTED REPRODUCTIVE TECHNOLOGY CURRENT AND FUTURE END USER ANALYSIS, 2025–2034, (USD MILLION)
FIGURE 116 UAE ASSISTED REPRODUCTIVE TECHNOLOGY CURRENT AND FUTURE TYPE ANALYSIS, 2025–2034, (USD MILLION)
FIGURE 117 UAE ASSISTED REPRODUCTIVE TECHNOLOGY CURRENT AND FUTURE END USER ANALYSIS, 2025–2034, (USD MILLION)
FIGURE 118 BAHRAIN ASSISTED REPRODUCTIVE TECHNOLOGY CURRENT AND FUTURE TYPE ANALYSIS, 2025–2034, (USD MILLION)
FIGURE 119 BAHRAIN ASSISTED REPRODUCTIVE TECHNOLOGY CURRENT AND FUTURE END USER ANALYSIS, 2025–2034, (USD MILLION)
FIGURE 120 KUWAIT ASSISTED REPRODUCTIVE TECHNOLOGY CURRENT AND FUTURE TYPE ANALYSIS, 2025–2034, (USD MILLION)
FIGURE 121 KUWAIT ASSISTED REPRODUCTIVE TECHNOLOGY CURRENT AND FUTURE END USER ANALYSIS, 2025–2034, (USD MILLION)
FIGURE 122 OMAN ASSISTED REPRODUCTIVE TECHNOLOGY CURRENT AND FUTURE TYPE ANALYSIS, 2025–2034, (USD MILLION)
FIGURE 123 OMAN ASSISTED REPRODUCTIVE TECHNOLOGY CURRENT AND FUTURE END USER ANALYSIS, 2025–2034, (USD MILLION)
FIGURE 124 QATAR ASSISTED REPRODUCTIVE TECHNOLOGY CURRENT AND FUTURE TYPE ANALYSIS, 2025–2034, (USD MILLION)
FIGURE 125 QATAR ASSISTED REPRODUCTIVE TECHNOLOGY CURRENT AND FUTURE END USER ANALYSIS, 2025–2034, (USD MILLION)
FIGURE 126 EGYPT ASSISTED REPRODUCTIVE TECHNOLOGY CURRENT AND FUTURE TYPE ANALYSIS, 2025–2034, (USD MILLION)
FIGURE 127 EGYPT ASSISTED REPRODUCTIVE TECHNOLOGY CURRENT AND FUTURE END USER ANALYSIS, 2025–2034, (USD MILLION)
FIGURE 128 NIGERIA ASSISTED REPRODUCTIVE TECHNOLOGY CURRENT AND FUTURE TYPE ANALYSIS, 2025–2034, (USD MILLION)
FIGURE 129 NIGERIA ASSISTED REPRODUCTIVE TECHNOLOGY CURRENT AND FUTURE END USER ANALYSIS, 2025–2034, (USD MILLION)
FIGURE 130 SOUTH AFRICA ASSISTED REPRODUCTIVE TECHNOLOGY CURRENT AND FUTURE TYPE ANALYSIS, 2025–2034, (USD MILLION)
FIGURE 131 SOUTH AFRICA ASSISTED REPRODUCTIVE TECHNOLOGY CURRENT AND FUTURE END USER ANALYSIS, 2025–2034, (USD MILLION)
FIGURE 132 ISRAEL ASSISTED REPRODUCTIVE TECHNOLOGY CURRENT AND FUTURE TYPE ANALYSIS, 2025–2034, (USD MILLION)
FIGURE 133 ISRAEL ASSISTED REPRODUCTIVE TECHNOLOGY CURRENT AND FUTURE END USER ANALYSIS, 2025–2034, (USD MILLION)
FIGURE 134 REST OF MEA ASSISTED REPRODUCTIVE TECHNOLOGY CURRENT AND FUTURE TYPE ANALYSIS, 2025–2034, (USD MILLION)
FIGURE 135 REST OF MEA ASSISTED REPRODUCTIVE TECHNOLOGY CURRENT AND FUTURE END USER ANALYSIS, 2025–2034, (USD MILLION)
FIGURE 136 U. S. MARKET SHARE ANALYSIS BY TYPE (2024)
FIGURE 137 U. S. MARKET SHARE ANALYSIS BY END USER (2024)
FIGURE 138 CANADA MARKET SHARE ANALYSIS BY TYPE (2024)
FIGURE 139 CANADA MARKET SHARE ANALYSIS BY END USER (2024)
FIGURE 140 MEXICO MARKET SHARE ANALYSIS BY TYPE (2024)
FIGURE 141 MEXICO MARKET SHARE ANALYSIS BY END USER (2024)
FIGURE 142 CHINA MARKET SHARE ANALYSIS BY TYPE (2024)
FIGURE 143 CHINA MARKET SHARE ANALYSIS BY END USER (2024)
FIGURE 144 JAPAN MARKET SHARE ANALYSIS BY TYPE (2024)
FIGURE 145 JAPAN MARKET SHARE ANALYSIS BY END USER (2024)
FIGURE 146 INDIA MARKET SHARE ANALYSIS BY TYPE (2024)
FIGURE 147 INDIA MARKET SHARE ANALYSIS BY END USER (2024)
FIGURE 148 SOUTH KOREA MARKET SHARE ANALYSIS BY TYPE (2024)
FIGURE 149 SOUTH KOREA MARKET SHARE ANALYSIS BY END USER (2024)
FIGURE 150 SAUDI ARABIA MARKET SHARE ANALYSIS BY TYPE (2024)
FIGURE 151 SAUDI ARABIA MARKET SHARE ANALYSIS BY END USER (2024)
FIGURE 152 UAE MARKET SHARE ANALYSIS BY TYPE (2024)
FIGURE 153 UAE MARKET SHARE ANALYSIS BY END USER (2024)
FIGURE 154 EGYPT MARKET SHARE ANALYSIS BY TYPE (2024)
FIGURE 155 EGYPT MARKET SHARE ANALYSIS BY END USER (2024)
FIGURE 156 NIGERIA MARKET SHARE ANALYSIS BY TYPE (2024)
FIGURE 157 NIGERIA MARKET SHARE ANALYSIS BY END USER (2024)
FIGURE 158 SOUTH AFRICA MARKET SHARE ANALYSIS BY TYPE (2024)
FIGURE 159 SOUTH AFRICA MARKET SHARE ANALYSIS BY END USER (2024)
FIGURE 160 GERMANY MARKET SHARE ANALYSIS BY TYPE (2024)
FIGURE 161 GERMANY MARKET SHARE ANALYSIS BY END USER (2024)
FIGURE 162 FRANCE MARKET SHARE ANALYSIS BY TYPE (2024)
FIGURE 163 FRANCE MARKET SHARE ANALYSIS BY END USER (2024)
FIGURE 164 UK MARKET SHARE ANALYSIS BY TYPE (2024)
FIGURE 165 UK MARKET SHARE ANALYSIS BY END USER (2024)
FIGURE 166 SPAIN MARKET SHARE ANALYSIS BY TYPE (2024)
FIGURE 167 SPAIN MARKET SHARE ANALYSIS BY END USER (2024)
FIGURE 168 ITALY MARKET SHARE ANALYSIS BY TYPE (2024)
FIGURE 169 ITALY MARKET SHARE ANALYSIS BY END USER (2024)
FIGURE 170 BRAZIL MARKET SHARE ANALYSIS BY TYPE (2024)
FIGURE 171 BRAZIL MARKET SHARE ANALYSIS BY END USER (2024)
FIGURE 172 ARGENTINA MARKET SHARE ANALYSIS BY TYPE (2024)
FIGURE 173 ARGENTINA MARKET SHARE ANALYSIS BY END USER (2024)
FIGURE 174 COLUMBIA MARKET SHARE ANALYSIS BY TYPE (2024)
FIGURE 175 COLUMBIA MARKET SHARE ANALYSIS BY END USER (2024)
FIGURE 176 GLOBAL ASSISTED REPRODUCTIVE TECHNOLOGY CURRENT AND FUTURE MARKET KEY COUNTRY LEVEL ANALYSIS, 2024–2034, (USD MILLION)
FIGURE 177 FINANCIAL OVERVIEW:
Key Player Analysis
Vitrolife AB: Vitrolife AB holds a leading position in the global assisted reproductive technology (ART) market, particularly within the IVF lab equipment and consumables segment. The company’s portfolio spans embryo culture media, time-lapse incubation systems, and cryopreservation tools, which are widely adopted across fertility clinics in Europe, Asia, and North America. In 2022, Vitrolife completed its acquisition of Igenomix, a move that significantly expanded its footprint in genetic testing services. This integration has allowed the company to offer end-to-end fertility solutions, from diagnostics through embryo transfer, enhancing its value proposition in a competitive market.
As of 2025, Vitrolife continues to invest in R&D, focusing on automation and AI-supported embryo assessment. Its EmbryoScope time-lapse technology, now in its third generation, is used in over 600 clinics globally. The company reported over SEK 1.6 billion in ART-related revenue in 2024, underpinned by rising IVF procedure volumes and growing demand for lab standardization in emerging markets. Vitrolife’s combination of consumables and diagnostics positions it as a full-service provider with high switching costs for clinics, ensuring long-term client retention.
Thermo Fisher Scientific, Inc: Thermo Fisher remains a dominant force in the ART space through its genetic testing platforms and laboratory instrumentation. Positioned as a key innovator, the company supports preimplantation genetic testing (PGT), a segment that accounted for over 77% of genetic testing use in IVF cycles by 2024. Its Ion Torrent NGS systems and reproductive health assays are widely used by fertility labs aiming to improve implantation success rates and reduce inherited disease risk.
In July 2023, Thermo Fisher expanded its reproductive health portfolio by launching a new NGS-based PGT-A kit tailored for low-input samples. In 2025, it continues to scale its genomic services in Asia and North America, leveraging its global logistics and service network. The company’s vertical integration in instruments, consumables, and software analytics gives it a strong advantage in standardizing workflows across clinics and boosting lab efficiency.
The Cooper Companies, Inc: The Cooper Companies operates in the ART market through its CooperSurgical division, which is considered a market leader in IVF medical devices and fertility consumables. The firm’s IVF business includes embryo transfer catheters, lab media, and vitrification systems. CooperSurgical has built long-term relationships with major fertility networks across the U.S. and Europe, accounting for a significant share of its recurring revenue.
Recent acquisitions, including Generate Life Sciences, have broadened the company’s portfolio into donor gametes and fertility preservation services. As of 2025, Cooper is targeting geographic expansion into Latin America and Southeast Asia, markets where clinic networks are growing rapidly. Its focus on procedural safety, regulatory compliance, and physician training reinforces brand preference in highly regulated markets. The company’s diversified offering across equipment, media, and donor services ensures steady growth and margin protection.
Progyny Inc: Progyny is positioned as a challenger in the ART ecosystem, offering fertility benefits management solutions to large employers across the U.S. Its model connects patients with a curated network of fertility specialists while providing cost and outcome transparency. As of early 2025, Progyny serves over 370 employers, including several Fortune 500 companies, covering more than 5.5 million lives.
The company differentiates itself by managing the full fertility journey—from initial consultations to IVF and preservation—under a bundled payment model. Progyny’s clinical outcomes, such as single embryo transfer rates and live birth success per cycle, consistently outperform U.S. averages. Its tech-enabled platform collects patient-level data that drives outcome-based contracting, a key value driver for enterprise clients. As employer-sponsored fertility coverage expands, Progyny’s scalable model continues to gain traction, particularly among tech, finance, and healthcare employers.
Market Key Players
Astorg
Conceive Fertility Foundation
Merck KGaA (EMD Serono, Inc)
Vitrolife AB
Oxford Gene Technology
Genera Biomedx
Millendo Therapeutics, Inc
The Cooper Companies, Inc
Progyny Inc
Thermo Fisher Scientific, Inc
Driver:
Growing Global Infertility Rates Fueling ART Market Expansion
As of 2025, the global burden of infertility continues to grow, with 1 in 6 individuals affected, according to the World Health Organization. This persistent demand is a primary engine behind the expansion of the assisted reproductive technology (ART) market. Rising maternal age, increased male infertility rates, and lifestyle-related health factors such as obesity, smoking, and environmental toxins contribute to the widening patient base. Additionally, delayed parenthood in high-income countries has intensified reliance on procedures like in-vitro fertilization (IVF) and intracytoplasmic sperm injection (ICSI) to achieve successful pregnancies.
Rising IVF Procedure Volumes Supporting Sustained ART Growth
This demographic and behavioral shift has translated into steady procedural growth. For example, the number of IVF cycles in the U.S. increased by over 10% between 2022 and 2024. As awareness improves and access broadens, demand for ART services is expected to remain resilient, particularly in urban centers and emerging middle-income markets. The ongoing normalization of fertility treatments globally also opens the door for continued service expansion and private investment in the sector.
Restraint:
High ART Treatment Costs Limiting Patient Accessibility
Despite strong demand, the high cost of ART procedures remains a critical barrier to market penetration. A typical IVF cycle can cost anywhere between USD 12,000 and USD 20,000 in developed economies, excluding add-ons like ICSI or preimplantation genetic testing. In countries such as India, while per-cycle costs are lower (averaging INR 90,000 to INR 150,000), the expense still exceeds what many households can afford without financing or subsidies.
Lack of Insurance Coverage Restricting Adoption in Lower-Income Regions
Multiple cycles are often required to achieve a live birth, compounding financial stress. In regions without insurance coverage or public funding, out-of-pocket costs exclude a large portion of the population from accessing ART. This limits overall market growth, particularly in lower-income economies, and raises concerns about healthcare equity within reproductive care.
Opportunity:
Rapid Uptake of Fertility Preservation Creating New Revenue Streams
Rapid adoption of fertility preservation techniques is opening new revenue streams in the ART market. Egg and sperm freezing are gaining traction among young adults delaying parenthood for personal, medical, or professional reasons. In the U.S., egg freezing cycles grew by nearly 40% between 2022 and 2023, driven by demand from women in their early 30s, cancer patients undergoing chemotherapy, and individuals in gender transition.
Institutional Support and Awareness Driving Expansion of Preservation Services
In March 2025, ASCO updated clinical guidelines recommending that fertility preservation be discussed at the point of cancer diagnosis, further institutionalizing this practice. As both awareness and procedural success rates rise, fertility preservation is becoming a core component of reproductive healthcare. This shift supports new patient segments and encourages clinic diversification into preventive and long-term reproductive planning services.
Trend:
Growing Integration of PGT Advancing Personalized Reproductive Care
The integration of Preimplantation Genetic Testing (PGT) into ART procedures marks a strategic shift toward personalized reproductive care. PGT, especially PGT-A and PGT-M, enables clinics to screen embryos for chromosomal abnormalities or single-gene disorders prior to implantation. In 2024, PGT-M alone accounted for over 77% of the preimplantation genetic testing market, reflecting its growing role in improving IVF success rates and mitigating inherited disease risks.
Companies like Thermo Fisher Scientific and Eurofins Genoma have launched advanced NGS-based PGT platforms that offer greater accuracy and less invasiveness. These tools enhance patient outcomes while reducing the emotional and financial burden of failed cycles. As pricing declines and diagnostic reliability improves, PGT adoption is expected to become a routine part of ART protocols globally, further segmenting the market by service sophistication and treatment personalization.
Recent Developments
Dec 2024 – Thermo Fisher Scientific, Inc.: Thermo Fisher announced the global rollout of its updated Ion Torrent Genexus System, tailored for preimplantation genetic testing (PGT-A). The platform reduces turnaround time by 30% and supports full automation for IVF labs. This upgrade enhances Thermo Fisher's positioning in embryo screening and strengthens its role in high-throughput fertility diagnostics.
Feb 2025 – CooperSurgical (The Cooper Companies, Inc.): CooperSurgical completed its acquisition of a Europe-based donor egg bank for a reported USD 110 million, expanding its fertility preservation and third-party reproduction services. The move deepens Cooper’s presence in the European market and diversifies its offering across the ART value chain.
Apr 2025 – Progyny Inc.: Progyny secured 45 new employer contracts, expanding its fertility benefits coverage to an additional 1.3 million covered lives. The company now supports over 6.8 million lives across the U.S. This growth solidifies Progyny's leadership in employer-sponsored fertility care and widens its influence in corporate healthcare strategies.
Jul 2025 – Vitrolife AB: Vitrolife launched its AI-powered EmbryoViewer 3.0 across clinics in North America and Asia. The system integrates deep learning to assess embryo viability, reducing selection time by 40% and improving clinical pregnancy rates in pilot sites. This launch reinforces Vitrolife’s leadership in IVF lab technology and supports standardization in embryo evaluation.
Sep 2025 – FUJIFILM Irvine Scientific: FUJIFILM Irvine Scientific opened a new production and R&D facility in Singapore, valued at USD 70 million. The site focuses on media and consumables for ART and cell therapy applications, targeting demand across Southeast Asia. This expansion strengthens FUJIFILM’s supply resilience and positions it closer to emerging growth markets in Asia-Pacific

 Aerospace And Defence
 Agriculture
 Automotive And Transportation
 Banking And Finance
 Business
 Chemicals And Materials
 Consumer And Retail
 Electronics And Semiconductors
 Food And Beverages
 Machinery & Equipments
 Manufacturing And Construction
 Medical Devices
 Others
 Pharmaceuticals And Healthcare
 Power And Energy
 Sports
 Technology

, By End-User (Hospitals, Fertility Clinics), By Patient Type Industry Regions & Key Players – Rising Infertility Trends, Clinical Advancements & Forecast 2025–2034")
, By End-User (Hospitals, Fertility Clinics), By Patient Type Industry Regions & Key Players – Rising Infertility Trends, Clinical Advancements & Forecast 2025–2034")
, By End-User (Hospitals, Fertility Clinics), By Patient Type Industry Regions & Key Players – Rising Infertility Trends, Clinical Advancements & Forecast 2025–2034")
, By End-User (Hospitals, Fertility Clinics), By Patient Type Industry Regions & Key Players – Rising Infertility Trends, Clinical Advancements & Forecast 2025–2034")

