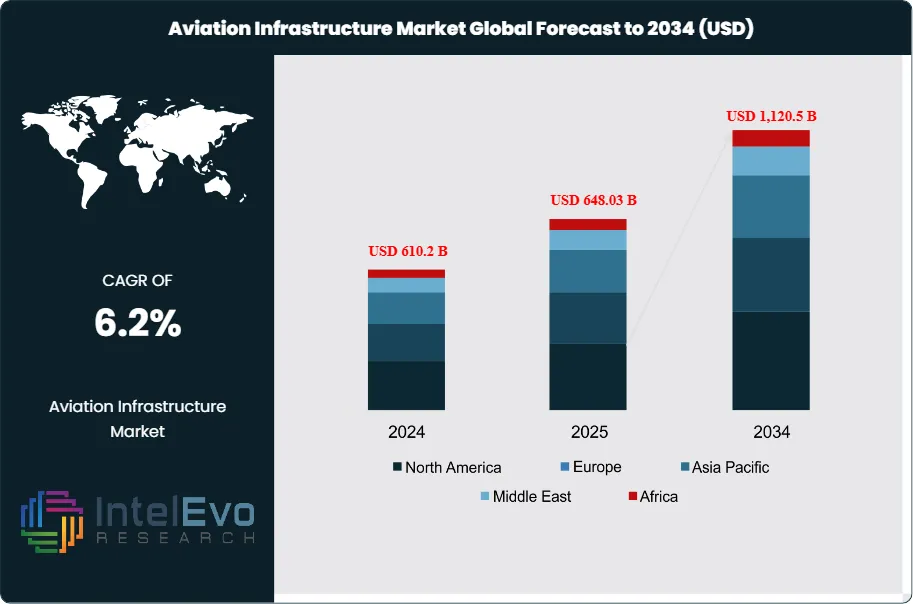
The Aviation Infrastructure Market is projected to reach USD 1,120.5 Billion by 2034, up from USD 610.2 Billion in 2024, growing at a CAGR of 6.2% during the forecast period from 2024 to 2034. The aviation infrastructure market encompasses the development, modernization, and management of physical and digital assets that support air transportation. This includes airports, runways, terminals, air traffic control systems, ground handling facilities, fueling systems, and integrated digital platforms for operations and passenger management. The ecosystem serves commercial airlines, cargo operators, airport authorities, government agencies, and service providers, enabling safe, efficient, and scalable air travel worldwide.
The market is experiencing robust growth driven by rising global air passenger and cargo traffic, the need for airport capacity expansion, and increasing investments in digital transformation and sustainability. Key growth catalysts include the integration of smart technologies such as IoT, AI, and digital twins for real-time monitoring, predictive maintenance, and passenger experience enhancement. The market also benefits from government initiatives to modernize aviation infrastructure, public-private partnerships, and the growing focus on green airports and carbon-neutral operations.
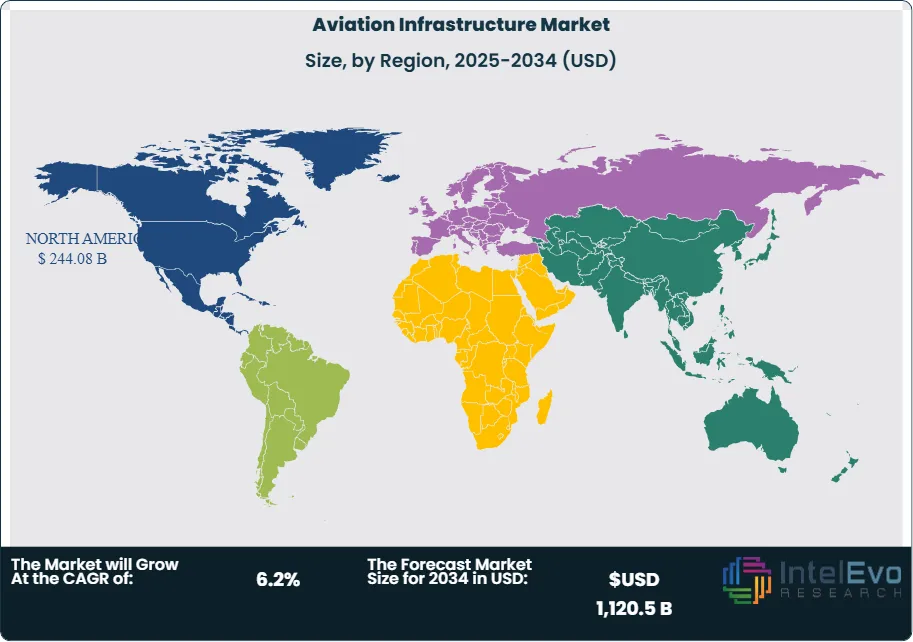
North America maintains its position as the leading regional market for aviation infrastructure, commanding the largest global market share and generating the highest revenues within the sector. This dominance is attributed to early adoption of advanced technologies, a mature aviation ecosystem, and significant capital investments in airport modernization. The United States serves as the primary contributor to North America's market leadership, with substantial revenue generation and strong growth projections. Meanwhile, the Asia-Pacific region emerges as the most rapidly expanding market segment, propelled by rapid urbanization, expanding middle-class populations, and large-scale airport development projects.
The COVID-19 pandemic accelerated digital transformation and automation in aviation infrastructure, as operators sought to ensure operational continuity, passenger safety, and regulatory compliance during periods of reduced travel and heightened health concerns. The crisis highlighted the importance of contactless technologies, remote monitoring, and flexible infrastructure planning. While initial disruptions affected project timelines and funding, the long-term impact has been positive, with increased recognition of digital and resilient infrastructure’s value in supporting recovery and future growth. Rising geopolitical tensions, regulatory changes, and sustainability mandates are influencing investment patterns and technology adoption in the aviation sector. Companies and authorities are prioritizing supply chain resilience, cybersecurity, and compliance with international safety and environmental standards. Additionally, the growing focus on passenger experience, seamless travel, and integrated mobility is driving demand for smart infrastructure solutions that connect air travel with other modes of transportation.
Key Takeaways
Market Growth: The Aviation Infrastructure Market is expected to reach USD 1,120.5 Billion by 2034, fueled by growing air traffic, airport expansion, and digital transformation.
Technology Dominance: Enabling technologies such as IoT, AI, and digital twins lead the segment, due to their foundational role in smart infrastructure and operational optimization.
Component Dominance: Hardware components dominate, driven by the essential role of physical assets (runways, terminals, control towers) and supporting digital systems.
Enterprise Size Dominance: Large enterprises and government authorities lead, primarily due to higher investment capacity and complex operational requirements.
Verticals Dominance: Commercial aviation holds the largest share, owing to broad application scope and high passenger/cargo volumes.
Driver: Key drivers accelerating growth include rising air traffic and the need for capacity expansion, as well as digital transformation for operational efficiency.
Restraint: Growth is hindered by high capital investment requirements and regulatory complexity, which create barriers to new projects and modernization.
Opportunity: The market is poised for expansion due to opportunities like smart airport development, sustainability initiatives, and emerging market penetration.
Trend: Emerging trends including digital twins, contactless technologies, and green airport initiatives are reshaping the market by enabling real-time simulation, seamless travel, and sustainable operations.
Regional Analysis: North America leads owing to early technology adoption and established aviation infrastructure. Asia-Pacific shows high promise due to rapid urbanization and large-scale airport projects.
Technology Analysis
Enabling Technologies: Enabling technologies such as IoT, artificial intelligence, digital twins, and advanced analytics are at the core of the aviation infrastructure market’s transformation. These technologies empower airports and aviation authorities to monitor operations in real time, predict maintenance needs for critical assets, and enhance the passenger experience through automation and data-driven insights. For example, IoT sensors track everything from runway conditions to baggage flows, while AI algorithms optimize scheduling and resource allocation. Digital twins create virtual replicas of airport systems, allowing operators to simulate scenarios and plan upgrades without disrupting actual operations. The ongoing evolution of smart sensors, cloud computing, and integrated digital platforms is accelerating the adoption of these technologies, fostering continuous innovation and enabling airports to operate more efficiently, safely, and sustainably.
Component Analysis:
Hardware Components: Hardware components form the backbone of aviation infrastructure, playing a crucial role in the construction, operation, and modernization of airports and air traffic systems. This category encompasses runways, terminals, air traffic control towers, baggage handling systems, security screening equipment, and digital communication networks. The demand for robust, high-capacity, and technologically advanced physical assets is driven by the need to ensure safe, efficient, and scalable airport and airspace operations. As air traffic volumes grow and passenger expectations rise, investments in durable and innovative hardware are essential for supporting modernization projects, accommodating new aircraft technologies, and maintaining high standards of safety and service.
Enterprise Size Analysis:
Large Enterprises and Government Authorities Lead Adoption: Large enterprises, airport authorities, and government agencies are the primary drivers of growth in the aviation infrastructure market. Their substantial financial resources, regulatory expertise, and operational complexity position them at the forefront of digital transformation and infrastructure modernization. These organizations are responsible for managing large-scale projects, ensuring compliance with international safety and security standards, and delivering seamless passenger experiences. Their leadership is further reinforced by the need to coordinate multi-stakeholder initiatives, invest in cutting-edge technologies, and maintain a competitive edge in a rapidly evolving industry. As a result, large enterprises and government authorities set the pace for innovation and best practices across the sector.
Verticals Analysis:
Commercial Aviation: Commercial aviation is the dominant vertical within the aviation infrastructure market, driven by the sheer volume of passenger and cargo traffic, frequent airport upgrades, and the imperative for efficient, scalable operations. This segment includes major international and regional airports, terminal expansions, runway construction, air traffic management, and advanced passenger processing systems. The prominence of commercial aviation is underpinned by significant investments in modernization, safety enhancements, and passenger experience improvements. As global air travel continues to recover and expand, commercial aviation will remain the primary focus for infrastructure development and technological innovation.
Region Analysis:
North America leads the global aviation infrastructure market, accounting for nearly 40% of total market share. This leadership is supported by a well-developed network of airports, early adoption of smart technologies, and substantial investments in modernization and expansion. The United States, in particular, plays a pivotal role through large-scale airport projects, digital transformation initiatives, and regulatory leadership that shapes industry standards. Asia-Pacific is the fastest-growing region, propelled by rapid urbanization, a burgeoning middle class, and ambitious airport development programs in countries like China, India, and across Southeast Asia. Governments and private investors in the region are accelerating the construction and modernization of aviation infrastructure to meet rising demand. Europe maintains a strong presence with established aviation hubs, stringent safety and environmental standards, and a focus on sustainability. The region’s adoption of smart infrastructure is influenced by regulatory frameworks, cross-border mobility needs, and active participation from leading technology providers, ensuring continued innovation and competitiveness.
Technology (Enabling Technology (IoT, AI, Digital Twins), Operational Technology, Smart Sensors, Cloud Platforms) Component (Hardware (Runways, Terminals, Control Towers), Software (Management Systems, Analytics), Services (Consulting, Maintenance)), Verticals (Commercial Aviation, Cargo & Logistics, General Aviation, Military & Defense) Enterprise Size (Large Enterprises & Government Authorities, Small and Medium Enterprises)
Research Methodology
Primary Research- 100 Interviews of Stakeholders
Secondary Research
Desk Research
Regional scope
North America (United States, Canada, Mexico)
Latin America (Brazil, Argentina, Columbia)
East Asia And Pacific (China, Japan, South Korea, Australia, Cambodia, Fiji, Indonesia)
Sea And South Asia (India, Singapore, Thailand, Taiwan, Malaysia)
Eastern Europe (Poland, Russia, Czech Republic, Romania)
Western Europe (Germany, U.K., France, Spain, Itlay)
Middle East & Africa (GCC Countries, Egypt, Nigeria, South Africa, Israel)
Competitive Landscape
AECOM, Honeywell International Inc., Siemens AG, Vinci Airports, Ferrovial, GMR Airports, Changi Airports International, Jacobs Engineering Group, SITA, Amadeus IT Group, TAV Airports, Fraport AG, Beijing Capital International Airport Co.
Customization Scope
Customization for segments, region/country-level will be provided. Moreover, additional customization can be done based on the requirements.
Pricing and Purchase Options
Avail customized purchase options to meet your exact research needs. We have three licenses to opt for: Single User License, Multi-User License (Up to 5 Users), Corporate Use License (Unlimited User and Printable PDF).
TABLE OF CONTENTS
1. EXECUTIVE SUMMARY
1.1. MARKET SNAPSHOT
1.2. KEY FINDINGS & INSIGHTS
1.3. ANALYST RECOMMENDATIONS
1.4. FUTURE OUTLOOK
2. RESEARCH METHODOLOGY
2.1. MARKET DEFINITION & SCOPE
2.2. RESEARCH OBJECTIVES: PRIMARY & SECONDARY DATA SOURCES
2.3. DATA COLLECTION SOURCES
2.3.1. COVERAGE OF 100+ PRIMARY RESEARCH/CONSULTATION CALLS WITH INDUSTRY STAKEHOLDERS
FIGURE 17 NORTH AMERICA AVIATION INFRASTRUCTURE CURRENT AND FUTURE TYPE ANALYSIS, 2025–2034, (USD MILLION)
FIGURE 18 NORTH AMERICA AVIATION INFRASTRUCTURE CURRENT AND FUTURE END USER ANALYSIS, 2025–2034, (USD MILLION)
FIGURE 19 MARKET SHARE BY COUNTRY
FIGURE 20 LATIN AMERICA AVIATION INFRASTRUCTURE CURRENT AND FUTURE TYPE ANALYSIS, 2025–2034, (USD MILLION)
FIGURE 21 LATIN AMERICA AVIATION INFRASTRUCTURE CURRENT AND FUTURE END USER ANALYSIS, 2025–2034, (USD MILLION)
FIGURE 22 MARKET SHARE BY COUNTRY
FIGURE 23 EASTERN EUROPE AVIATION INFRASTRUCTURE CURRENT AND FUTURE TYPE ANALYSIS, 2025–2034, (USD MILLION)
FIGURE 24 EASTERN EUROPE AVIATION INFRASTRUCTURE CURRENT AND FUTURE END USER ANALYSIS, 2025–2034, (USD MILLION)
FIGURE 25 MARKET SHARE BY COUNTRY
FIGURE 26 WESTERN EUROPE AVIATION INFRASTRUCTURE CURRENT AND FUTURE TYPE ANALYSIS, 2025–2034, (USD MILLION)
FIGURE 27 WESTERN EUROPE AVIATION INFRASTRUCTURE CURRENT AND FUTURE END USER ANALYSIS, 2025–2034, (USD MILLION)
FIGURE 28 MARKET SHARE BY COUNTRY
FIGURE 29 EAST ASIA AND PACIFIC AVIATION INFRASTRUCTURE CURRENT AND FUTURE TYPE ANALYSIS, 2025–2034, (USD MILLION)
FIGURE 30 EAST ASIA AND PACIFIC AVIATION INFRASTRUCTURE CURRENT AND FUTURE END USER ANALYSIS, 2025–2034, (USD MILLION)
FIGURE 31 MARKET SHARE BY COUNTRY
FIGURE 32 SEA AND SOUTH ASIA AVIATION INFRASTRUCTURE CURRENT AND FUTURE TYPE ANALYSIS, 2025–2034, (USD MILLION)
FIGURE 33 SEA AND SOUTH ASIA AVIATION INFRASTRUCTURE CURRENT AND FUTURE END USER ANALYSIS, 2025–2034, (USD MILLION)
FIGURE 34 MARKET SHARE BY COUNTRY
FIGURE 35 MIDDLE EAST AND AFRICA AVIATION INFRASTRUCTURE CURRENT AND FUTURE TYPE ANALYSIS, 2025–2034, (USD MILLION)
FIGURE 36 MIDDLE EAST AND AFRICA AVIATION INFRASTRUCTURE CURRENT AND FUTURE END USER ANALYSIS, 2025–2034, (USD MILLION)
FIGURE 37 NORTH AMERICA AVIATION INFRASTRUCTURE CURRENT AND FUTURE MARKET VOLUME SHARE REGIONAL ANALYSIS, 2025–2034, (USD MILLION)
FIGURE 38 U.S. AVIATION INFRASTRUCTURE CURRENT AND FUTURE TYPE ANALYSIS, 2025–2034, (USD MILLION)
FIGURE 39 U.S. AVIATION INFRASTRUCTURE CURRENT AND FUTURE END USER ANALYSIS, 2025–2034, (USD MILLION)
FIGURE 40 CANADA AVIATION INFRASTRUCTURE CURRENT AND FUTURE TYPE ANALYSIS, 2025–2034, (USD MILLION)
FIGURE 41 CANADA AVIATION INFRASTRUCTURE CURRENT AND FUTURE END USER ANALYSIS, 2025–2034, (USD MILLION)
FIGURE 42 LATIN AMERICA AVIATION INFRASTRUCTURE CURRENT AND FUTURE MARKET VOLUME SHARE REGIONAL ANALYSIS, 2025–2034, (USD MILLION)
FIGURE 43 MEXICO AVIATION INFRASTRUCTURE CURRENT AND FUTURE TYPE ANALYSIS, 2025–2034, (USD MILLION)
FIGURE 44 MEXICO AVIATION INFRASTRUCTURE CURRENT AND FUTURE END USER ANALYSIS, 2025–2034, (USD MILLION)
FIGURE 45 BRAZIL AVIATION INFRASTRUCTURE CURRENT AND FUTURE TYPE ANALYSIS, 2025–2034, (USD MILLION)
FIGURE 46 BRAZIL AVIATION INFRASTRUCTURE CURRENT AND FUTURE END USER ANALYSIS, 2025–2034, (USD MILLION)
FIGURE 47 ARGENTINA AVIATION INFRASTRUCTURE CURRENT AND FUTURE TYPE ANALYSIS, 2025–2034, (USD MILLION)
FIGURE 48 ARGENTINA AVIATION INFRASTRUCTURE CURRENT AND FUTURE END USER ANALYSIS, 2025–2034, (USD MILLION)
FIGURE 49 COLUMBIA AVIATION INFRASTRUCTURE CURRENT AND FUTURE TYPE ANALYSIS, 2025–2034, (USD MILLION)
FIGURE 50 COLUMBIA AVIATION INFRASTRUCTURE CURRENT AND FUTURE END USER ANALYSIS, 2025–2034, (USD MILLION)
FIGURE 51 REST OF LATIN AMERICA AVIATION INFRASTRUCTURE CURRENT AND FUTURE TYPE ANALYSIS, 2025–2034, (USD MILLION)
FIGURE 52 REST OF LATIN AMERICA AVIATION INFRASTRUCTURE CURRENT AND FUTURE END USER ANALYSIS, 2025–2034, (USD MILLION)
FIGURE 53 EASTERN EUROPE AVIATION INFRASTRUCTURE CURRENT AND FUTURE MARKET VOLUME SHARE REGIONAL ANALYSIS, 2025–2034, (USD MILLION)
FIGURE 54 POLAND AVIATION INFRASTRUCTURE CURRENT AND FUTURE TYPE ANALYSIS, 2025–2034, (USD MILLION)
FIGURE 55 POLAND AVIATION INFRASTRUCTURE CURRENT AND FUTURE END USER ANALYSIS, 2025–2034, (USD MILLION)
FIGURE 56 RUSSIA AVIATION INFRASTRUCTURE CURRENT AND FUTURE TYPE ANALYSIS, 2025–2034, (USD MILLION)
FIGURE 57 RUSSIA AVIATION INFRASTRUCTURE CURRENT AND FUTURE END USER ANALYSIS, 2025–2034, (USD MILLION)
FIGURE 58 CZECH REPUBLIC AVIATION INFRASTRUCTURE CURRENT AND FUTURE TYPE ANALYSIS, 2025–2034, (USD MILLION)
FIGURE 59 CZECH REPUBLIC AVIATION INFRASTRUCTURE CURRENT AND FUTURE END USER ANALYSIS, 2025–2034, (USD MILLION)
FIGURE 60 ROMANIA AVIATION INFRASTRUCTURE CURRENT AND FUTURE TYPE ANALYSIS, 2025–2034, (USD MILLION)
FIGURE 61 ROMANIA AVIATION INFRASTRUCTURE CURRENT AND FUTURE END USER ANALYSIS, 2025–2034, (USD MILLION)
FIGURE 62 REST OF EASTERN EUROPE AVIATION INFRASTRUCTURE CURRENT AND FUTURE TYPE ANALYSIS, 2025–2034, (USD MILLION)
FIGURE 63 REST OF EASTERN EUROPE AVIATION INFRASTRUCTURE CURRENT AND FUTURE END USER ANALYSIS, 2025–2034, (USD MILLION)
FIGURE 64 WESTERN EUROPE AVIATION INFRASTRUCTURE CURRENT AND FUTURE MARKET VOLUME SHARE REGIONAL ANALYSIS, 2025–2034, (USD MILLION)
FIGURE 65 GERMANY AVIATION INFRASTRUCTURE CURRENT AND FUTURE TYPE ANALYSIS, 2025–2034, (USD MILLION)
FIGURE 66 GERMANY AVIATION INFRASTRUCTURE CURRENT AND FUTURE END USER ANALYSIS, 2025–2034, (USD MILLION)
FIGURE 67 FRANCE AVIATION INFRASTRUCTURE CURRENT AND FUTURE TYPE ANALYSIS, 2025–2034, (USD MILLION)
FIGURE 68 FRANCE AVIATION INFRASTRUCTURE CURRENT AND FUTURE END USER ANALYSIS, 2025–2034, (USD MILLION)
FIGURE 69 UK AVIATION INFRASTRUCTURE CURRENT AND FUTURE TYPE ANALYSIS, 2025–2034, (USD MILLION)
FIGURE 70 UK AVIATION INFRASTRUCTURE CURRENT AND FUTURE END USER ANALYSIS, 2025–2034, (USD MILLION)
FIGURE 71 SPAIN AVIATION INFRASTRUCTURE CURRENT AND FUTURE TYPE ANALYSIS, 2025–2034, (USD MILLION)
FIGURE 72 SPAIN AVIATION INFRASTRUCTURE CURRENT AND FUTURE END USER ANALYSIS, 2025–2034, (USD MILLION)
FIGURE 73 ITALY AVIATION INFRASTRUCTURE CURRENT AND FUTURE TYPE ANALYSIS, 2025–2034, (USD MILLION)
FIGURE 74 ITALY AVIATION INFRASTRUCTURE CURRENT AND FUTURE END USER ANALYSIS, 2025–2034, (USD MILLION)
FIGURE 75 REST OF WESTERN EUROPE AVIATION INFRASTRUCTURE CURRENT AND FUTURE TYPE ANALYSIS, 2025–2034, (USD MILLION)
FIGURE 76 REST OF WESTERN EUROPE AVIATION INFRASTRUCTURE CURRENT AND FUTURE END USER ANALYSIS, 2025–2034, (USD MILLION)
FIGURE 77 EAST ASIA AND PACIFIC AVIATION INFRASTRUCTURE CURRENT AND FUTURE MARKET VOLUME SHARE REGIONAL ANALYSIS, 2025–2034, (USD MILLION)
FIGURE 78 CHINA AVIATION INFRASTRUCTURE CURRENT AND FUTURE TYPE ANALYSIS, 2025–2034, (USD MILLION)
FIGURE 79 CHINA AVIATION INFRASTRUCTURE CURRENT AND FUTURE END USER ANALYSIS, 2025–2034, (USD MILLION)
FIGURE 80 JAPAN AVIATION INFRASTRUCTURE CURRENT AND FUTURE TYPE ANALYSIS, 2025–2034, (USD MILLION)
FIGURE 81 JAPAN AVIATION INFRASTRUCTURE CURRENT AND FUTURE END USER ANALYSIS, 2025–2034, (USD MILLION)
FIGURE 82 AUSTRALIA AVIATION INFRASTRUCTURE CURRENT AND FUTURE TYPE ANALYSIS, 2025–2034, (USD MILLION)
FIGURE 83 AUSTRALIA AVIATION INFRASTRUCTURE CURRENT AND FUTURE END USER ANALYSIS, 2025–2034, (USD MILLION)
FIGURE 84 CAMBODIA AVIATION INFRASTRUCTURE CURRENT AND FUTURE TYPE ANALYSIS, 2025–2034, (USD MILLION)
FIGURE 85 CAMBODIA AVIATION INFRASTRUCTURE CURRENT AND FUTURE END USER ANALYSIS, 2025–2034, (USD MILLION)
FIGURE 86 FIJI AVIATION INFRASTRUCTURE CURRENT AND FUTURE TYPE ANALYSIS, 2025–2034, (USD MILLION)
FIGURE 87 FIJI AVIATION INFRASTRUCTURE CURRENT AND FUTURE END USER ANALYSIS, 2025–2034, (USD MILLION)
FIGURE 88 INDONESIA AVIATION INFRASTRUCTURE CURRENT AND FUTURE TYPE ANALYSIS, 2025–2034, (USD MILLION)
FIGURE 89 INDONESIA AVIATION INFRASTRUCTURE CURRENT AND FUTURE END USER ANALYSIS, 2025–2034, (USD MILLION)
FIGURE 90 SOUTH KOREA AVIATION INFRASTRUCTURE CURRENT AND FUTURE TYPE ANALYSIS, 2025–2034, (USD MILLION)
FIGURE 91 SOUTH KOREA AVIATION INFRASTRUCTURE CURRENT AND FUTURE END USER ANALYSIS, 2025–2034, (USD MILLION)
FIGURE 92 REST OF EAST ASIA AND PACIFIC AVIATION INFRASTRUCTURE CURRENT AND FUTURE TYPE ANALYSIS, 2025–2034, (USD MILLION)
FIGURE 93 REST OF EAST ASIA AND PACIFIC AVIATION INFRASTRUCTURE CURRENT AND FUTURE END USER ANALYSIS, 2025–2034, (USD MILLION)
FIGURE 94 SEA AND SOUTH ASIA AVIATION INFRASTRUCTURE CURRENT AND FUTURE MARKET VOLUME SHARE REGIONAL ANALYSIS, 2025–2034, (USD MILLION)
FIGURE 95 BANGLADESH AVIATION INFRASTRUCTURE CURRENT AND FUTURE TYPE ANALYSIS, 2025–2034, (USD MILLION)
FIGURE 96 BANGLADESH AVIATION INFRASTRUCTURE CURRENT AND FUTURE END USER ANALYSIS, 2025–2034, (USD MILLION)
FIGURE 97 NEW ZEALAND AVIATION INFRASTRUCTURE CURRENT AND FUTURE TYPE ANALYSIS, 2025–2034, (USD MILLION)
FIGURE 98 NEW ZEALAND AVIATION INFRASTRUCTURE CURRENT AND FUTURE END USER ANALYSIS, 2025–2034, (USD MILLION)
FIGURE 99 INDIA AVIATION INFRASTRUCTURE CURRENT AND FUTURE TYPE ANALYSIS, 2025–2034, (USD MILLION)
FIGURE 100 INDIA AVIATION INFRASTRUCTURE CURRENT AND FUTURE END USER ANALYSIS, 2025–2034, (USD MILLION)
FIGURE 101 SINGAPORE AVIATION INFRASTRUCTURE CURRENT AND FUTURE TYPE ANALYSIS, 2025–2034, (USD MILLION)
FIGURE 102 SINGAPORE AVIATION INFRASTRUCTURE CURRENT AND FUTURE END USER ANALYSIS, 2025–2034, (USD MILLION)
FIGURE 103 THAILAND AVIATION INFRASTRUCTURE CURRENT AND FUTURE TYPE ANALYSIS, 2025–2034, (USD MILLION)
FIGURE 104 THAILAND AVIATION INFRASTRUCTURE CURRENT AND FUTURE END USER ANALYSIS, 2025–2034, (USD MILLION)
FIGURE 105 TAIWAN AVIATION INFRASTRUCTURE CURRENT AND FUTURE TYPE ANALYSIS, 2025–2034, (USD MILLION)
FIGURE 106 TAIWAN AVIATION INFRASTRUCTURE CURRENT AND FUTURE END USER ANALYSIS, 2025–2034, (USD MILLION)
FIGURE 107 MALAYSIA AVIATION INFRASTRUCTURE CURRENT AND FUTURE TYPE ANALYSIS, 2025–2034, (USD MILLION)
FIGURE 108 MALAYSIA AVIATION INFRASTRUCTURE CURRENT AND FUTURE END USER ANALYSIS, 2025–2034, (USD MILLION)
FIGURE 109 REST OF SEA AND SOUTH ASIA AVIATION INFRASTRUCTURE CURRENT AND FUTURE TYPE ANALYSIS, 2025–2034, (USD MILLION)
FIGURE 110 REST OF SEA AND SOUTH ASIA AVIATION INFRASTRUCTURE CURRENT AND FUTURE END USER ANALYSIS, 2025–2034, (USD MILLION)
FIGURE 111 MIDDLE EAST AND AFRICA AVIATION INFRASTRUCTURE CURRENT AND FUTURE MARKET VOLUME SHARE REGIONAL ANALYSIS, 2025–2034, (USD MILLION)
FIGURE 112 GCC COUNTRIES AVIATION INFRASTRUCTURE CURRENT AND FUTURE TYPE ANALYSIS, 2025–2034, (USD MILLION)
FIGURE 113 GCC COUNTRIES AVIATION INFRASTRUCTURE CURRENT AND FUTURE END USER ANALYSIS, 2025–2034, (USD MILLION)
FIGURE 114 SAUDI ARABIA AVIATION INFRASTRUCTURE CURRENT AND FUTURE TYPE ANALYSIS, 2025–2034, (USD MILLION)
FIGURE 115 SAUDI ARABIA AVIATION INFRASTRUCTURE CURRENT AND FUTURE END USER ANALYSIS, 2025–2034, (USD MILLION)
FIGURE 116 UAE AVIATION INFRASTRUCTURE CURRENT AND FUTURE TYPE ANALYSIS, 2025–2034, (USD MILLION)
FIGURE 117 UAE AVIATION INFRASTRUCTURE CURRENT AND FUTURE END USER ANALYSIS, 2025–2034, (USD MILLION)
FIGURE 118 BAHRAIN AVIATION INFRASTRUCTURE CURRENT AND FUTURE TYPE ANALYSIS, 2025–2034, (USD MILLION)
FIGURE 119 BAHRAIN AVIATION INFRASTRUCTURE CURRENT AND FUTURE END USER ANALYSIS, 2025–2034, (USD MILLION)
FIGURE 120 KUWAIT AVIATION INFRASTRUCTURE CURRENT AND FUTURE TYPE ANALYSIS, 2025–2034, (USD MILLION)
FIGURE 121 KUWAIT AVIATION INFRASTRUCTURE CURRENT AND FUTURE END USER ANALYSIS, 2025–2034, (USD MILLION)
FIGURE 122 OMAN AVIATION INFRASTRUCTURE CURRENT AND FUTURE TYPE ANALYSIS, 2025–2034, (USD MILLION)
FIGURE 123 OMAN AVIATION INFRASTRUCTURE CURRENT AND FUTURE END USER ANALYSIS, 2025–2034, (USD MILLION)
FIGURE 124 QATAR AVIATION INFRASTRUCTURE CURRENT AND FUTURE TYPE ANALYSIS, 2025–2034, (USD MILLION)
FIGURE 125 QATAR AVIATION INFRASTRUCTURE CURRENT AND FUTURE END USER ANALYSIS, 2025–2034, (USD MILLION)
FIGURE 126 EGYPT AVIATION INFRASTRUCTURE CURRENT AND FUTURE TYPE ANALYSIS, 2025–2034, (USD MILLION)
FIGURE 127 EGYPT AVIATION INFRASTRUCTURE CURRENT AND FUTURE END USER ANALYSIS, 2025–2034, (USD MILLION)
FIGURE 128 NIGERIA AVIATION INFRASTRUCTURE CURRENT AND FUTURE TYPE ANALYSIS, 2025–2034, (USD MILLION)
FIGURE 129 NIGERIA AVIATION INFRASTRUCTURE CURRENT AND FUTURE END USER ANALYSIS, 2025–2034, (USD MILLION)
FIGURE 130 SOUTH AFRICA AVIATION INFRASTRUCTURE CURRENT AND FUTURE TYPE ANALYSIS, 2025–2034, (USD MILLION)
FIGURE 131 SOUTH AFRICA AVIATION INFRASTRUCTURE CURRENT AND FUTURE END USER ANALYSIS, 2025–2034, (USD MILLION)
FIGURE 132 ISRAEL AVIATION INFRASTRUCTURE CURRENT AND FUTURE TYPE ANALYSIS, 2025–2034, (USD MILLION)
FIGURE 133 ISRAEL AVIATION INFRASTRUCTURE CURRENT AND FUTURE END USER ANALYSIS, 2025–2034, (USD MILLION)
FIGURE 134 REST OF MEA AVIATION INFRASTRUCTURE CURRENT AND FUTURE TYPE ANALYSIS, 2025–2034, (USD MILLION)
FIGURE 135 REST OF MEA AVIATION INFRASTRUCTURE CURRENT AND FUTURE END USER ANALYSIS, 2025–2034, (USD MILLION)
FIGURE 136 U. S. MARKET SHARE ANALYSIS BY TYPE (2024)
FIGURE 137 U. S. MARKET SHARE ANALYSIS BY END USER (2024)
FIGURE 138 CANADA MARKET SHARE ANALYSIS BY TYPE (2024)
FIGURE 139 CANADA MARKET SHARE ANALYSIS BY END USER (2024)
FIGURE 140 MEXICO MARKET SHARE ANALYSIS BY TYPE (2024)
FIGURE 141 MEXICO MARKET SHARE ANALYSIS BY END USER (2024)
FIGURE 142 CHINA MARKET SHARE ANALYSIS BY TYPE (2024)
FIGURE 143 CHINA MARKET SHARE ANALYSIS BY END USER (2024)
FIGURE 144 JAPAN MARKET SHARE ANALYSIS BY TYPE (2024)
FIGURE 145 JAPAN MARKET SHARE ANALYSIS BY END USER (2024)
FIGURE 146 INDIA MARKET SHARE ANALYSIS BY TYPE (2024)
FIGURE 147 INDIA MARKET SHARE ANALYSIS BY END USER (2024)
FIGURE 148 SOUTH KOREA MARKET SHARE ANALYSIS BY TYPE (2024)
FIGURE 149 SOUTH KOREA MARKET SHARE ANALYSIS BY END USER (2024)
FIGURE 150 SAUDI ARABIA MARKET SHARE ANALYSIS BY TYPE (2024)
FIGURE 151 SAUDI ARABIA MARKET SHARE ANALYSIS BY END USER (2024)
FIGURE 152 UAE MARKET SHARE ANALYSIS BY TYPE (2024)
FIGURE 153 UAE MARKET SHARE ANALYSIS BY END USER (2024)
FIGURE 154 EGYPT MARKET SHARE ANALYSIS BY TYPE (2024)
FIGURE 155 EGYPT MARKET SHARE ANALYSIS BY END USER (2024)
FIGURE 156 NIGERIA MARKET SHARE ANALYSIS BY TYPE (2024)
FIGURE 157 NIGERIA MARKET SHARE ANALYSIS BY END USER (2024)
FIGURE 158 SOUTH AFRICA MARKET SHARE ANALYSIS BY TYPE (2024)
FIGURE 159 SOUTH AFRICA MARKET SHARE ANALYSIS BY END USER (2024)
FIGURE 160 GERMANY MARKET SHARE ANALYSIS BY TYPE (2024)
FIGURE 161 GERMANY MARKET SHARE ANALYSIS BY END USER (2024)
FIGURE 162 FRANCE MARKET SHARE ANALYSIS BY TYPE (2024)
FIGURE 163 FRANCE MARKET SHARE ANALYSIS BY END USER (2024)
FIGURE 164 UK MARKET SHARE ANALYSIS BY TYPE (2024)
FIGURE 165 UK MARKET SHARE ANALYSIS BY END USER (2024)
FIGURE 166 SPAIN MARKET SHARE ANALYSIS BY TYPE (2024)
FIGURE 167 SPAIN MARKET SHARE ANALYSIS BY END USER (2024)
FIGURE 168 ITALY MARKET SHARE ANALYSIS BY TYPE (2024)
FIGURE 169 ITALY MARKET SHARE ANALYSIS BY END USER (2024)
FIGURE 170 BRAZIL MARKET SHARE ANALYSIS BY TYPE (2024)
FIGURE 171 BRAZIL MARKET SHARE ANALYSIS BY END USER (2024)
FIGURE 172 ARGENTINA MARKET SHARE ANALYSIS BY TYPE (2024)
FIGURE 173 ARGENTINA MARKET SHARE ANALYSIS BY END USER (2024)
FIGURE 174 COLUMBIA MARKET SHARE ANALYSIS BY TYPE (2024)
FIGURE 175 COLUMBIA MARKET SHARE ANALYSIS BY END USER (2024)
FIGURE 176 GLOBAL AVIATION INFRASTRUCTURE CURRENT AND FUTURE MARKET KEY COUNTRY LEVEL ANALYSIS, 2024–2034, (USD MILLION)
FIGURE 177 FINANCIAL OVERVIEW:
Key Players Analysis
AECOM: AECOM stands as a global powerhouse in aviation infrastructure design and project management, renowned for its comprehensive expertise in airport planning, engineering, and sustainable development. The company’s integrated approach combines master planning, architectural design, engineering, and construction management, allowing it to deliver end-to-end solutions for some of the world’s most complex and high-profile airport projects.
Honeywell International Inc.: Honeywell is a leading provider of advanced automation, safety, and digital solutions for airports and air traffic management systems worldwide. The company’s portfolio includes integrated platforms for building management, airside operations, security, and passenger processing, all designed to enhance operational efficiency and the overall passenger experience. Honeywell’s competitive strength lies in its focus on smart technologies such as IoT-enabled sensors, AI-driven analytics, and robust cybersecurity frameworks that protect critical airport infrastructure.
Siemens AG: Siemens AG is a major force in the aviation infrastructure sector, specializing in airport automation, energy management, and digital infrastructure solutions. The company leverages its deep expertise in IoT, digital twins, and smart building technologies to create scalable, future-ready environments for airports around the globe. Siemens’ solutions enable real-time monitoring, predictive maintenance, and efficient energy use, supporting both operational excellence and sustainability goals.
Vinci Airports: Vinci Airports is a leading global airport operator and developer, managing a diverse portfolio of airports across Europe, the Americas, Asia, and Africa. The company is recognized for its operational expertise, commitment to modernization, and focus on sustainability and passenger service innovation. Vinci Airports invests heavily in upgrading airport infrastructure, implementing green initiatives such as renewable energy projects and carbon-neutral terminals, and enhancing passenger amenities.
Market Key Players
AECOM
Honeywell International Inc.
Siemens AG
Vinci Airports
Ferrovial
GMR Airports
Changi Airports International
Jacobs Engineering Group
SITA
Amadeus IT Group
TAV Airports
Fraport AG
Beijing Capital International Airport Co.
Driver:
Rising Air Traffic and Capacity Expansion
The relentless growth in global air passenger and cargo traffic is a fundamental driver of investment in aviation infrastructure. As more people and goods take to the skies, airports and air navigation service providers are under pressure to expand capacity by constructing new terminals, runways, and upgrading air traffic management systems. This expansion is not just about accommodating higher volumes; it is also about reducing congestion, minimizing delays, and improving the overall efficiency of air travel. Enhanced connectivity through expanded infrastructure supports economic growth by facilitating tourism, trade, and business, making it a top priority for governments and private investors worldwide.
Digital Transformation and Operational Efficiency
Digital transformation is revolutionizing the management and operation of aviation infrastructure. The integration of smart technologies—such as IoT, AI, and advanced analytics—enables real-time monitoring of airport operations, predictive maintenance of critical assets, and data-driven decision-making. These advancements lead to improved safety, reduced downtime, and optimized resource utilization. The adoption of integrated digital platforms and automation is helping operators meet the rising expectations of passengers for seamless, efficient, and resilient air travel, while also enabling airports to adapt quickly to changing operational demands and regulatory requirements.
Restraints:
High Capital Investment and Regulatory Complexity
Aviation infrastructure projects require substantial upfront investment, which can be a significant barrier, especially for smaller operators and those in emerging markets. The costs encompass land acquisition, construction, integration of advanced technologies, and ongoing maintenance. Furthermore, the sector is subject to complex regulatory requirements related to safety, security, and environmental compliance. Navigating these regulations can delay project timelines, increase operational costs, and add layers of administrative complexity, making it challenging for new entrants and slowing the pace of modernization.
Geopolitical and Supply Chain Risks
The aviation infrastructure sector is increasingly exposed to geopolitical tensions, trade restrictions, and supply chain disruptions. Many projects depend on global suppliers for critical equipment and technology, making them vulnerable to delays and cost overruns when international relations sour or logistics are interrupted. Ensuring supply chain resilience and compliance with international standards is essential for the successful delivery and long-term sustainability of infrastructure projects. These risks require careful management and contingency planning, adding another layer of complexity to project execution.
Opportunities:
Smart Airport Development and Sustainability Initiatives
The push toward smart airport development presents significant opportunities for the aviation infrastructure market. By integrating IoT, AI, and digital platforms, airports can achieve real-time monitoring, automated passenger processing, and energy-efficient operations. Sustainability is also a growing focus, with airports investing in renewable energy sources, green building materials, and carbon-neutral operations to meet both regulatory requirements and societal expectations. These initiatives not only enhance operational efficiency and passenger experience but also position airports as leaders in environmental stewardship and innovation.
Emerging Market Penetration and Global Expansion
Emerging markets in Asia-Pacific, Latin America, and Africa are poised for rapid growth in aviation infrastructure, driven by urbanization, rising air travel demand, and increased government investment. These regions offer substantial opportunities for market penetration through public-private partnerships, technology transfer, and solutions tailored to local needs. The expansion potential is further enhanced by lower competition, supportive government policies, and a growing recognition of aviation’s critical role in economic development. Companies that can adapt their offerings to these dynamic markets stand to gain significant competitive advantages.
Trends:
Digital Twins and Virtual Process Modeling
Digital twin technology is gaining traction in aviation infrastructure, allowing operators to create virtual replicas of airports, runways, and critical systems. These digital twins enable real-time simulation, scenario planning, and predictive maintenance, which improve decision-making and operational resilience. Major airports are already implementing digital twins for asset management and passenger flow optimization, resulting in more efficient operations and better preparedness for disruptions or emergencies.
Contactless Technologies and Green Airport Initiatives
The adoption of contactless technologies—such as biometric screening, touchless check-in, and automated baggage handling—is transforming the passenger experience by enhancing safety, reducing wait times, and minimizing physical contact. At the same time, green airport initiatives are gaining momentum, with airports investing in renewable energy, waste reduction, and sustainable design to meet environmental targets and improve operational efficiency. These trends reflect a broader industry shift toward innovation, sustainability, and a more seamless, customer-centric travel experience.
Recent Development
In June 2025: AECOM successfully completed the design and project management for a cutting-edge smart terminal at a major European airport. This project stands out for its integration of digital twin technology, which allows airport operators to create a virtual replica of the terminal for real-time simulation, predictive maintenance, and operational optimization. The terminal also features advanced energy-efficient systems, supporting the airport’s sustainability goals and reducing its environmental footprint.
In May 2025: Honeywell launched an innovative AI-powered airside operations platform designed to transform airport ground operations. This platform leverages artificial intelligence to enable real-time monitoring of ground activities, from aircraft movements to equipment status, and provides predictive maintenance capabilities that help prevent operational disruptions. By automating data collection and analysis, the platform enhances safety, reduces downtime, and optimizes resource allocation.
In April 2025: Siemens announced a strategic partnership with a leading Asian airport to deploy IoT-enabled building management systems. These advanced systems are designed to optimize energy consumption, enhance passenger comfort, and streamline facility operations through real-time data collection and intelligent automation. By integrating IoT sensors and analytics, Siemens’ solution enables the airport to monitor and control lighting, HVAC, and other critical systems more efficiently.
In March 2025: Vinci Airports unveiled a significant investment in green airport infrastructure, focusing on the installation of solar power systems and the upgrade of terminals to achieve carbon-neutral status. This initiative is part of Vinci’s broader commitment to sustainability and environmental stewardship, aiming to reduce the carbon footprint of its global airport network.
In February 2025: SITA introduced a new biometric-enabled, contactless passenger journey solution that streamlines the entire airport experience—from check-in and security to boarding. This solution uses facial recognition and other biometric technologies to automate identity verification, reducing wait times and minimizing physical contact.