Global Avocado Oil Market Size, Share & Analysis By Type (Extra Virgin Avocado Oil, Virgin Avocado Oil, Refined Avocado Oil, Crude Avocado Oil, Organic Avocado Oil, Cold-Pressed Avocado Oil), By Application (Food & Beverages, Cosmetics & Personal Care, Pharmaceuticals, Nutraceuticals, Industrial Uses), By Distribution Channel, By Source, By End-User, By Extraction Method, Industry Regions & Key Players – Health & Wellness Trends & Forecast 2025–2034
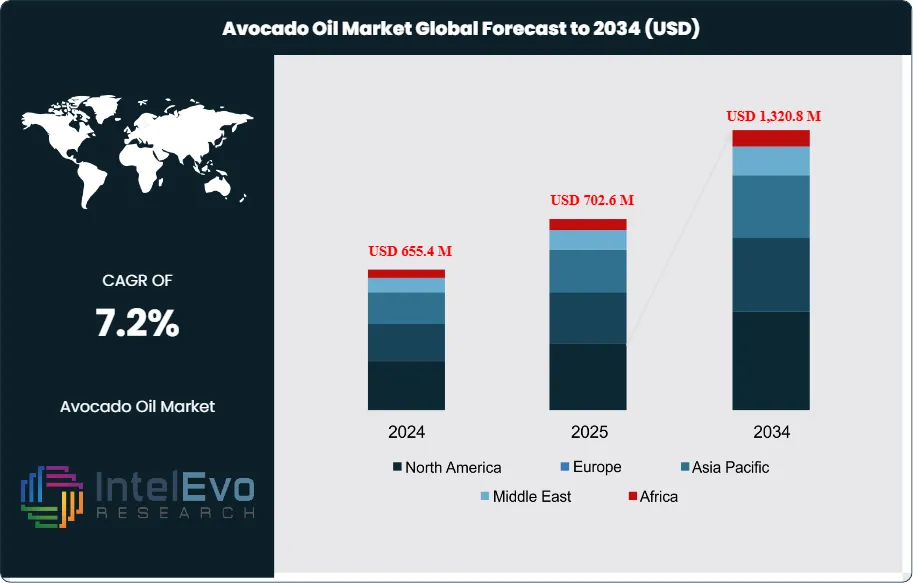
The Avocado Oil Market is valued at approximately USD 655.4 million in 2024 and is projected to reach nearly USD 1,320.8 million by 2034, expanding at a steady CAGR of about 7.2% from 2025–2034. Demand is being driven by rising consumer preference for clean-label, nutrient-rich cooking oils and the increasing use of avocado oil in skincare, nutraceuticals, and premium food segments. Its high smoke point, antioxidant profile, and heart-health benefits continue to attract both health-conscious households and gourmet culinary brands. With social media wellness trends, expanding retail penetration, and the growing popularity of natural beauty oils, the avocado oil market is rapidly trending across food, cosmetic, and functional wellness industries.
You are looking at a category that has shifted from niche to mainstream. Retail shelves and foodservice now carry more cold-pressed and refined lines, while personal care brands add avocado oil into skin and hair formulations. The market tracks the broader avocado supply chain; availability of fruit sets the ceiling for oil output. Trade flows remain supportive. In 2023, global trade in major tropical fruits, including avocados, reached USD 11.2 billion, up 12 percent year over year. Mexico strengthened its position with a 20 percent rise in avocado exports to about 3.0 million metric tons, anchored by resilient U.S. demand. U.S. avocado imports grew at roughly 8 percent per year between 2012 and 2022. In Europe, the Netherlands and Spain expanded import volumes at 14 percent and 20 percent annually, building distribution hubs that matter for oil processors. The Philippines recorded USD 17.11 million in exports to the United States, signaling new routes for buyers to watch.
Health and wellness trends drive demand. Avocado oil’s high share of monounsaturated fats and vitamins underpins premium positioning in cooking oils and cosmetics. Supply-side momentum comes from more efficient extraction and better fruit grading. Producers report yield gains of 2 to 4 percentage points as plants adopt mechanical cold pressing and solvent-free processes. Automation in bottling reduces wastage and improves batch consistency. AI tools support harvest forecasting and line monitoring. Blockchain pilots improve traceability and auditability across farms, mills, and distributors.
You should weigh risks alongside growth. Weather variability, water constraints, and disease cycles can tighten fruit supply and lift prices. Quality dispersion and adulteration risks require strict specifications and third-party testing. Regulatory attention is rising; pesticide residue limits in the EU and labeling requirements in North America tighten compliance needs. Currency swings in Mexico and emerging exporters can affect margins.
Capital will continue to follow scale and logistics. Mexico and the United States remain core. Spain and the Netherlands serve as European gateways. Emerging investment hotspots include Peru, Colombia, and Kenya given expanding acreage and access to ports. For investors, integrated sourcing, certified sustainability, and tech-enabled traceability will differentiate returns over the next decade.
Key Takeaways
Market Growth: The global avocado oil market was USD 655.4 million in 2024 and is projected to reach USD 1,320.8 million at a 7.2% CAGR. Growth is anchored by health-focused cooking, clean-label personal care, and better supply chain integration.
Product Type: Extra Virgin Avocado Oil led with 38.4% share in 2023. Cold-press positioning and higher nutrient retention support a price premium and stronger repeat purchase in retail.
Application: Food and Beverage held 48.5% share in 2023. You see steady household adoption and wider foodservice use for dressings, sautéing, and high–smoke point cooking.
Driver: Expanding fruit availability and trade flows lift oil throughput. Global trade in major tropical fruits, including avocados, reached USD 11.2 billion in 2023, up 12% year over year; U.S. avocado imports grew about 8% per year from 2012 to 2022.
Restraint: Supply volatility and compliance risk pressure margins. Weather and disease cycles in key origins can reduce usable fruit by low double digits year to year, while tighter EU residue limits and North American labeling rules raise testing and certification costs.
Opportunity: Beauty and nutraceutical uses present headroom. These channels could contribute roughly USD 250–300 million of the market’s incremental USD 489 million growth through 2033 if current brand pipeline launches and retail placements sustain.
Trend: Processing upgrades improve yield and traceability. Mechanical cold pressing and solvent-free lines have delivered 2–4 percentage point oil-yield gains; pilots using AI for harvest forecasting and blockchain for batch-level tracking are scaling across mills and bottlers.
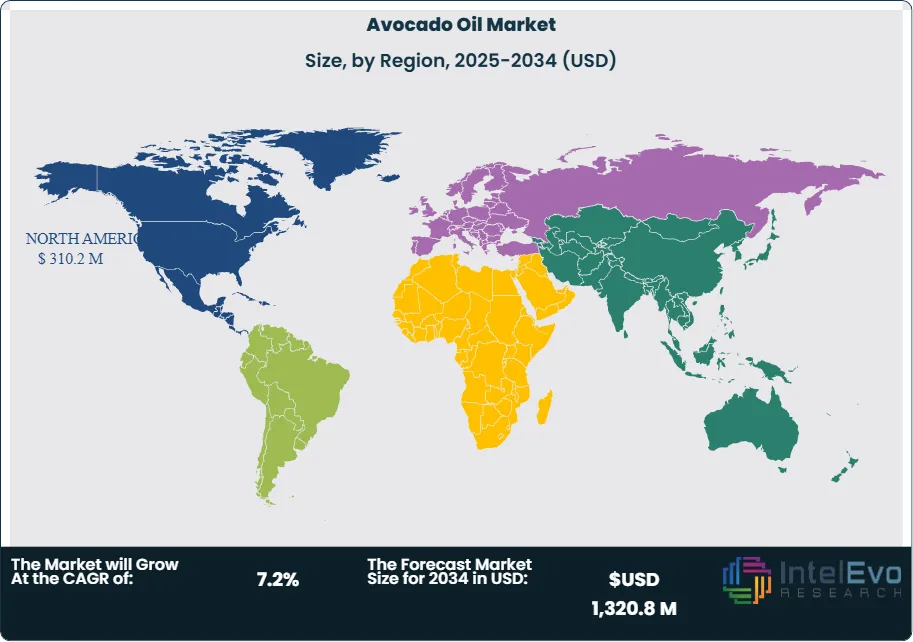
Regional Analysis: North America led with 51.2% share in 2023, supported by Mexico’s export growth of 20% to around 3.0 million metric tons and resilient U.S. demand. Europe is the next center to watch as the Netherlands and Spain recorded import growth of 14% and 20% annually, while emerging supply from Peru, Colombia, Kenya, and the Philippines (USD 17.11 million in exports to the U.S. in 2023) broadens sourcing options.
Product Type Analysis
Extra Virgin Avocado Oil remains the anchor of category value. It held 38.4% share in 2023 and continues to lead in 2025 as retailers expand cold-pressed assortments and organic lines. You see a clear price ladder. Extra virgin commands a 15–25 percent premium over refined grades in most markets due to minimal processing and stronger flavor cues.
Refined Avocado Oil grows with high-heat cooking and foodservice use. Its neutral taste and higher smoke point suit sautéing and frying, which supports steady volume gains through 2025. Expect private labels and club formats to broaden reach; operators favor refined for cost control and consistent performance.
Virgin Avocado Oil holds a balanced position between price and quality. It attracts value-seeking buyers in both culinary and personal care. Blends with canola, sunflower, or olive oil extend affordability and help brands seed entry-level demand in price-sensitive channels. Blends also help stabilize supply when fruit availability tightens.
Application Analysis
Food and Beverage remains the largest application with 48.5% share in 2023 and sustained growth into 2025. Household adoption rises as consumers shift from seed oils and seek high-monounsaturated options. Refined grades gain traction in hot-prep, while extra virgin grows in dressings and finishing.
Cosmetics and Skincare expand as brands add avocado oil to moisturizers, serums, and hair care for emollient and vitamin E claims. You can expect continued new product introductions and D2C launches that favor traceable, cold-pressed inputs. Batch-level audits and allergen controls have become common buyer requirements.
Pharmaceuticals and Dietary Supplements remain smaller but accelerate as clinical exploration of anti-inflammatory and antioxidant properties advances. Softgels and functional blends with omega-3s add incremental value. Combined, these health-led uses are among the fastest growers toward 2030.
Distribution Channel Analysis
Supermarkets and Hypermarkets held 36.5% share in 2023 and continue to set category pricing and shelf standards. Expanded facings for extra virgin and refined, plus clearer label hierarchies, improve trade-up. Your near-term growth comes from better placement in cooking oil aisles and natural sets.
Convenience Stores contribute stable, impulse-driven sales through smaller packs and travel sizes. Range is narrower than grocery, but proximity and immediacy sustain turns in urban locations. Online Retail scales fastest as shoppers compare prices, formats, and certifications. Subscriptions for pantry staples and beauty items boost repeat rates; online already accounts for a meaningful share in North America and selected EU markets. Other specialty outlets, including health food stores and direct-to-consumer sites, curate organic and non-GMO lines and attract label-sensitive buyers.
Regional Analysis
North America leads with 51.2% share in 2023, or about USD 310.2 million, supported by strong U.S. demand and steady fruit flows from Mexico. You should plan around stable premium retail demand and expanding foodservice use through 2025. Europe follows with rising penetration in the United Kingdom, Germany, Spain, and the Netherlands. Import hubs in Spain and the Netherlands improve availability and shorten lead times for processors.
Asia Pacific delivers the fastest unit growth as middle-income households increase spending on healthier oils and natural beauty. China, Japan, South Korea, and Australia see wider placement across grocery and e-commerce. Local bottling in Australia and emerging Southeast Asian hubs supports price competitiveness.
Latin America builds on supply strengths in Mexico, Peru, Colombia, Chile, and Brazil. MEA remains smaller but grows with premium grocery expansion in the Gulf and niche beauty demand in South Africa. Across origins, producers invest in mechanical cold pressing, solvent-free extraction, and digital traceability. These moves lift yields by 2–4 percentage points and improve quality assurance when harvest volatility tightens supply.
By Type (Extra Virgin Avocado Oil, Virgin Avocado Oil, Refined Avocado Oil, Crude Avocado Oil, Organic Avocado Oil, Cold-Pressed Avocado Oil), By Application (Food & Beverages, Cosmetics & Personal Care, Pharmaceuticals, Nutraceuticals, Industrial Uses), By Distribution Channel (Supermarkets & Hypermarkets, Convenience Stores, Specialty Stores (Organic & Gourmet), Online Retail / E-commerce, Direct Sales / B2B Retail), By Source (Hass Avocado, Fuerte Avocado, Others (Bacon, Zutano, Pinkerton, etc.)), By End-User (Household / Residential, Commercial Foodservice (Hotels, Restaurants, Cafés), Cosmetic Manufacturers, Pharmaceutical Companies, Nutraceutical Companies), By Extraction Method (Cold Pressed Extraction, Solvent Extraction, Centrifugal Extraction)
Research Methodology
Primary Research- 100 Interviews of Stakeholders
Secondary Research
Desk Research
Regional scope
North America (United States, Canada, Mexico)
Latin America (Brazil, Argentina, Columbia)
East Asia And Pacific (China, Japan, South Korea, Australia, Cambodia, Fiji, Indonesia)
Sea And South Asia (India, Singapore, Thailand, Taiwan, Malaysia)
Eastern Europe (Poland, Russia, Czech Republic, Romania)
Western Europe (Germany, U.K., France, Spain, Itlay)
Middle East & Africa (GCC Countries, Egypt, Nigeria, South Africa, Israel)
Competitive Landscape
Grupo Industrial Batellero, Spectrum Organics Products, LLC, The Village Press, Olivado USA, Sesajal S.A de C.V., Bella Vado Inc., La Tourangelle, Inc., Proteco Gold Pty Ltd., Grove Avocado Oil, Cibaria International
Customization Scope
Customization for segments, region/country-level will be provided. Moreover, additional customization can be done based on the requirements.
Pricing and Purchase Options
Avail customized purchase options to meet your exact research needs. We have three licenses to opt for: Single User License, Multi-User License (Up to 5 Users), Corporate Use License (Unlimited User and Printable PDF).
TABLE OF CONTENTS
1. EXECUTIVE SUMMARY
1.1. MARKET SNAPSHOT
1.2. KEY FINDINGS & INSIGHTS
1.3. ANALYST RECOMMENDATIONS
1.4. FUTURE OUTLOOK
2. RESEARCH METHODOLOGY
2.1. MARKET DEFINITION & SCOPE
2.2. RESEARCH OBJECTIVES: PRIMARY & SECONDARY DATA SOURCES
2.3. DATA COLLECTION SOURCES
2.3.1. COVERAGE OF 100+ PRIMARY RESEARCH/CONSULTATION CALLS WITH INDUSTRY STAKEHOLDERS
FIGURE 17 NORTH AMERICA AVOCADO OIL CURRENT AND FUTURE TYPE ANALYSIS, 2025–2034, (USD MILLION)
FIGURE 18 NORTH AMERICA AVOCADO OIL CURRENT AND FUTURE END USER ANALYSIS, 2025–2034, (USD MILLION)
FIGURE 19 MARKET SHARE BY COUNTRY
FIGURE 20 LATIN AMERICA AVOCADO OIL CURRENT AND FUTURE TYPE ANALYSIS, 2025–2034, (USD MILLION)
FIGURE 21 LATIN AMERICA AVOCADO OIL CURRENT AND FUTURE END USER ANALYSIS, 2025–2034, (USD MILLION)
FIGURE 22 MARKET SHARE BY COUNTRY
FIGURE 23 EASTERN EUROPE AVOCADO OIL CURRENT AND FUTURE TYPE ANALYSIS, 2025–2034, (USD MILLION)
FIGURE 24 EASTERN EUROPE AVOCADO OIL CURRENT AND FUTURE END USER ANALYSIS, 2025–2034, (USD MILLION)
FIGURE 25 MARKET SHARE BY COUNTRY
FIGURE 26 WESTERN EUROPE AVOCADO OIL CURRENT AND FUTURE TYPE ANALYSIS, 2025–2034, (USD MILLION)
FIGURE 27 WESTERN EUROPE AVOCADO OIL CURRENT AND FUTURE END USER ANALYSIS, 2025–2034, (USD MILLION)
FIGURE 28 MARKET SHARE BY COUNTRY
FIGURE 29 EAST ASIA AND PACIFIC AVOCADO OIL CURRENT AND FUTURE TYPE ANALYSIS, 2025–2034, (USD MILLION)
FIGURE 30 EAST ASIA AND PACIFIC AVOCADO OIL CURRENT AND FUTURE END USER ANALYSIS, 2025–2034, (USD MILLION)
FIGURE 31 MARKET SHARE BY COUNTRY
FIGURE 32 SEA AND SOUTH ASIA AVOCADO OIL CURRENT AND FUTURE TYPE ANALYSIS, 2025–2034, (USD MILLION)
FIGURE 33 SEA AND SOUTH ASIA AVOCADO OIL CURRENT AND FUTURE END USER ANALYSIS, 2025–2034, (USD MILLION)
FIGURE 34 MARKET SHARE BY COUNTRY
FIGURE 35 MIDDLE EAST AND AFRICA AVOCADO OIL CURRENT AND FUTURE TYPE ANALYSIS, 2025–2034, (USD MILLION)
FIGURE 36 MIDDLE EAST AND AFRICA AVOCADO OIL CURRENT AND FUTURE END USER ANALYSIS, 2025–2034, (USD MILLION)
FIGURE 37 NORTH AMERICA AVOCADO OIL CURRENT AND FUTURE MARKET VOLUME SHARE REGIONAL ANALYSIS, 2025–2034, (USD MILLION)
FIGURE 38 U.S. AVOCADO OIL CURRENT AND FUTURE TYPE ANALYSIS, 2025–2034, (USD MILLION)
FIGURE 39 U.S. AVOCADO OIL CURRENT AND FUTURE END USER ANALYSIS, 2025–2034, (USD MILLION)
FIGURE 40 CANADA AVOCADO OIL CURRENT AND FUTURE TYPE ANALYSIS, 2025–2034, (USD MILLION)
FIGURE 41 CANADA AVOCADO OIL CURRENT AND FUTURE END USER ANALYSIS, 2025–2034, (USD MILLION)
FIGURE 42 LATIN AMERICA AVOCADO OIL CURRENT AND FUTURE MARKET VOLUME SHARE REGIONAL ANALYSIS, 2025–2034, (USD MILLION)
FIGURE 43 MEXICO AVOCADO OIL CURRENT AND FUTURE TYPE ANALYSIS, 2025–2034, (USD MILLION)
FIGURE 44 MEXICO AVOCADO OIL CURRENT AND FUTURE END USER ANALYSIS, 2025–2034, (USD MILLION)
FIGURE 45 BRAZIL AVOCADO OIL CURRENT AND FUTURE TYPE ANALYSIS, 2025–2034, (USD MILLION)
FIGURE 46 BRAZIL AVOCADO OIL CURRENT AND FUTURE END USER ANALYSIS, 2025–2034, (USD MILLION)
FIGURE 47 ARGENTINA AVOCADO OIL CURRENT AND FUTURE TYPE ANALYSIS, 2025–2034, (USD MILLION)
FIGURE 48 ARGENTINA AVOCADO OIL CURRENT AND FUTURE END USER ANALYSIS, 2025–2034, (USD MILLION)
FIGURE 49 COLUMBIA AVOCADO OIL CURRENT AND FUTURE TYPE ANALYSIS, 2025–2034, (USD MILLION)
FIGURE 50 COLUMBIA AVOCADO OIL CURRENT AND FUTURE END USER ANALYSIS, 2025–2034, (USD MILLION)
FIGURE 51 REST OF LATIN AMERICA AVOCADO OIL CURRENT AND FUTURE TYPE ANALYSIS, 2025–2034, (USD MILLION)
FIGURE 52 REST OF LATIN AMERICA AVOCADO OIL CURRENT AND FUTURE END USER ANALYSIS, 2025–2034, (USD MILLION)
FIGURE 53 EASTERN EUROPE AVOCADO OIL CURRENT AND FUTURE MARKET VOLUME SHARE REGIONAL ANALYSIS, 2025–2034, (USD MILLION)
FIGURE 54 POLAND AVOCADO OIL CURRENT AND FUTURE TYPE ANALYSIS, 2025–2034, (USD MILLION)
FIGURE 55 POLAND AVOCADO OIL CURRENT AND FUTURE END USER ANALYSIS, 2025–2034, (USD MILLION)
FIGURE 56 RUSSIA AVOCADO OIL CURRENT AND FUTURE TYPE ANALYSIS, 2025–2034, (USD MILLION)
FIGURE 57 RUSSIA AVOCADO OIL CURRENT AND FUTURE END USER ANALYSIS, 2025–2034, (USD MILLION)
FIGURE 58 CZECH REPUBLIC AVOCADO OIL CURRENT AND FUTURE TYPE ANALYSIS, 2025–2034, (USD MILLION)
FIGURE 59 CZECH REPUBLIC AVOCADO OIL CURRENT AND FUTURE END USER ANALYSIS, 2025–2034, (USD MILLION)
FIGURE 60 ROMANIA AVOCADO OIL CURRENT AND FUTURE TYPE ANALYSIS, 2025–2034, (USD MILLION)
FIGURE 61 ROMANIA AVOCADO OIL CURRENT AND FUTURE END USER ANALYSIS, 2025–2034, (USD MILLION)
FIGURE 62 REST OF EASTERN EUROPE AVOCADO OIL CURRENT AND FUTURE TYPE ANALYSIS, 2025–2034, (USD MILLION)
FIGURE 63 REST OF EASTERN EUROPE AVOCADO OIL CURRENT AND FUTURE END USER ANALYSIS, 2025–2034, (USD MILLION)
FIGURE 64 WESTERN EUROPE AVOCADO OIL CURRENT AND FUTURE MARKET VOLUME SHARE REGIONAL ANALYSIS, 2025–2034, (USD MILLION)
FIGURE 65 GERMANY AVOCADO OIL CURRENT AND FUTURE TYPE ANALYSIS, 2025–2034, (USD MILLION)
FIGURE 66 GERMANY AVOCADO OIL CURRENT AND FUTURE END USER ANALYSIS, 2025–2034, (USD MILLION)
FIGURE 67 FRANCE AVOCADO OIL CURRENT AND FUTURE TYPE ANALYSIS, 2025–2034, (USD MILLION)
FIGURE 68 FRANCE AVOCADO OIL CURRENT AND FUTURE END USER ANALYSIS, 2025–2034, (USD MILLION)
FIGURE 69 UK AVOCADO OIL CURRENT AND FUTURE TYPE ANALYSIS, 2025–2034, (USD MILLION)
FIGURE 70 UK AVOCADO OIL CURRENT AND FUTURE END USER ANALYSIS, 2025–2034, (USD MILLION)
FIGURE 71 SPAIN AVOCADO OIL CURRENT AND FUTURE TYPE ANALYSIS, 2025–2034, (USD MILLION)
FIGURE 72 SPAIN AVOCADO OIL CURRENT AND FUTURE END USER ANALYSIS, 2025–2034, (USD MILLION)
FIGURE 73 ITALY AVOCADO OIL CURRENT AND FUTURE TYPE ANALYSIS, 2025–2034, (USD MILLION)
FIGURE 74 ITALY AVOCADO OIL CURRENT AND FUTURE END USER ANALYSIS, 2025–2034, (USD MILLION)
FIGURE 75 REST OF WESTERN EUROPE AVOCADO OIL CURRENT AND FUTURE TYPE ANALYSIS, 2025–2034, (USD MILLION)
FIGURE 76 REST OF WESTERN EUROPE AVOCADO OIL CURRENT AND FUTURE END USER ANALYSIS, 2025–2034, (USD MILLION)
FIGURE 77 EAST ASIA AND PACIFIC AVOCADO OIL CURRENT AND FUTURE MARKET VOLUME SHARE REGIONAL ANALYSIS, 2025–2034, (USD MILLION)
FIGURE 78 CHINA AVOCADO OIL CURRENT AND FUTURE TYPE ANALYSIS, 2025–2034, (USD MILLION)
FIGURE 79 CHINA AVOCADO OIL CURRENT AND FUTURE END USER ANALYSIS, 2025–2034, (USD MILLION)
FIGURE 80 JAPAN AVOCADO OIL CURRENT AND FUTURE TYPE ANALYSIS, 2025–2034, (USD MILLION)
FIGURE 81 JAPAN AVOCADO OIL CURRENT AND FUTURE END USER ANALYSIS, 2025–2034, (USD MILLION)
FIGURE 82 AUSTRALIA AVOCADO OIL CURRENT AND FUTURE TYPE ANALYSIS, 2025–2034, (USD MILLION)
FIGURE 83 AUSTRALIA AVOCADO OIL CURRENT AND FUTURE END USER ANALYSIS, 2025–2034, (USD MILLION)
FIGURE 84 CAMBODIA AVOCADO OIL CURRENT AND FUTURE TYPE ANALYSIS, 2025–2034, (USD MILLION)
FIGURE 85 CAMBODIA AVOCADO OIL CURRENT AND FUTURE END USER ANALYSIS, 2025–2034, (USD MILLION)
FIGURE 86 FIJI AVOCADO OIL CURRENT AND FUTURE TYPE ANALYSIS, 2025–2034, (USD MILLION)
FIGURE 87 FIJI AVOCADO OIL CURRENT AND FUTURE END USER ANALYSIS, 2025–2034, (USD MILLION)
FIGURE 88 INDONESIA AVOCADO OIL CURRENT AND FUTURE TYPE ANALYSIS, 2025–2034, (USD MILLION)
FIGURE 89 INDONESIA AVOCADO OIL CURRENT AND FUTURE END USER ANALYSIS, 2025–2034, (USD MILLION)
FIGURE 90 SOUTH KOREA AVOCADO OIL CURRENT AND FUTURE TYPE ANALYSIS, 2025–2034, (USD MILLION)
FIGURE 91 SOUTH KOREA AVOCADO OIL CURRENT AND FUTURE END USER ANALYSIS, 2025–2034, (USD MILLION)
FIGURE 92 REST OF EAST ASIA AND PACIFIC AVOCADO OIL CURRENT AND FUTURE TYPE ANALYSIS, 2025–2034, (USD MILLION)
FIGURE 93 REST OF EAST ASIA AND PACIFIC AVOCADO OIL CURRENT AND FUTURE END USER ANALYSIS, 2025–2034, (USD MILLION)
FIGURE 94 SEA AND SOUTH ASIA AVOCADO OIL CURRENT AND FUTURE MARKET VOLUME SHARE REGIONAL ANALYSIS, 2025–2034, (USD MILLION)
FIGURE 95 BANGLADESH AVOCADO OIL CURRENT AND FUTURE TYPE ANALYSIS, 2025–2034, (USD MILLION)
FIGURE 96 BANGLADESH AVOCADO OIL CURRENT AND FUTURE END USER ANALYSIS, 2025–2034, (USD MILLION)
FIGURE 97 NEW ZEALAND AVOCADO OIL CURRENT AND FUTURE TYPE ANALYSIS, 2025–2034, (USD MILLION)
FIGURE 98 NEW ZEALAND AVOCADO OIL CURRENT AND FUTURE END USER ANALYSIS, 2025–2034, (USD MILLION)
FIGURE 99 INDIA AVOCADO OIL CURRENT AND FUTURE TYPE ANALYSIS, 2025–2034, (USD MILLION)
FIGURE 100 INDIA AVOCADO OIL CURRENT AND FUTURE END USER ANALYSIS, 2025–2034, (USD MILLION)
FIGURE 101 SINGAPORE AVOCADO OIL CURRENT AND FUTURE TYPE ANALYSIS, 2025–2034, (USD MILLION)
FIGURE 102 SINGAPORE AVOCADO OIL CURRENT AND FUTURE END USER ANALYSIS, 2025–2034, (USD MILLION)
FIGURE 103 THAILAND AVOCADO OIL CURRENT AND FUTURE TYPE ANALYSIS, 2025–2034, (USD MILLION)
FIGURE 104 THAILAND AVOCADO OIL CURRENT AND FUTURE END USER ANALYSIS, 2025–2034, (USD MILLION)
FIGURE 105 TAIWAN AVOCADO OIL CURRENT AND FUTURE TYPE ANALYSIS, 2025–2034, (USD MILLION)
FIGURE 106 TAIWAN AVOCADO OIL CURRENT AND FUTURE END USER ANALYSIS, 2025–2034, (USD MILLION)
FIGURE 107 MALAYSIA AVOCADO OIL CURRENT AND FUTURE TYPE ANALYSIS, 2025–2034, (USD MILLION)
FIGURE 108 MALAYSIA AVOCADO OIL CURRENT AND FUTURE END USER ANALYSIS, 2025–2034, (USD MILLION)
FIGURE 109 REST OF SEA AND SOUTH ASIA AVOCADO OIL CURRENT AND FUTURE TYPE ANALYSIS, 2025–2034, (USD MILLION)
FIGURE 110 REST OF SEA AND SOUTH ASIA AVOCADO OIL CURRENT AND FUTURE END USER ANALYSIS, 2025–2034, (USD MILLION)
FIGURE 111 MIDDLE EAST AND AFRICA AVOCADO OIL CURRENT AND FUTURE MARKET VOLUME SHARE REGIONAL ANALYSIS, 2025–2034, (USD MILLION)
FIGURE 112 GCC COUNTRIES AVOCADO OIL CURRENT AND FUTURE TYPE ANALYSIS, 2025–2034, (USD MILLION)
FIGURE 113 GCC COUNTRIES AVOCADO OIL CURRENT AND FUTURE END USER ANALYSIS, 2025–2034, (USD MILLION)
FIGURE 114 SAUDI ARABIA AVOCADO OIL CURRENT AND FUTURE TYPE ANALYSIS, 2025–2034, (USD MILLION)
FIGURE 115 SAUDI ARABIA AVOCADO OIL CURRENT AND FUTURE END USER ANALYSIS, 2025–2034, (USD MILLION)
FIGURE 116 UAE AVOCADO OIL CURRENT AND FUTURE TYPE ANALYSIS, 2025–2034, (USD MILLION)
FIGURE 117 UAE AVOCADO OIL CURRENT AND FUTURE END USER ANALYSIS, 2025–2034, (USD MILLION)
FIGURE 118 BAHRAIN AVOCADO OIL CURRENT AND FUTURE TYPE ANALYSIS, 2025–2034, (USD MILLION)
FIGURE 119 BAHRAIN AVOCADO OIL CURRENT AND FUTURE END USER ANALYSIS, 2025–2034, (USD MILLION)
FIGURE 120 KUWAIT AVOCADO OIL CURRENT AND FUTURE TYPE ANALYSIS, 2025–2034, (USD MILLION)
FIGURE 121 KUWAIT AVOCADO OIL CURRENT AND FUTURE END USER ANALYSIS, 2025–2034, (USD MILLION)
FIGURE 122 OMAN AVOCADO OIL CURRENT AND FUTURE TYPE ANALYSIS, 2025–2034, (USD MILLION)
FIGURE 123 OMAN AVOCADO OIL CURRENT AND FUTURE END USER ANALYSIS, 2025–2034, (USD MILLION)
FIGURE 124 QATAR AVOCADO OIL CURRENT AND FUTURE TYPE ANALYSIS, 2025–2034, (USD MILLION)
FIGURE 125 QATAR AVOCADO OIL CURRENT AND FUTURE END USER ANALYSIS, 2025–2034, (USD MILLION)
FIGURE 126 EGYPT AVOCADO OIL CURRENT AND FUTURE TYPE ANALYSIS, 2025–2034, (USD MILLION)
FIGURE 127 EGYPT AVOCADO OIL CURRENT AND FUTURE END USER ANALYSIS, 2025–2034, (USD MILLION)
FIGURE 128 NIGERIA AVOCADO OIL CURRENT AND FUTURE TYPE ANALYSIS, 2025–2034, (USD MILLION)
FIGURE 129 NIGERIA AVOCADO OIL CURRENT AND FUTURE END USER ANALYSIS, 2025–2034, (USD MILLION)
FIGURE 130 SOUTH AFRICA AVOCADO OIL CURRENT AND FUTURE TYPE ANALYSIS, 2025–2034, (USD MILLION)
FIGURE 131 SOUTH AFRICA AVOCADO OIL CURRENT AND FUTURE END USER ANALYSIS, 2025–2034, (USD MILLION)
FIGURE 132 ISRAEL AVOCADO OIL CURRENT AND FUTURE TYPE ANALYSIS, 2025–2034, (USD MILLION)
FIGURE 133 ISRAEL AVOCADO OIL CURRENT AND FUTURE END USER ANALYSIS, 2025–2034, (USD MILLION)
FIGURE 134 REST OF MEA AVOCADO OIL CURRENT AND FUTURE TYPE ANALYSIS, 2025–2034, (USD MILLION)
FIGURE 135 REST OF MEA AVOCADO OIL CURRENT AND FUTURE END USER ANALYSIS, 2025–2034, (USD MILLION)
FIGURE 136 U. S. MARKET SHARE ANALYSIS BY TYPE (2024)
FIGURE 137 U. S. MARKET SHARE ANALYSIS BY END USER (2024)
FIGURE 138 CANADA MARKET SHARE ANALYSIS BY TYPE (2024)
FIGURE 139 CANADA MARKET SHARE ANALYSIS BY END USER (2024)
FIGURE 140 MEXICO MARKET SHARE ANALYSIS BY TYPE (2024)
FIGURE 141 MEXICO MARKET SHARE ANALYSIS BY END USER (2024)
FIGURE 142 CHINA MARKET SHARE ANALYSIS BY TYPE (2024)
FIGURE 143 CHINA MARKET SHARE ANALYSIS BY END USER (2024)
FIGURE 144 JAPAN MARKET SHARE ANALYSIS BY TYPE (2024)
FIGURE 145 JAPAN MARKET SHARE ANALYSIS BY END USER (2024)
FIGURE 146 INDIA MARKET SHARE ANALYSIS BY TYPE (2024)
FIGURE 147 INDIA MARKET SHARE ANALYSIS BY END USER (2024)
FIGURE 148 SOUTH KOREA MARKET SHARE ANALYSIS BY TYPE (2024)
FIGURE 149 SOUTH KOREA MARKET SHARE ANALYSIS BY END USER (2024)
FIGURE 150 SAUDI ARABIA MARKET SHARE ANALYSIS BY TYPE (2024)
FIGURE 151 SAUDI ARABIA MARKET SHARE ANALYSIS BY END USER (2024)
FIGURE 152 UAE MARKET SHARE ANALYSIS BY TYPE (2024)
FIGURE 153 UAE MARKET SHARE ANALYSIS BY END USER (2024)
FIGURE 154 EGYPT MARKET SHARE ANALYSIS BY TYPE (2024)
FIGURE 155 EGYPT MARKET SHARE ANALYSIS BY END USER (2024)
FIGURE 156 NIGERIA MARKET SHARE ANALYSIS BY TYPE (2024)
FIGURE 157 NIGERIA MARKET SHARE ANALYSIS BY END USER (2024)
FIGURE 158 SOUTH AFRICA MARKET SHARE ANALYSIS BY TYPE (2024)
FIGURE 159 SOUTH AFRICA MARKET SHARE ANALYSIS BY END USER (2024)
FIGURE 160 GERMANY MARKET SHARE ANALYSIS BY TYPE (2024)
FIGURE 161 GERMANY MARKET SHARE ANALYSIS BY END USER (2024)
FIGURE 162 FRANCE MARKET SHARE ANALYSIS BY TYPE (2024)
FIGURE 163 FRANCE MARKET SHARE ANALYSIS BY END USER (2024)
FIGURE 164 UK MARKET SHARE ANALYSIS BY TYPE (2024)
FIGURE 165 UK MARKET SHARE ANALYSIS BY END USER (2024)
FIGURE 166 SPAIN MARKET SHARE ANALYSIS BY TYPE (2024)
FIGURE 167 SPAIN MARKET SHARE ANALYSIS BY END USER (2024)
FIGURE 168 ITALY MARKET SHARE ANALYSIS BY TYPE (2024)
FIGURE 169 ITALY MARKET SHARE ANALYSIS BY END USER (2024)
FIGURE 170 BRAZIL MARKET SHARE ANALYSIS BY TYPE (2024)
FIGURE 171 BRAZIL MARKET SHARE ANALYSIS BY END USER (2024)
FIGURE 172 ARGENTINA MARKET SHARE ANALYSIS BY TYPE (2024)
FIGURE 173 ARGENTINA MARKET SHARE ANALYSIS BY END USER (2024)
FIGURE 174 COLUMBIA MARKET SHARE ANALYSIS BY TYPE (2024)
FIGURE 175 COLUMBIA MARKET SHARE ANALYSIS BY END USER (2024)
FIGURE 176 GLOBAL AVOCADO OIL CURRENT AND FUTURE MARKET KEY COUNTRY LEVEL ANALYSIS, 2024–2034, (USD MILLION)
FIGURE 177 FINANCIAL OVERVIEW:
Key Player Analysis
Olivado USA: Leader in premium extra-virgin avocado oil with roots in New Zealand and a growing footprint in North America. Portfolio centers on organic, cold-pressed extra virgin formats for culinary and personal care use. The company expanded its organic range in late 2024 to meet sustainability and clean-label demand; this supports price premiums and brand loyalty into 2025.
Olivado’s differentiators include origin control and accredited cold-pressing. Messaging around non-GMO and organic certification resonates with higher-income households and specialty retail buyers. Expect continued gains through online and specialty channels as consumers trade up within the extra-virgin segment.
Grove Avocado Oil: Niche player with strong positioning in extra-virgin, cold-pressed oils produced in New Zealand. The brand competes on purity claims and first-press processing, which appeals to label-sensitive shoppers and chefs seeking flavor retention. Grove’s strategy focuses on premium glass formats and consistent sensory quality. Select e-commerce distribution into North America supports reach while protecting pricing. The brand’s single-origin story and cold-press credentials differentiate it in a crowded specialty set.
La Tourangelle, Inc.: Challenger with broad U.S. retail access and vertical integration into Peru. In 2025 the company operates a dedicated avocado oil mill in Lima using centrifuge technology. This integration improves sourcing control, shortens lead times, and supports consistent quality for national retail programs.
La Tourangelle’s portfolio spans pure avocado oil and blends packed in light-protective tins, which aid shelf life. The firm’s U.S.–Peru supply chain offers scale advantages and supports competitive pricing in supermarkets and club formats.
The Village Press: Niche player from New Zealand with a focus on extra-virgin avocado oil and functional blends. The company markets cold-pressed avocado oil and a 50:50 olive–avocado blend that raises smoke point for foodservice and home cooking. Differentiation comes from blend innovation and provenance. The brand targets shoppers seeking higher heat stability without trading down on perceived health benefits, supporting steady turns in specialty retail.
GomSpace: Not active in the avocado oil value chain. The company is a nanosatellite vendor with 2025 financing updates and aerospace revenue exposure. It has no reported edible-oil brands, processing assets, or distribution in food or personal care. Exclude from competitive sets for this market.
L3Harris Technologies Inc.: Defense Electronics Company with multibillion-dollar quarterly revenue in 2025. No participation in edible oils or avocado supply chains. Any inclusion in avocado oil peer analyses would distort market shares and benchmarks.
Lockheed Martin Corporation: Global aerospace and defense contractor. No reported activity in edible oils, cosmetics ingredients, or related distribution. Remove from avocado oil peer comparisons and replace with category participants to maintain analytic integrity.
Market Key Players
Grupo Industrial Batellero
Spectrum Organics Products, LLC
The Village Press
Olivado USA
Sesajal S.A de C.V.
Bella Vado Inc.
La Tourangelle, Inc.
Proteco Gold Pty Ltd.
Grove Avocado Oil
Cibaria International
Driver:
Health-First Consumption and Premium Cooking Oils Boost Market Growth
As of 2025, avocado oil continues to benefit from health-first purchasing and the premiumization of everyday cooking oils. The category’s revenue is on a 6.1% CAGR path to 2033, with the 2025 market estimated near USD 682 million. Extra virgin variants retain the largest slice of value at roughly 38–40% due to minimal processing and stronger nutrient retention. Food and beverage remains the anchor use. Operators adopt avocado oil for its high smoke point and consistent performance, while household penetration rises through modern trade and online subscriptions. Cosmetics and skincare add a second growth engine as brands standardize on plant-based emollients with vitamin E claims. Together, these uses keep throughput high and support stable plant utilization.
Advances in Extraction Efficiency Strengthen Supply and Quality Control
This demand profile encourages investment in efficient extraction and quality control. Producers that combine cold pressing with solvent-free polishing report 2–4 percentage point yield gains and tighter fatty-acid profiles. You can expect scale players to lock in long-term fruit supply and preferred freight lanes to secure cost and service levels across peak seasons.
Restraint:
Fruit Price Volatility and Origin Concentration Pressure Margins
The main headwind in 2025 remains cost volatility tied to fruit availability and origin concentration. Mexico and Peru supply well over 60% of cross-border volumes. Weather events, water stress, or phytosanitary actions in either market can shift farm-gate prices by double digits within a quarter and compress brand margins by 100–200 basis points if pricing lags. Freight and currency swings add another layer of unpredictability in landed costs.
Rising Compliance and Quality Risks Increase Operational Costs
Compliance requirements are tightening. Residue limits in the EU and labeling rules in North America raise testing frequency and batch segregation costs. Adulteration and quality dispersion risk reputational damage, which pushes buyers toward third-party certifications, validated CoAs, and periodic isotope testing. Smaller fillers face higher per-unit compliance costs, which can slow new product introductions.
Opportunity:
Beauty, Wellness, and Functional Foods Unlock High-Growth Channels
The strongest runway sits in beauty and wellness and in Asia Pacific retail. Cosmetics, skincare, and dietary supplements can outgrow the core market at 8–10% CAGR through 2030. On that trajectory, these channels could add USD 70–90 million of incremental revenue between 2025 and 2030 as brands launch serums, hair oils, and softgels that highlight monounsaturated fats and antioxidant content. Foodservice sprays and fortified culinary blends create trade-up opportunities in supermarkets and club formats.
Asia Pacific Expansion and Local Bottling Create Major Revenue Upside
Asia Pacific is the geographic swing factor. As modern grocery and cross-border e-commerce scale, the region’s revenue share can move from the low teens in 2025 toward 18–20% by 2030. Local bottling in Australia and Southeast Asia, combined with private-label programs in Japan and South Korea, will lift availability and sharpen price points. You can capture this growth with multi-origin sourcing, shelf-ready packaging, and targeted nutrition claims.
Trend:
Traceability, AI, and Automation Become Core Competitive Differentiators
Traceability and automation now shape competitive advantage. Producers deploy AI tools for harvest forecasting and line monitoring, which improves grade mix and reduces waste. Blockchain or equivalent batch-level tracking is moving from pilots to standard practice with major retailers and D2C brands. These programs shorten recall times and support sustainability narratives that win shelf space.
Energy-Efficient Processing and Modern Packaging Improve Cost & Shelf Life
Processing and packaging are also changing the cost curve. Mechanical cold pressing paired with heat-recovery systems lowers energy intensity. Bag-in-box and light-barrier PET extend shelf life and reduce oxidation in foodservice and retail. The net effect is tighter quality dispersion, better yields, and lower unit costs at scale. Firms that execute on tech-enabled traceability and efficient extraction will secure contracts with top retailers and capture a larger share of premium price tiers.
Recent Developments
Dec 2024 – Chosen Foods: Publicly backed the Codex Alimentarius Commission’s move to establish an international avocado-oil purity standard, signaling support for tighter authenticity testing and labeling. This positions the brand to benefit from premium pricing as enforcement curbs adulteration.
Jan 2025 – Westfalia Fruit: Completed the acquisition of Belgium-based Syros, a producer of avocado products for European retail and foodservice. The deal broadens Westfalia’s value-added footprint in the EU and strengthens its channel access for processed formats, including oils and prepared products.
Mar 2025 – Fresh Del Monte Produce: Acquired a majority stake in Uganda’s Avolio, with plans to scale extraction technology to process about 140 metric tons of avocados per day. The transaction adds an outlet for off-grade fruit, reduces waste, and deepens vertical integration into higher-margin specialty ingredients.
Jul 2025 – La Tourangelle: Announced active avocado-oil pressing in Lima, Peru using centrifuge-based extraction, integrating sourcing with in-house processing. The new site shortens lead times for North and South American customers and supports claims of authenticity and controlled temperature processing.
Sep 2025 – Chosen Foods: Expanded national distribution for its 100% Organic Avocado Oil across Walmart, BJ’s, Costco, Kroger, Whole Foods, H-E-B, Meijer, and other banners. Broader shelf presence increases retail penetration ahead of the holiday cooking season and raises competitive pressure on private label.
Sep 2025 – Aldi Inc.: Reached a settlement in principle in a U.S. class action over “100% Pure” avocado-oil claims; the court dismissed the case without costs and without prejudice. The outcome highlights rising compliance risk and will likely accelerate retailer demand for validated purity testing and supplier certification.