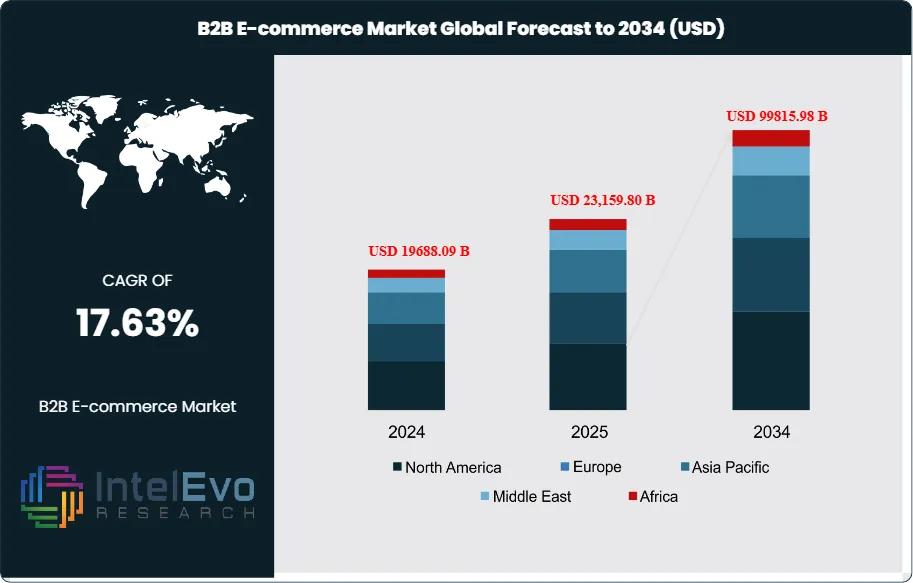
The B2B E-commerce Market size is expected to be worth around USD 99,815.98 billion by 2034, rising from USD 19,688.09 billion in 2024, and expanding at a CAGR of 17.63% during the forecast period from 2024 to 2034. This rapid growth is driven by accelerating digital procurement, increased adoption of cloud-based B2B marketplaces, and the integration of AI-driven pricing, catalog management, and demand forecasting tools. Growing preference for self-service buying, seamless omnichannel experiences, and cross-border trade digitization is further transforming enterprise purchasing behavior and reshaping global B2B commerce ecosystems.
The global business-to-business e-commerce landscape represents a fundamental shift in how companies conduct commercial transactions, distinguished from traditional consumer-focused commerce through its emphasis on enterprise-level requirements including bulk procurement, customized pricing structures, and flexible payment arrangements. This sector encompasses digital platforms where businesses serve as both buyers and sellers, creating sophisticated ecosystems that support complex commercial relationships and supply chain integrations.
The B2B e-commerce sector has witnessed extraordinary growth driven by comprehensive digital transformation initiatives across industries worldwide. Organizations are increasingly recognizing that digital commerce platforms provide strategic advantages including operational efficiency, cost reduction, and enhanced customer relationships. This transformation has been accelerated by evolving customer expectations that mirror consumer e-commerce experiences, with business buyers demanding intuitive interfaces, seamless navigation, and personalized service delivery. Modern B2B platforms must balance enterprise-grade functionality with user-friendly design elements traditionally associated with consumer platforms. This dual requirement has driven innovation in platform architecture, creating solutions that support complex procurement workflows while maintaining the simplicity and responsiveness that contemporary users expect. The integration of advanced technologies including artificial intelligence, machine learning, and predictive analytics has enabled platforms to offer personalized product recommendations, automated reordering systems, and dynamic pricing models.
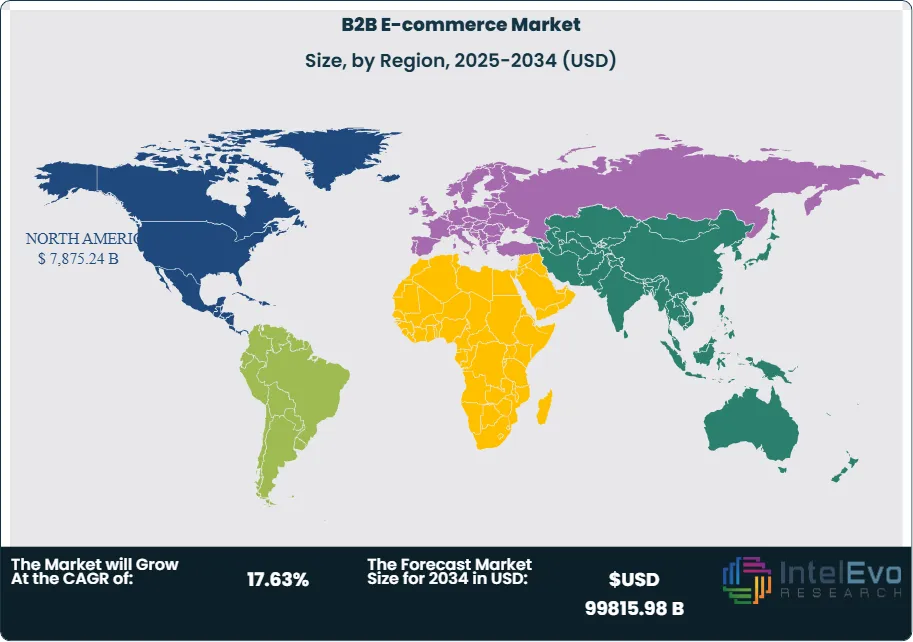
North America has established itself as the dominant force in global B2B e-commerce, leveraging advanced technological infrastructure and widespread digital adoption across the United States and Canada. This regional leadership stems from comprehensive internet penetration, sophisticated logistics networks, and supportive regulatory frameworks that facilitate large-scale digital commerce operations. The region benefits from mature technology ecosystems, established payment systems, and robust cybersecurity infrastructure essential for enterprise-level transactions.
The COVID-19 pandemic served as a catalyst for unprecedented digital adoption across B2B commerce, fundamentally altering how businesses approach procurement and supplier relationships. Companies that previously relied on traditional sales channels were forced to rapidly embrace online platforms to maintain operational continuity during global lockdowns and restrictions. This shift transformed digital commerce from an alternative channel to the primary method of business transaction for many organizations.
The pandemic highlighted the critical importance of agile supply chains and remote transaction capabilities, driving businesses to invest in comprehensive digital infrastructure. Organizations discovered that robust e-commerce platforms provided essential business continuity tools, enabling them to maintain customer relationships and operational efficiency despite physical limitations and geographic constraints.
Contemporary trade complexities, including geopolitical tensions, supply chain disruptions, and inventory management challenges, have paradoxically strengthened the B2B e-commerce sector by driving innovation in logistics technology and platform sophistication. These challenges have accelerated the development of real-time tracking systems, predictive analytics tools, and automated supply chain management solutions that enhance platform resilience and operational efficiency.
Key Takeaways
Market Growth: The B2B E-commerce Market is expected to reach USD 99815.98 Billion by 2034. driven by widespread digital transformation initiatives as organizations recognize digital platforms deliver strategic advantages including operational efficiency, cost reduction, and enhanced customer relationships.
Product Type Dominance: Home & Kitchen leads the product type segment because it benefits from post-pandemic renovation trends and the growing demand for smart home technologies in business environments.
Deployment Dominance: Supplier-Oriented deployment leads because it provides suppliers with direct control over sales processes, inventory management, and customer relationships while offering cost-effective market expansion opportunities.
Platform Dominance: Direct Sales platform leads because it provides businesses with complete control over sales processes and customer relationships while eliminating intermediary costs and enabling customized agreements.
Drivers: Key drivers accelerating growth include digital transformation demand and evolving customer expectations, which boost market expansion through operational efficiency improvements and enhanced user experiences.
Restraints: Growth is hindered by security concerns and dependence on traditional relationships, which create challenges such as data breach fears and resistance to digital platform adoption.
Opportunities: The market is poised for expansion due to opportunities like AI integration and blockchain implementation, which enable enhanced personalization and improved transaction security.
Trends: Emerging trends including automation adoption and cloud-based solutions are reshaping the market by streamlining procurement processes and enabling real-time analytics.
Regional Analysis: North America leads owing to advanced digital infrastructure and high technology adoption rates. Asia-Pacific shows high promise due to rapidly growing digital economies and increasing business digitalization.
Product Type Analysis:
The Home & Kitchen segment's leadership position in B2B e-commerce, capturing significant market share, is driven by multiple converging factors. The post-pandemic surge in home renovations, cooking, and decoration created sustained demand across business sectors, with hospitality and real estate companies regularly updating their product offerings. The segment benefits from shifting consumer preferences toward personalized and premium home products, prompting businesses to expand their portfolios with customized solutions and high-quality kitchen appliances. Technological advancements including smart home devices and energy-efficient appliances have made these products highly appealing to businesses seeking modern, sustainable options. Specialized online platforms offering extensive catalogs, competitive pricing, and comprehensive logistical support have streamlined B2B sourcing, making transactions more convenient and reliable for business buyers.
Deployment Analysis:
The Supplier-Oriented segment dominates B2B e-commerce deployment due to its comprehensive advantages for suppliers and businesses. This model enables suppliers to streamline supply chains, reduce operational costs, and maintain complete control over pricing and inventory management while facilitating direct buyer relationships. The segment's appeal to small and medium-sized enterprises seeking cost-effective market expansion without substantial infrastructure investment has strengthened its leadership position. Suppliers benefit from enhanced operational efficiency through direct buyer integration, simplified transaction processes, and improved inventory management capabilities. The model's scalability allows suppliers to adjust operations based on market demands without extensive physical expansions, providing crucial flexibility for adapting to dynamic market conditions. Technological advancements including AI and machine learning integration automate order management, customer service, and personalized marketing, further improving supply chain efficiency and buyer experiences.
Platform Analysis:
Direct Sales Leads With over 55% Market Share In B2B E-commerce Market. The Direct Sales segment commands the B2B e-commerce platform market share due to its comprehensive advantages in business transaction management. This model provides businesses with greater control over sales processes and customer relationships, which is essential for B2B transactions involving complex negotiations and customized agreements. Direct sales platforms enable suppliers to tailor offerings to meet specific business customer needs, enhancing satisfaction and loyalty through personalized service delivery. The model improves supply chain logistics by facilitating direct supplier-buyer interactions, reducing communication errors and misunderstandings while ensuring better service quality, timely deliveries, and efficient order handling. Cost efficiency represents another significant advantage, as businesses can eliminate intermediary markup fees and commissions typically associated with marketplace sales, making this model particularly appealing to small and medium-sized enterprises focused on optimizing spending and improving profitability. The direct relationship approach enables better customer data collection, enhanced business intelligence, and more effective long-term relationship management.
Regional Analysis
North America Leads With nearly 40% Market Share In B2B E-commerce Market. North America maintains its dominant position in the global B2B e-commerce market, accounting significant market share, this regional leadership is fundamentally anchored in the area's advanced technological infrastructure, characterized by robust digital networks, high internet penetration rates, and widespread adoption of automation technologies in procurement processes. The United States and Canada have cultivated well-established ecosystems of technology innovators and digital infrastructure providers that support large-scale e-commerce operations across diverse industry verticals.
The regulatory environment significantly contributes to North America's market dominance, with policies that actively promote digital trade, protect online transactions, and encourage technological innovation. These frameworks create secure environments for B2B transactions, with U.S. regulations on data protection and cybersecurity providing businesses the confidence to engage more extensively in digital commerce activities. Economic stability, characterized by high GDP levels and mature financial systems, attracts substantial business investments and creates favorable conditions for e-commerce platform development and adoption.
Asia-Pacific emerges as the most promising growth region, with markets like China, India, and Southeast Asian countries experiencing rapid digital transformation and increasing business digitalization initiatives. The region benefits from large manufacturing bases, growing middle-class populations, and government initiatives supporting digital economy development. Europe follows as a significant market, driven by stringent regulatory standards, advanced logistics networks, and strong emphasis on data privacy and security compliance that builds trust in digital business transactions.
Customization for segments, region/country-level will be provided. Moreover, additional customization can be done based on the requirements.
Pricing and Purchase Options
Avail customized purchase options to meet your exact research needs. We have three licenses to opt for: Single User License, Multi-User License (Up to 5 Users), Corporate Use License (Unlimited User and Printable PDF).
TABLE OF CONTENTS
1. EXECUTIVE SUMMARY
1.1. MARKET SNAPSHOT
1.2. KEY FINDINGS & INSIGHTS
1.3. ANALYST RECOMMENDATIONS
1.4. FUTURE OUTLOOK
2. RESEARCH METHODOLOGY
2.1. MARKET DEFINITION & SCOPE
2.2. RESEARCH OBJECTIVES: PRIMARY & SECONDARY DATA SOURCES
2.3. DATA COLLECTION SOURCES
2.3.1. COVERAGE OF 100+ PRIMARY RESEARCH/CONSULTATION CALLS WITH INDUSTRY STAKEHOLDERS
FIGURE 17 NORTH AMERICA B2B E-COMMERCE CURRENT AND FUTURE TYPE ANALYSIS, 2025–2034, (USD MILLION)
FIGURE 18 NORTH AMERICA B2B E-COMMERCE CURRENT AND FUTURE END USER ANALYSIS, 2025–2034, (USD MILLION)
FIGURE 19 MARKET SHARE BY COUNTRY
FIGURE 20 LATIN AMERICA B2B E-COMMERCE CURRENT AND FUTURE TYPE ANALYSIS, 2025–2034, (USD MILLION)
FIGURE 21 LATIN AMERICA B2B E-COMMERCE CURRENT AND FUTURE END USER ANALYSIS, 2025–2034, (USD MILLION)
FIGURE 22 MARKET SHARE BY COUNTRY
FIGURE 23 EASTERN EUROPE B2B E-COMMERCE CURRENT AND FUTURE TYPE ANALYSIS, 2025–2034, (USD MILLION)
FIGURE 24 EASTERN EUROPE B2B E-COMMERCE CURRENT AND FUTURE END USER ANALYSIS, 2025–2034, (USD MILLION)
FIGURE 25 MARKET SHARE BY COUNTRY
FIGURE 26 WESTERN EUROPE B2B E-COMMERCE CURRENT AND FUTURE TYPE ANALYSIS, 2025–2034, (USD MILLION)
FIGURE 27 WESTERN EUROPE B2B E-COMMERCE CURRENT AND FUTURE END USER ANALYSIS, 2025–2034, (USD MILLION)
FIGURE 28 MARKET SHARE BY COUNTRY
FIGURE 29 EAST ASIA AND PACIFIC B2B E-COMMERCE CURRENT AND FUTURE TYPE ANALYSIS, 2025–2034, (USD MILLION)
FIGURE 30 EAST ASIA AND PACIFIC B2B E-COMMERCE CURRENT AND FUTURE END USER ANALYSIS, 2025–2034, (USD MILLION)
FIGURE 31 MARKET SHARE BY COUNTRY
FIGURE 32 SEA AND SOUTH ASIA B2B E-COMMERCE CURRENT AND FUTURE TYPE ANALYSIS, 2025–2034, (USD MILLION)
FIGURE 33 SEA AND SOUTH ASIA B2B E-COMMERCE CURRENT AND FUTURE END USER ANALYSIS, 2025–2034, (USD MILLION)
FIGURE 34 MARKET SHARE BY COUNTRY
FIGURE 35 MIDDLE EAST AND AFRICA B2B E-COMMERCE CURRENT AND FUTURE TYPE ANALYSIS, 2025–2034, (USD MILLION)
FIGURE 36 MIDDLE EAST AND AFRICA B2B E-COMMERCE CURRENT AND FUTURE END USER ANALYSIS, 2025–2034, (USD MILLION)
FIGURE 37 NORTH AMERICA B2B E-COMMERCE CURRENT AND FUTURE MARKET VOLUME SHARE REGIONAL ANALYSIS, 2025–2034, (USD MILLION)
FIGURE 38 U.S. B2B E-COMMERCE CURRENT AND FUTURE TYPE ANALYSIS, 2025–2034, (USD MILLION)
FIGURE 39 U.S. B2B E-COMMERCE CURRENT AND FUTURE END USER ANALYSIS, 2025–2034, (USD MILLION)
FIGURE 40 CANADA B2B E-COMMERCE CURRENT AND FUTURE TYPE ANALYSIS, 2025–2034, (USD MILLION)
FIGURE 41 CANADA B2B E-COMMERCE CURRENT AND FUTURE END USER ANALYSIS, 2025–2034, (USD MILLION)
FIGURE 42 LATIN AMERICA B2B E-COMMERCE CURRENT AND FUTURE MARKET VOLUME SHARE REGIONAL ANALYSIS, 2025–2034, (USD MILLION)
FIGURE 43 MEXICO B2B E-COMMERCE CURRENT AND FUTURE TYPE ANALYSIS, 2025–2034, (USD MILLION)
FIGURE 44 MEXICO B2B E-COMMERCE CURRENT AND FUTURE END USER ANALYSIS, 2025–2034, (USD MILLION)
FIGURE 45 BRAZIL B2B E-COMMERCE CURRENT AND FUTURE TYPE ANALYSIS, 2025–2034, (USD MILLION)
FIGURE 46 BRAZIL B2B E-COMMERCE CURRENT AND FUTURE END USER ANALYSIS, 2025–2034, (USD MILLION)
FIGURE 47 ARGENTINA B2B E-COMMERCE CURRENT AND FUTURE TYPE ANALYSIS, 2025–2034, (USD MILLION)
FIGURE 48 ARGENTINA B2B E-COMMERCE CURRENT AND FUTURE END USER ANALYSIS, 2025–2034, (USD MILLION)
FIGURE 49 COLUMBIA B2B E-COMMERCE CURRENT AND FUTURE TYPE ANALYSIS, 2025–2034, (USD MILLION)
FIGURE 50 COLUMBIA B2B E-COMMERCE CURRENT AND FUTURE END USER ANALYSIS, 2025–2034, (USD MILLION)
FIGURE 51 REST OF LATIN AMERICA B2B E-COMMERCE CURRENT AND FUTURE TYPE ANALYSIS, 2025–2034, (USD MILLION)
FIGURE 52 REST OF LATIN AMERICA B2B E-COMMERCE CURRENT AND FUTURE END USER ANALYSIS, 2025–2034, (USD MILLION)
FIGURE 53 EASTERN EUROPE B2B E-COMMERCE CURRENT AND FUTURE MARKET VOLUME SHARE REGIONAL ANALYSIS, 2025–2034, (USD MILLION)
FIGURE 54 POLAND B2B E-COMMERCE CURRENT AND FUTURE TYPE ANALYSIS, 2025–2034, (USD MILLION)
FIGURE 55 POLAND B2B E-COMMERCE CURRENT AND FUTURE END USER ANALYSIS, 2025–2034, (USD MILLION)
FIGURE 56 RUSSIA B2B E-COMMERCE CURRENT AND FUTURE TYPE ANALYSIS, 2025–2034, (USD MILLION)
FIGURE 57 RUSSIA B2B E-COMMERCE CURRENT AND FUTURE END USER ANALYSIS, 2025–2034, (USD MILLION)
FIGURE 58 CZECH REPUBLIC B2B E-COMMERCE CURRENT AND FUTURE TYPE ANALYSIS, 2025–2034, (USD MILLION)
FIGURE 59 CZECH REPUBLIC B2B E-COMMERCE CURRENT AND FUTURE END USER ANALYSIS, 2025–2034, (USD MILLION)
FIGURE 60 ROMANIA B2B E-COMMERCE CURRENT AND FUTURE TYPE ANALYSIS, 2025–2034, (USD MILLION)
FIGURE 61 ROMANIA B2B E-COMMERCE CURRENT AND FUTURE END USER ANALYSIS, 2025–2034, (USD MILLION)
FIGURE 62 REST OF EASTERN EUROPE B2B E-COMMERCE CURRENT AND FUTURE TYPE ANALYSIS, 2025–2034, (USD MILLION)
FIGURE 63 REST OF EASTERN EUROPE B2B E-COMMERCE CURRENT AND FUTURE END USER ANALYSIS, 2025–2034, (USD MILLION)
FIGURE 64 WESTERN EUROPE B2B E-COMMERCE CURRENT AND FUTURE MARKET VOLUME SHARE REGIONAL ANALYSIS, 2025–2034, (USD MILLION)
FIGURE 65 GERMANY B2B E-COMMERCE CURRENT AND FUTURE TYPE ANALYSIS, 2025–2034, (USD MILLION)
FIGURE 66 GERMANY B2B E-COMMERCE CURRENT AND FUTURE END USER ANALYSIS, 2025–2034, (USD MILLION)
FIGURE 67 FRANCE B2B E-COMMERCE CURRENT AND FUTURE TYPE ANALYSIS, 2025–2034, (USD MILLION)
FIGURE 68 FRANCE B2B E-COMMERCE CURRENT AND FUTURE END USER ANALYSIS, 2025–2034, (USD MILLION)
FIGURE 69 UK B2B E-COMMERCE CURRENT AND FUTURE TYPE ANALYSIS, 2025–2034, (USD MILLION)
FIGURE 70 UK B2B E-COMMERCE CURRENT AND FUTURE END USER ANALYSIS, 2025–2034, (USD MILLION)
FIGURE 71 SPAIN B2B E-COMMERCE CURRENT AND FUTURE TYPE ANALYSIS, 2025–2034, (USD MILLION)
FIGURE 72 SPAIN B2B E-COMMERCE CURRENT AND FUTURE END USER ANALYSIS, 2025–2034, (USD MILLION)
FIGURE 73 ITALY B2B E-COMMERCE CURRENT AND FUTURE TYPE ANALYSIS, 2025–2034, (USD MILLION)
FIGURE 74 ITALY B2B E-COMMERCE CURRENT AND FUTURE END USER ANALYSIS, 2025–2034, (USD MILLION)
FIGURE 75 REST OF WESTERN EUROPE B2B E-COMMERCE CURRENT AND FUTURE TYPE ANALYSIS, 2025–2034, (USD MILLION)
FIGURE 76 REST OF WESTERN EUROPE B2B E-COMMERCE CURRENT AND FUTURE END USER ANALYSIS, 2025–2034, (USD MILLION)
FIGURE 77 EAST ASIA AND PACIFIC B2B E-COMMERCE CURRENT AND FUTURE MARKET VOLUME SHARE REGIONAL ANALYSIS, 2025–2034, (USD MILLION)
FIGURE 78 CHINA B2B E-COMMERCE CURRENT AND FUTURE TYPE ANALYSIS, 2025–2034, (USD MILLION)
FIGURE 79 CHINA B2B E-COMMERCE CURRENT AND FUTURE END USER ANALYSIS, 2025–2034, (USD MILLION)
FIGURE 80 JAPAN B2B E-COMMERCE CURRENT AND FUTURE TYPE ANALYSIS, 2025–2034, (USD MILLION)
FIGURE 81 JAPAN B2B E-COMMERCE CURRENT AND FUTURE END USER ANALYSIS, 2025–2034, (USD MILLION)
FIGURE 82 AUSTRALIA B2B E-COMMERCE CURRENT AND FUTURE TYPE ANALYSIS, 2025–2034, (USD MILLION)
FIGURE 83 AUSTRALIA B2B E-COMMERCE CURRENT AND FUTURE END USER ANALYSIS, 2025–2034, (USD MILLION)
FIGURE 84 CAMBODIA B2B E-COMMERCE CURRENT AND FUTURE TYPE ANALYSIS, 2025–2034, (USD MILLION)
FIGURE 85 CAMBODIA B2B E-COMMERCE CURRENT AND FUTURE END USER ANALYSIS, 2025–2034, (USD MILLION)
FIGURE 86 FIJI B2B E-COMMERCE CURRENT AND FUTURE TYPE ANALYSIS, 2025–2034, (USD MILLION)
FIGURE 87 FIJI B2B E-COMMERCE CURRENT AND FUTURE END USER ANALYSIS, 2025–2034, (USD MILLION)
FIGURE 88 INDONESIA B2B E-COMMERCE CURRENT AND FUTURE TYPE ANALYSIS, 2025–2034, (USD MILLION)
FIGURE 89 INDONESIA B2B E-COMMERCE CURRENT AND FUTURE END USER ANALYSIS, 2025–2034, (USD MILLION)
FIGURE 90 SOUTH KOREA B2B E-COMMERCE CURRENT AND FUTURE TYPE ANALYSIS, 2025–2034, (USD MILLION)
FIGURE 91 SOUTH KOREA B2B E-COMMERCE CURRENT AND FUTURE END USER ANALYSIS, 2025–2034, (USD MILLION)
FIGURE 92 REST OF EAST ASIA AND PACIFIC B2B E-COMMERCE CURRENT AND FUTURE TYPE ANALYSIS, 2025–2034, (USD MILLION)
FIGURE 93 REST OF EAST ASIA AND PACIFIC B2B E-COMMERCE CURRENT AND FUTURE END USER ANALYSIS, 2025–2034, (USD MILLION)
FIGURE 94 SEA AND SOUTH ASIA B2B E-COMMERCE CURRENT AND FUTURE MARKET VOLUME SHARE REGIONAL ANALYSIS, 2025–2034, (USD MILLION)
FIGURE 95 BANGLADESH B2B E-COMMERCE CURRENT AND FUTURE TYPE ANALYSIS, 2025–2034, (USD MILLION)
FIGURE 96 BANGLADESH B2B E-COMMERCE CURRENT AND FUTURE END USER ANALYSIS, 2025–2034, (USD MILLION)
FIGURE 97 NEW ZEALAND B2B E-COMMERCE CURRENT AND FUTURE TYPE ANALYSIS, 2025–2034, (USD MILLION)
FIGURE 98 NEW ZEALAND B2B E-COMMERCE CURRENT AND FUTURE END USER ANALYSIS, 2025–2034, (USD MILLION)
FIGURE 99 INDIA B2B E-COMMERCE CURRENT AND FUTURE TYPE ANALYSIS, 2025–2034, (USD MILLION)
FIGURE 100 INDIA B2B E-COMMERCE CURRENT AND FUTURE END USER ANALYSIS, 2025–2034, (USD MILLION)
FIGURE 101 SINGAPORE B2B E-COMMERCE CURRENT AND FUTURE TYPE ANALYSIS, 2025–2034, (USD MILLION)
FIGURE 102 SINGAPORE B2B E-COMMERCE CURRENT AND FUTURE END USER ANALYSIS, 2025–2034, (USD MILLION)
FIGURE 103 THAILAND B2B E-COMMERCE CURRENT AND FUTURE TYPE ANALYSIS, 2025–2034, (USD MILLION)
FIGURE 104 THAILAND B2B E-COMMERCE CURRENT AND FUTURE END USER ANALYSIS, 2025–2034, (USD MILLION)
FIGURE 105 TAIWAN B2B E-COMMERCE CURRENT AND FUTURE TYPE ANALYSIS, 2025–2034, (USD MILLION)
FIGURE 106 TAIWAN B2B E-COMMERCE CURRENT AND FUTURE END USER ANALYSIS, 2025–2034, (USD MILLION)
FIGURE 107 MALAYSIA B2B E-COMMERCE CURRENT AND FUTURE TYPE ANALYSIS, 2025–2034, (USD MILLION)
FIGURE 108 MALAYSIA B2B E-COMMERCE CURRENT AND FUTURE END USER ANALYSIS, 2025–2034, (USD MILLION)
FIGURE 109 REST OF SEA AND SOUTH ASIA B2B E-COMMERCE CURRENT AND FUTURE TYPE ANALYSIS, 2025–2034, (USD MILLION)
FIGURE 110 REST OF SEA AND SOUTH ASIA B2B E-COMMERCE CURRENT AND FUTURE END USER ANALYSIS, 2025–2034, (USD MILLION)
FIGURE 111 MIDDLE EAST AND AFRICA B2B E-COMMERCE CURRENT AND FUTURE MARKET VOLUME SHARE REGIONAL ANALYSIS, 2025–2034, (USD MILLION)
FIGURE 112 GCC COUNTRIES B2B E-COMMERCE CURRENT AND FUTURE TYPE ANALYSIS, 2025–2034, (USD MILLION)
FIGURE 113 GCC COUNTRIES B2B E-COMMERCE CURRENT AND FUTURE END USER ANALYSIS, 2025–2034, (USD MILLION)
FIGURE 114 SAUDI ARABIA B2B E-COMMERCE CURRENT AND FUTURE TYPE ANALYSIS, 2025–2034, (USD MILLION)
FIGURE 115 SAUDI ARABIA B2B E-COMMERCE CURRENT AND FUTURE END USER ANALYSIS, 2025–2034, (USD MILLION)
FIGURE 116 UAE B2B E-COMMERCE CURRENT AND FUTURE TYPE ANALYSIS, 2025–2034, (USD MILLION)
FIGURE 117 UAE B2B E-COMMERCE CURRENT AND FUTURE END USER ANALYSIS, 2025–2034, (USD MILLION)
FIGURE 118 BAHRAIN B2B E-COMMERCE CURRENT AND FUTURE TYPE ANALYSIS, 2025–2034, (USD MILLION)
FIGURE 119 BAHRAIN B2B E-COMMERCE CURRENT AND FUTURE END USER ANALYSIS, 2025–2034, (USD MILLION)
FIGURE 120 KUWAIT B2B E-COMMERCE CURRENT AND FUTURE TYPE ANALYSIS, 2025–2034, (USD MILLION)
FIGURE 121 KUWAIT B2B E-COMMERCE CURRENT AND FUTURE END USER ANALYSIS, 2025–2034, (USD MILLION)
FIGURE 122 OMAN B2B E-COMMERCE CURRENT AND FUTURE TYPE ANALYSIS, 2025–2034, (USD MILLION)
FIGURE 123 OMAN B2B E-COMMERCE CURRENT AND FUTURE END USER ANALYSIS, 2025–2034, (USD MILLION)
FIGURE 124 QATAR B2B E-COMMERCE CURRENT AND FUTURE TYPE ANALYSIS, 2025–2034, (USD MILLION)
FIGURE 125 QATAR B2B E-COMMERCE CURRENT AND FUTURE END USER ANALYSIS, 2025–2034, (USD MILLION)
FIGURE 126 EGYPT B2B E-COMMERCE CURRENT AND FUTURE TYPE ANALYSIS, 2025–2034, (USD MILLION)
FIGURE 127 EGYPT B2B E-COMMERCE CURRENT AND FUTURE END USER ANALYSIS, 2025–2034, (USD MILLION)
FIGURE 128 NIGERIA B2B E-COMMERCE CURRENT AND FUTURE TYPE ANALYSIS, 2025–2034, (USD MILLION)
FIGURE 129 NIGERIA B2B E-COMMERCE CURRENT AND FUTURE END USER ANALYSIS, 2025–2034, (USD MILLION)
FIGURE 130 SOUTH AFRICA B2B E-COMMERCE CURRENT AND FUTURE TYPE ANALYSIS, 2025–2034, (USD MILLION)
FIGURE 131 SOUTH AFRICA B2B E-COMMERCE CURRENT AND FUTURE END USER ANALYSIS, 2025–2034, (USD MILLION)
FIGURE 132 ISRAEL B2B E-COMMERCE CURRENT AND FUTURE TYPE ANALYSIS, 2025–2034, (USD MILLION)
FIGURE 133 ISRAEL B2B E-COMMERCE CURRENT AND FUTURE END USER ANALYSIS, 2025–2034, (USD MILLION)
FIGURE 134 REST OF MEA B2B E-COMMERCE CURRENT AND FUTURE TYPE ANALYSIS, 2025–2034, (USD MILLION)
FIGURE 135 REST OF MEA B2B E-COMMERCE CURRENT AND FUTURE END USER ANALYSIS, 2025–2034, (USD MILLION)
FIGURE 136 U. S. MARKET SHARE ANALYSIS BY TYPE (2024)
FIGURE 137 U. S. MARKET SHARE ANALYSIS BY END USER (2024)
FIGURE 138 CANADA MARKET SHARE ANALYSIS BY TYPE (2024)
FIGURE 139 CANADA MARKET SHARE ANALYSIS BY END USER (2024)
FIGURE 140 MEXICO MARKET SHARE ANALYSIS BY TYPE (2024)
FIGURE 141 MEXICO MARKET SHARE ANALYSIS BY END USER (2024)
FIGURE 142 CHINA MARKET SHARE ANALYSIS BY TYPE (2024)
FIGURE 143 CHINA MARKET SHARE ANALYSIS BY END USER (2024)
FIGURE 144 JAPAN MARKET SHARE ANALYSIS BY TYPE (2024)
FIGURE 145 JAPAN MARKET SHARE ANALYSIS BY END USER (2024)
FIGURE 146 INDIA MARKET SHARE ANALYSIS BY TYPE (2024)
FIGURE 147 INDIA MARKET SHARE ANALYSIS BY END USER (2024)
FIGURE 148 SOUTH KOREA MARKET SHARE ANALYSIS BY TYPE (2024)
FIGURE 149 SOUTH KOREA MARKET SHARE ANALYSIS BY END USER (2024)
FIGURE 150 SAUDI ARABIA MARKET SHARE ANALYSIS BY TYPE (2024)
FIGURE 151 SAUDI ARABIA MARKET SHARE ANALYSIS BY END USER (2024)
FIGURE 152 UAE MARKET SHARE ANALYSIS BY TYPE (2024)
FIGURE 153 UAE MARKET SHARE ANALYSIS BY END USER (2024)
FIGURE 154 EGYPT MARKET SHARE ANALYSIS BY TYPE (2024)
FIGURE 155 EGYPT MARKET SHARE ANALYSIS BY END USER (2024)
FIGURE 156 NIGERIA MARKET SHARE ANALYSIS BY TYPE (2024)
FIGURE 157 NIGERIA MARKET SHARE ANALYSIS BY END USER (2024)
FIGURE 158 SOUTH AFRICA MARKET SHARE ANALYSIS BY TYPE (2024)
FIGURE 159 SOUTH AFRICA MARKET SHARE ANALYSIS BY END USER (2024)
FIGURE 160 GERMANY MARKET SHARE ANALYSIS BY TYPE (2024)
FIGURE 161 GERMANY MARKET SHARE ANALYSIS BY END USER (2024)
FIGURE 162 FRANCE MARKET SHARE ANALYSIS BY TYPE (2024)
FIGURE 163 FRANCE MARKET SHARE ANALYSIS BY END USER (2024)
FIGURE 164 UK MARKET SHARE ANALYSIS BY TYPE (2024)
FIGURE 165 UK MARKET SHARE ANALYSIS BY END USER (2024)
FIGURE 166 SPAIN MARKET SHARE ANALYSIS BY TYPE (2024)
FIGURE 167 SPAIN MARKET SHARE ANALYSIS BY END USER (2024)
FIGURE 168 ITALY MARKET SHARE ANALYSIS BY TYPE (2024)
FIGURE 169 ITALY MARKET SHARE ANALYSIS BY END USER (2024)
FIGURE 170 BRAZIL MARKET SHARE ANALYSIS BY TYPE (2024)
FIGURE 171 BRAZIL MARKET SHARE ANALYSIS BY END USER (2024)
FIGURE 172 ARGENTINA MARKET SHARE ANALYSIS BY TYPE (2024)
FIGURE 173 ARGENTINA MARKET SHARE ANALYSIS BY END USER (2024)
FIGURE 174 COLUMBIA MARKET SHARE ANALYSIS BY TYPE (2024)
FIGURE 175 COLUMBIA MARKET SHARE ANALYSIS BY END USER (2024)
FIGURE 176 GLOBAL B2B E-COMMERCE CURRENT AND FUTURE MARKET KEY COUNTRY LEVEL ANALYSIS, 2024–2034, (USD MILLION)
FIGURE 177 FINANCIAL OVERVIEW:
Key Players Analysis
Amazon.com, Inc.: Amazon maintains its position as a dominant force in the B2B e-commerce landscape through Amazon Business, which leverages the company's extensive logistics network, vast product catalog, and advanced technology infrastructure to serve enterprise customers. The platform offers sophisticated procurement solutions including bulk pricing, quantity discounts, tax-exempt purchasing, and integrated approval workflows that cater to complex organizational requirements. Amazon's competitive advantage stems from its unparalleled fulfillment capabilities, with same-day and next-day delivery options supported by an extensive network of distribution centers and logistics partnerships that ensure reliable product availability and rapid order fulfillment.
Alibaba Group: Alibaba revolutionized global B2B e-commerce by creating the world's largest online marketplace connecting manufacturers, suppliers, and businesses across international markets. The platform's strength lies in its ability to facilitate cross-border trade, providing comprehensive tools for supplier verification, quality assurance, and international payment processing that reduce barriers to global commerce. Alibaba's competitive differentiation includes extensive supplier networks concentrated in manufacturing regions, particularly in Asia, enabling businesses to access cost-effective products directly from manufacturers while maintaining quality standards through verified supplier programs. The company's technology platform incorporates advanced search algorithms, real-time translation services, and secure payment systems that facilitate transactions between parties speaking different languages and operating under different regulatory frameworks.
Walmart Inc.: Walmart leverages its extensive retail expertise and supply chain capabilities to serve B2B customers through comprehensive wholesale and marketplace solutions. The company's competitive advantage includes established relationships with thousands of suppliers, sophisticated inventory management systems, and extensive distribution networks that enable efficient product sourcing and delivery across diverse geographic markets. Walmart's B2B strategy emphasizes value-driven pricing, bulk purchasing options, and comprehensive product categories spanning electronics, home goods, office supplies, and industrial equipment that meet diverse business requirements. Technology investments focus on developing integrated e-commerce platforms that connect with existing procurement systems, enabling seamless ordering processes and automated inventory management for business customers.
Market Key Players
Amazon.com, Inc.
Shopee Pte. Ltd.
ChinaAseanTrade.com
Shopify
DIYTrade.com
Dangdang
eBay Inc.
eworldtrade.com
Flipkart
Lazada Group
Alibaba Group
IndiaMART InterMESH Ltd.
KOMPASS
Quill Lincolnshire, Inc.
ASOS plc
Drivers
Digital Transformation Demand:
Digital transformation serves as the primary catalyst for B2B e-commerce growth, with businesses recognizing digital solutions as essential for modernizing procurement and achieving operational efficiency. Companies actively seek technologies to streamline transactions, enhance partner collaboration, and gain real-time supply chain insights. This transformation integrates advanced technologies like AI, machine learning, and cloud computing for automated decision-making and predictive analytics. Organizations leverage these capabilities to reduce manual processes, minimize errors, improve transaction accuracy, and accelerate order processing. The drive extends beyond simple automation to comprehensive ecosystem integration connecting suppliers, distributors, and customers through unified platforms, enabling greater value chain visibility and optimized resource allocation.
Evolving Customer Expectations:
B2B buyer behavior has fundamentally shifted, influenced by seamless B2C e-commerce experiences. Business buyers now expect intuitive, user-friendly interfaces with personalized product recommendations, dynamic pricing, and self-service capabilities. These elevated expectations include demands for efficient order processing, transparent communication channels, real-time tracking, and comprehensive customer support. Companies must invest in sophisticated customer experience technologies including AI-powered chatbots, personalized dashboards, and mobile-optimized platforms. The expectation for transparency extends to pricing structures, inventory availability, delivery schedules, and supplier performance metrics, driving platform development toward advanced personalization engines, sophisticated search capabilities, and integrated communication tools throughout the entire purchase journey.
Restraints
Security Concerns:
Security concerns represent the most significant barrier to B2B e-commerce adoption, with businesses expressing heightened anxiety about data breaches and cyber threats when transitioning to digital platforms. This reluctance particularly affects industries prioritizing confidentiality like healthcare, financial services, and government contracting. Concerns are amplified by sophisticated cyber attacks including ransomware, phishing, and data infiltration attempts. Companies worry about potential financial losses, regulatory penalties, and reputational damage from security incidents. The challenge extends beyond technical measures to compliance with evolving data protection regulations like GDPR and CCPA, requiring comprehensive security frameworks and audit capabilities. Significant investments in cybersecurity infrastructure create substantial upfront costs and ongoing operational expenses.
Dependence on Traditional Relationships:
Traditional relationship dependence constrains B2B e-commerce adoption as the sector has historically relied on personal connections, established networks, and face-to-face interactions built over extended periods. Many businesses remain hesitant to embrace digital platforms due to preferences for personal relationship management, direct supplier communication, and traditional negotiation processes involving in-person meetings. This reluctance is pronounced in industries with complex procurement requirements, customized specifications, or long-term contracts depending on personal trust. Organizations worry about losing personalized attention, flexible terms, and specialized support characterizing traditional relationships. Legacy procurement processes involve complex approval workflows and established vendor relationships developed over years, making digital transformation initiatives more complex and requiring hybrid approaches.
Opportunities
AI and Machine Learning Integration:
AI and machine learning integration presents transformative opportunities for B2B e-commerce platforms to revolutionize operational efficiency and customer experiences through intelligent automation. Machine learning algorithms enable personalized product recommendations by analyzing purchasing patterns and business requirements. AI-powered systems facilitate dynamic pricing models adjusting real-time based on market conditions and demand fluctuations. Predictive analytics capabilities allow demand forecasting, inventory optimization, and customer need anticipation. Natural language processing enables sophisticated chatbots providing instant support and guidance through complex ordering processes. Advanced AI systems automate supplier selection, contract management, and fraud detection, streamlining operations while reducing errors. Integration creates opportunities for innovative business models including predictive procurement services and intelligent supply chain optimization.
Blockchain Technology Implementation:
Blockchain technology offers substantial opportunities to address transparency, security, and trust challenges constraining B2B e-commerce adoption. Blockchain-based systems enable immutable transaction records providing complete supply chain transparency and traceability, allowing businesses to verify product authenticity and ensure regulatory compliance. Smart contracts automate complex business agreements including payment processing and delivery confirmation, reducing transaction costs and eliminating intermediaries. The technology enables secure, decentralized identity management protecting sensitive information while facilitating trusted transactions between unknown parties. Blockchain supports supply chain transparency initiatives demanded by customers and regulators, demonstrating ethical sourcing and environmental compliance. Integration with IoT devices enables comprehensive goods tracking and automated compliance reporting, reducing operational overhead while improving customer confidence.
Trends:
Automation and AI-Driven Personalization:
Automation and AI-driven personalization represents fundamental transformation in B2B e-commerce platform customization and process optimization. Businesses implement automated procurement systems utilizing AI to analyze purchasing patterns, predict inventory needs, and execute reordering without manual intervention. AI-powered recommendation engines analyze complex requirements and historical data to suggest relevant products and cost optimization opportunities. Machine learning algorithms enable dynamic pricing strategies automatically adjusting based on customer segments and market conditions. Chatbots powered by natural language processing provide instant support and guide users through sophisticated ordering processes. Predictive analytics enable demand anticipation and inventory optimization. The trend extends to automated supplier onboarding, performance monitoring, and risk assessment processes streamlining vendor management while ensuring compliance.
Cloud-Based Solutions and Mobile Optimization:
Cloud-based solutions and mobile optimization drive significant transformation in B2B e-commerce accessibility and operational flexibility. Cloud platforms enable businesses to integrate e-commerce systems with existing ERP, CRM, and supply chain solutions, creating unified digital ecosystems providing comprehensive operational visibility. Mobile-optimized platforms accommodate increasing demand for on-the-go procurement capabilities, allowing users to research products, submit orders, and track deliveries from mobile devices. Cloud solutions offer scalability advantages enabling capability expansion without significant infrastructure investments. Real-time data synchronization ensures inventory levels and pricing information remain consistently accurate across channels. The trend includes headless commerce architectures separating front-end experiences from back-end functionality, enabling customized interfaces while leveraging standardized capabilities and comprehensive business intelligence.
Recent Development
In July 2025: Alibaba.com and Wix have unveiled a groundbreaking strategic partnership that revolutionizes global B2B and D2C commerce by seamlessly integrating Alibaba's vast wholesale ecosystem with Wix's comprehensive website building and e-commerce infrastructure. This collaboration creates unprecedented opportunities for digital entrepreneurs, small businesses, and SMEs to expand their international reach across more than 200 countries and regions.
In June 2025: The Home Depot, recognized as the world's largest home improvement retailer, has announced a transformative strategic acquisition through its specialty trade distribution subsidiary, SRS Distribution Inc., which will acquire GMS Inc., establishing one of North America's most comprehensive specialty building products distribution networks. This definitive agreement represents a significant consolidation in the specialty building materials sector and positions The Home Depot to dramatically expand its professional contractor services and specialty trade capabilities.
Frequently Asked Questions
How big is the B2B E-commerce Market?
The Global B2B E-commerce Market is set to grow from USD 19.69 Trillion in 2024 to USD 99.81 Trillion by 2034, at a CAGR of 17.63%. Explore key trends, drivers, and future outlook.
Who are the major players in the B2B E-commerce Market?
Product Type (Automotive, Home & Kitchen, Consumer Electronics, Books & Stationery, Industrial & Science, Sports Apparel, Healthcare, Clothing, Beauty & Personal Care, Other Product Types), Deployment (Intermediary-Oriented, Supplier-Oriented, Buyer-Oriented), Platform (Marketplace Sales, Direct-Sales)
How can this market research report help my business make strategic decisions?
Our market research reports provide actionable intelligence, including verified market size data, CAGR projections, competitive benchmarking, and segment-level opportunity analysis. These insights support strategic planning, investment decisions, product development, and market entry strategies for enterprises and startups alike.
How frequently is the data updated?
We continuously monitor industry developments and update our reports to reflect regulatory changes, technological advancements, and macroeconomic shifts. Updated editions ensure you receive the latest market intelligence.