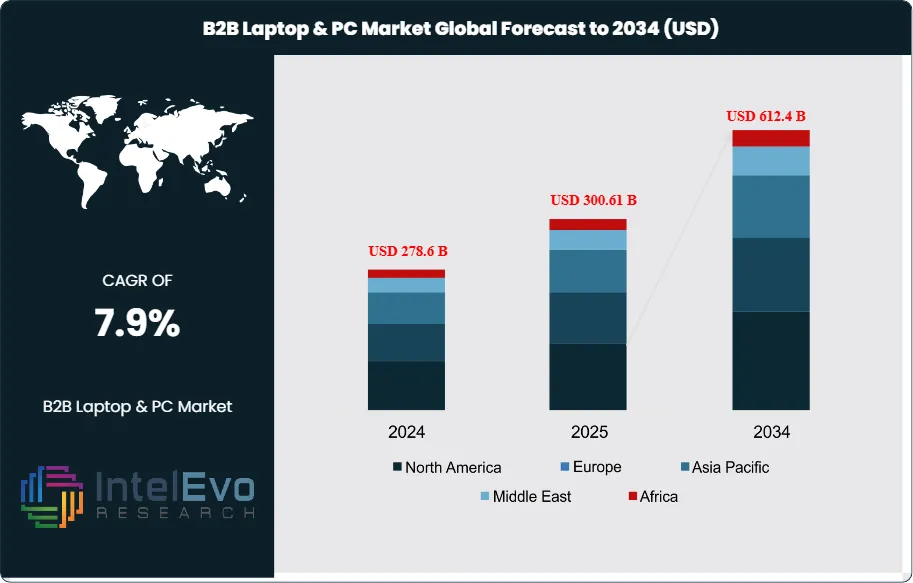
The B2B Laptop & PC Market is projected to grow from USD 278.6 Billion in 2024 to approximately USD 612.4 Billion by 2034, expanding at a CAGR of around 7.9% during 2025–2034. Business digital transformation and remote work adoption continue to boost corporate demand for high-performance laptops and PCs. The rise of AI-enabled devices, cloud computing integration, and enterprise-grade security systems is reshaping procurement preferences. Growing IT spending across SMEs and large enterprises globally is further accelerating market expansion. This driven by accelerated digital transformation and enterprise adoption of hybrid work models, offering strategic opportunities for technology providers, investors, and IT infrastructure leaders.
The market is undergoing rapid expansion as businesses across industries increasingly rely on digital platforms to streamline operations, strengthen productivity, and secure data-driven decision-making. Enterprises are prioritizing hardware upgrades to align with cloud-first strategies and advanced analytics initiatives, making high-performance laptops and PCs essential for day-to-day operations. The growing influence of hybrid and remote working has further heightened demand for portable, secure, and scalable computing solutions capable of ensuring seamless connectivity across distributed teams.
A key driver of market growth is the integration of advanced technologies such as artificial intelligence (AI), machine learning (ML), and big data analytics into enterprise workflows. Business-grade devices are increasingly being equipped with AI-driven functionalities, including predictive maintenance, automated security, and intelligent power optimization, which enhance both productivity and long-term device efficiency. Simultaneously, the adoption of bring-your-own-device (BYOD) policies is reinforcing the need for enterprise-ready hardware with robust security frameworks and cloud integration.
The competitive landscape is also shaped by rising demand from small and medium-sized enterprises (SMEs), which are scaling digital infrastructure to compete in a data-centric economy. This is driving preferences for lightweight, durable, and energy-efficient laptops designed to support complex business applications at cost-effective price points. Sustainability has emerged as another critical market force, with nearly one-quarter of B2B buyers factoring environmental impact into procurement decisions by 2023. Manufacturers are responding with eco-certified designs, recycled materials, and energy-efficient processors, aligning with corporate ESG objectives and regulatory requirements.
Regionally, North America and Europe remain leading markets due to early AI adoption and strict compliance standards, while Asia Pacific is the fastest-growing hub, supported by SME expansion, IT outsourcing, and government-backed digitalization initiatives. Industries such as finance, engineering, and creative sectors are fueling demand for premium devices with advanced processing power and security, further elevating opportunities for innovation.
Overall, the B2B Laptop & PC Market in 2025 and beyond is defined by the convergence of performance, security, sustainability, and AI innovation. Companies that align product portfolios with these evolving enterprise needs are best positioned to capture sustained demand and global investment momentum.
Market Growth: The Global B2B Laptop & PC Market is projected to reach USD 612.4 Billion by 2034, up from USD 278.6 Billion in 2024, registering a CAGR of 7.9% during 2025–2035. Growth is driven by digital transformation initiatives, hybrid work adoption, and enterprise demand for secure, high-performance devices.
Product Type: Laptops accounted for over 38.5% of total market share in 2023, driven by enterprise demand for mobility, lightweight form factors, and longer battery life. PCs continue to serve specialized applications requiring higher processing power.
Enterprise Size: Large enterprises led the market in 2023 with a 69.4% share, reflecting greater investment capacity in advanced IT infrastructure and premium business laptops with enhanced security features. SMEs, however, represent a fast-growing segment as they digitize operations.
Industry Vertical: The IT & Telecommunications sector captured more than 28.5% of market revenue in 2023, supported by strong demand for scalable computing solutions and rapid workforce expansion in global tech hubs. Finance and engineering sectors also exhibit significant demand for premium, high-performance laptops.
Driver: The accelerated shift toward cloud computing and adoption of AI, ML, and analytics platforms is compelling businesses to upgrade hardware, fostering continuous demand for advanced B2B laptops and PCs.
Restraint: High device replacement costs and increasing reliance on mobile-first solutions, such as tablets and smartphones, are limiting market penetration in cost-sensitive regions.
Opportunity: Sustainability-focused procurement is creating opportunities for manufacturers offering energy-efficient, recyclable, and eco-certified devices. As of 2023, 25% of B2B buyers considered environmental impact a key purchasing criterion.
Trend: AI integration is a rising trend, with over 41% of B2B laptops and PCs expected to feature AI-driven functionalities such as predictive maintenance and automated security by 2024, enhancing efficiency and security for enterprises.
Regional Analysis: North America and Europe remain leading markets due to mature IT ecosystems and strict data compliance regulations, while Asia Pacific is emerging as the fastest-growing region, fueled by SME expansion, digital infrastructure investment, and rising IT outsourcing hubs in India, China, and Southeast Asia.
Product Segment Analysis
As of 2025, laptops continue to lead the global B2B Laptop & PC Market, accounting for more than one-third of overall revenue. Their dominance is supported by the ongoing shift toward hybrid work, the need for lightweight yet high-performance devices, and growing enterprise adoption of mobility-driven solutions. Desktop PCs maintain a sizeable market share, particularly in corporate environments that value cost efficiency, hardware durability, and ease of scaling through bulk deployments.
Workstations retain a stable presence, serving industries that rely on high-end computing power, including engineering, architecture, finance, and media production. Tablet PCs are steadily gaining traction due to their portability and ability to integrate seamlessly with mobile enterprise applications, making them well-suited for education, retail, and field operations. Meanwhile, netbooks and handheld computers remain niche categories, targeting budget-conscious organizations and industries such as logistics and warehousing where mobility and real-time data access are critical. In addition, demand for HDMIs and related peripherals continues to expand as enterprises embrace multi-monitor setups to enhance productivity in hybrid offices. Collectively, these product segments illustrate how functionality, mobility, and cost-efficiency are shaping B2B hardware adoption.
Enterprise Size Segment Analysis
Large enterprises continue to dominate the B2B laptop and PC space in 2025, representing more than two-thirds of global demand. Their leadership stems from substantial IT budgets, global workforce expansion, and extensive digital transformation strategies that require robust investments in laptops, desktops, and workstations. Multinational corporations are increasingly procuring premium business laptops equipped with advanced security features, AI-driven performance optimization, and enhanced durability to align with long-term IT infrastructure planning.
Small and Medium Enterprises (SMEs), while a smaller segment in absolute terms, represent the fastest-growing demand base. Their growth is fueled by the adoption of cost-effective laptops and tablet PCs that support mobility, cloud-based operations, and flexible working environments. SMEs are also showing increasing interest in sustainable computing solutions, balancing affordability with eco-friendly procurement practices. Together, both enterprise segments highlight contrasting yet complementary growth patterns: large firms drive volume and high-value purchases, while SMEs shape demand through agility and rapid technology adoption.
Industry Vertical Segment Analysis
By 2025, IT & Telecommunications continues to hold the largest share of the B2B Laptop & PC Market, accounting for over 28% of revenue. The sector’s reliance on advanced computing solutions for software development, data centers, and network infrastructure makes it a consistent growth driver. Financial services represent another key vertical, as institutions invest heavily in secure, high-speed systems to support analytics, regulatory compliance, and real-time transactions.
Healthcare organizations are expanding their reliance on laptops and tablets to support electronic health records (EHRs), diagnostic imaging, and telemedicine platforms. Education is another fast-growing vertical, with institutions scaling digital learning initiatives and equipping teachers and students with portable devices. Manufacturing firms continue to leverage high-performance desktops and workstations to enable automation, product design, and digital twin applications, while retail and e-commerce players adopt portable solutions for supply chain management, inventory tracking, and customer engagement. Media & Entertainment industries remain among the highest users of specialized workstations for content creation, visual effects, and video editing. Beyond these, diverse sectors such as government and logistics also contribute steadily to overall market demand, reinforcing the universal role of computing hardware in enterprise operations.
Regional Analysis
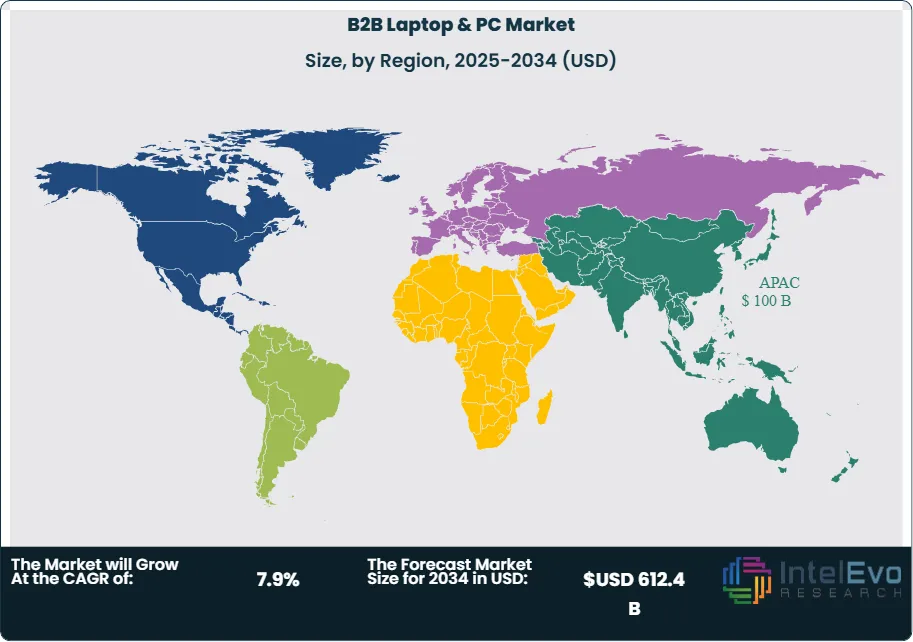
In 2025, Asia-Pacific stands out as the fastest-growing regional market, expected to surpass USD 100 Billion in value by the end of the year. The region benefits from rapid industrialization, widespread SME digitization, and rising IT expenditure in China, India, and Southeast Asian economies. Government-led initiatives supporting digital infrastructure and education also add momentum to the adoption of enterprise-grade laptops and PCs.
North America continues to account for roughly one-third of global market revenue, supported by advanced IT infrastructure, strong enterprise procurement, and early adoption of AI-driven computing systems. Europe, meanwhile, is distinguished by its strong emphasis on sustainability, where enterprises are increasingly demanding energy-efficient and eco-certified devices to align with environmental regulations. Latin America and the Middle East & Africa, while still emerging markets, are showing steady growth as enterprises in these regions ramp up IT spending to modernize operations and integrate digital solutions. Collectively, regional variations reflect a balance between mature markets focused on sustainability and performance, and fast-emerging economies driving volume growth through expanding digital ecosystems.
By Product (Laptops, Desktop PCs, Workstations, Netbooks, Tablet PCs, HDMIs, Handheld Computers), By Enterprise Size (Large Enterprises, Small & Medium Enterprises), By Industry Vertical (IT & Telecommunication, Financial Services, Healthcare, Education, Manufacturing, Retail & E-commerce, Media & Entertainment, Others)
Research Methodology
Primary Research- 100 Interviews of Stakeholders
Secondary Research
Desk Research
Regional scope
North America (United States, Canada, Mexico)
Latin America (Brazil, Argentina, Columbia)
East Asia And Pacific (China, Japan, South Korea, Australia, Cambodia, Fiji, Indonesia)
Sea And South Asia (India, Singapore, Thailand, Taiwan, Malaysia)
Eastern Europe (Poland, Russia, Czech Republic, Romania)
Western Europe (Germany, U.K., France, Spain, Itlay)
Middle East & Africa (GCC Countries, Egypt, Nigeria, South Africa, Israel)
Competitive Landscape
HP Inc., Lenovo Group Limited, Sony Corporation, ASUSTek Computer Inc., Apple Inc., Toshiba Corporation, Acer Inc., Dell Inc., Other Key Players
Customization Scope
Customization for segments, region/country-level will be provided. Moreover, additional customization can be done based on the requirements.
Pricing and Purchase Options
Avail customized purchase options to meet your exact research needs. We have three licenses to opt for: Single User License, Multi-User License (Up to 5 Users), Corporate Use License (Unlimited User and Printable PDF).
TABLE OF CONTENTS
1. EXECUTIVE SUMMARY
1.1. MARKET SNAPSHOT
1.2. KEY FINDINGS & INSIGHTS
1.3. ANALYST RECOMMENDATIONS
1.4. FUTURE OUTLOOK
2. RESEARCH METHODOLOGY
2.1. MARKET DEFINITION & SCOPE
2.2. RESEARCH OBJECTIVES: PRIMARY & SECONDARY DATA SOURCES
2.3. DATA COLLECTION SOURCES
2.3.1. COVERAGE OF 100+ PRIMARY RESEARCH/CONSULTATION CALLS WITH INDUSTRY STAKEHOLDERS
FIGURE 17 NORTH AMERICA B2B LAPTOP & PC CURRENT AND FUTURE TYPE ANALYSIS, 2025–2034, (USD MILLION)
FIGURE 18 NORTH AMERICA B2B LAPTOP & PC CURRENT AND FUTURE END USER ANALYSIS, 2025–2034, (USD MILLION)
FIGURE 19 MARKET SHARE BY COUNTRY
FIGURE 20 LATIN AMERICA B2B LAPTOP & PC CURRENT AND FUTURE TYPE ANALYSIS, 2025–2034, (USD MILLION)
FIGURE 21 LATIN AMERICA B2B LAPTOP & PC CURRENT AND FUTURE END USER ANALYSIS, 2025–2034, (USD MILLION)
FIGURE 22 MARKET SHARE BY COUNTRY
FIGURE 23 EASTERN EUROPE B2B LAPTOP & PC CURRENT AND FUTURE TYPE ANALYSIS, 2025–2034, (USD MILLION)
FIGURE 24 EASTERN EUROPE B2B LAPTOP & PC CURRENT AND FUTURE END USER ANALYSIS, 2025–2034, (USD MILLION)
FIGURE 25 MARKET SHARE BY COUNTRY
FIGURE 26 WESTERN EUROPE B2B LAPTOP & PC CURRENT AND FUTURE TYPE ANALYSIS, 2025–2034, (USD MILLION)
FIGURE 27 WESTERN EUROPE B2B LAPTOP & PC CURRENT AND FUTURE END USER ANALYSIS, 2025–2034, (USD MILLION)
FIGURE 28 MARKET SHARE BY COUNTRY
FIGURE 29 EAST ASIA AND PACIFIC B2B LAPTOP & PC CURRENT AND FUTURE TYPE ANALYSIS, 2025–2034, (USD MILLION)
FIGURE 30 EAST ASIA AND PACIFIC B2B LAPTOP & PC CURRENT AND FUTURE END USER ANALYSIS, 2025–2034, (USD MILLION)
FIGURE 31 MARKET SHARE BY COUNTRY
FIGURE 32 SEA AND SOUTH ASIA B2B LAPTOP & PC CURRENT AND FUTURE TYPE ANALYSIS, 2025–2034, (USD MILLION)
FIGURE 33 SEA AND SOUTH ASIA B2B LAPTOP & PC CURRENT AND FUTURE END USER ANALYSIS, 2025–2034, (USD MILLION)
FIGURE 34 MARKET SHARE BY COUNTRY
FIGURE 35 MIDDLE EAST AND AFRICA B2B LAPTOP & PC CURRENT AND FUTURE TYPE ANALYSIS, 2025–2034, (USD MILLION)
FIGURE 36 MIDDLE EAST AND AFRICA B2B LAPTOP & PC CURRENT AND FUTURE END USER ANALYSIS, 2025–2034, (USD MILLION)
FIGURE 37 NORTH AMERICA B2B LAPTOP & PC CURRENT AND FUTURE MARKET VOLUME SHARE REGIONAL ANALYSIS, 2025–2034, (USD MILLION)
FIGURE 38 U.S. B2B LAPTOP & PC CURRENT AND FUTURE TYPE ANALYSIS, 2025–2034, (USD MILLION)
FIGURE 39 U.S. B2B LAPTOP & PC CURRENT AND FUTURE END USER ANALYSIS, 2025–2034, (USD MILLION)
FIGURE 40 CANADA B2B LAPTOP & PC CURRENT AND FUTURE TYPE ANALYSIS, 2025–2034, (USD MILLION)
FIGURE 41 CANADA B2B LAPTOP & PC CURRENT AND FUTURE END USER ANALYSIS, 2025–2034, (USD MILLION)
FIGURE 42 LATIN AMERICA B2B LAPTOP & PC CURRENT AND FUTURE MARKET VOLUME SHARE REGIONAL ANALYSIS, 2025–2034, (USD MILLION)
FIGURE 43 MEXICO B2B LAPTOP & PC CURRENT AND FUTURE TYPE ANALYSIS, 2025–2034, (USD MILLION)
FIGURE 44 MEXICO B2B LAPTOP & PC CURRENT AND FUTURE END USER ANALYSIS, 2025–2034, (USD MILLION)
FIGURE 45 BRAZIL B2B LAPTOP & PC CURRENT AND FUTURE TYPE ANALYSIS, 2025–2034, (USD MILLION)
FIGURE 46 BRAZIL B2B LAPTOP & PC CURRENT AND FUTURE END USER ANALYSIS, 2025–2034, (USD MILLION)
FIGURE 47 ARGENTINA B2B LAPTOP & PC CURRENT AND FUTURE TYPE ANALYSIS, 2025–2034, (USD MILLION)
FIGURE 48 ARGENTINA B2B LAPTOP & PC CURRENT AND FUTURE END USER ANALYSIS, 2025–2034, (USD MILLION)
FIGURE 49 COLUMBIA B2B LAPTOP & PC CURRENT AND FUTURE TYPE ANALYSIS, 2025–2034, (USD MILLION)
FIGURE 50 COLUMBIA B2B LAPTOP & PC CURRENT AND FUTURE END USER ANALYSIS, 2025–2034, (USD MILLION)
FIGURE 51 REST OF LATIN AMERICA B2B LAPTOP & PC CURRENT AND FUTURE TYPE ANALYSIS, 2025–2034, (USD MILLION)
FIGURE 52 REST OF LATIN AMERICA B2B LAPTOP & PC CURRENT AND FUTURE END USER ANALYSIS, 2025–2034, (USD MILLION)
FIGURE 53 EASTERN EUROPE B2B LAPTOP & PC CURRENT AND FUTURE MARKET VOLUME SHARE REGIONAL ANALYSIS, 2025–2034, (USD MILLION)
FIGURE 54 POLAND B2B LAPTOP & PC CURRENT AND FUTURE TYPE ANALYSIS, 2025–2034, (USD MILLION)
FIGURE 55 POLAND B2B LAPTOP & PC CURRENT AND FUTURE END USER ANALYSIS, 2025–2034, (USD MILLION)
FIGURE 56 RUSSIA B2B LAPTOP & PC CURRENT AND FUTURE TYPE ANALYSIS, 2025–2034, (USD MILLION)
FIGURE 57 RUSSIA B2B LAPTOP & PC CURRENT AND FUTURE END USER ANALYSIS, 2025–2034, (USD MILLION)
FIGURE 58 CZECH REPUBLIC B2B LAPTOP & PC CURRENT AND FUTURE TYPE ANALYSIS, 2025–2034, (USD MILLION)
FIGURE 59 CZECH REPUBLIC B2B LAPTOP & PC CURRENT AND FUTURE END USER ANALYSIS, 2025–2034, (USD MILLION)
FIGURE 60 ROMANIA B2B LAPTOP & PC CURRENT AND FUTURE TYPE ANALYSIS, 2025–2034, (USD MILLION)
FIGURE 61 ROMANIA B2B LAPTOP & PC CURRENT AND FUTURE END USER ANALYSIS, 2025–2034, (USD MILLION)
FIGURE 62 REST OF EASTERN EUROPE B2B LAPTOP & PC CURRENT AND FUTURE TYPE ANALYSIS, 2025–2034, (USD MILLION)
FIGURE 63 REST OF EASTERN EUROPE B2B LAPTOP & PC CURRENT AND FUTURE END USER ANALYSIS, 2025–2034, (USD MILLION)
FIGURE 64 WESTERN EUROPE B2B LAPTOP & PC CURRENT AND FUTURE MARKET VOLUME SHARE REGIONAL ANALYSIS, 2025–2034, (USD MILLION)
FIGURE 65 GERMANY B2B LAPTOP & PC CURRENT AND FUTURE TYPE ANALYSIS, 2025–2034, (USD MILLION)
FIGURE 66 GERMANY B2B LAPTOP & PC CURRENT AND FUTURE END USER ANALYSIS, 2025–2034, (USD MILLION)
FIGURE 67 FRANCE B2B LAPTOP & PC CURRENT AND FUTURE TYPE ANALYSIS, 2025–2034, (USD MILLION)
FIGURE 68 FRANCE B2B LAPTOP & PC CURRENT AND FUTURE END USER ANALYSIS, 2025–2034, (USD MILLION)
FIGURE 69 UK B2B LAPTOP & PC CURRENT AND FUTURE TYPE ANALYSIS, 2025–2034, (USD MILLION)
FIGURE 70 UK B2B LAPTOP & PC CURRENT AND FUTURE END USER ANALYSIS, 2025–2034, (USD MILLION)
FIGURE 71 SPAIN B2B LAPTOP & PC CURRENT AND FUTURE TYPE ANALYSIS, 2025–2034, (USD MILLION)
FIGURE 72 SPAIN B2B LAPTOP & PC CURRENT AND FUTURE END USER ANALYSIS, 2025–2034, (USD MILLION)
FIGURE 73 ITALY B2B LAPTOP & PC CURRENT AND FUTURE TYPE ANALYSIS, 2025–2034, (USD MILLION)
FIGURE 74 ITALY B2B LAPTOP & PC CURRENT AND FUTURE END USER ANALYSIS, 2025–2034, (USD MILLION)
FIGURE 75 REST OF WESTERN EUROPE B2B LAPTOP & PC CURRENT AND FUTURE TYPE ANALYSIS, 2025–2034, (USD MILLION)
FIGURE 76 REST OF WESTERN EUROPE B2B LAPTOP & PC CURRENT AND FUTURE END USER ANALYSIS, 2025–2034, (USD MILLION)
FIGURE 77 EAST ASIA AND PACIFIC B2B LAPTOP & PC CURRENT AND FUTURE MARKET VOLUME SHARE REGIONAL ANALYSIS, 2025–2034, (USD MILLION)
FIGURE 78 CHINA B2B LAPTOP & PC CURRENT AND FUTURE TYPE ANALYSIS, 2025–2034, (USD MILLION)
FIGURE 79 CHINA B2B LAPTOP & PC CURRENT AND FUTURE END USER ANALYSIS, 2025–2034, (USD MILLION)
FIGURE 80 JAPAN B2B LAPTOP & PC CURRENT AND FUTURE TYPE ANALYSIS, 2025–2034, (USD MILLION)
FIGURE 81 JAPAN B2B LAPTOP & PC CURRENT AND FUTURE END USER ANALYSIS, 2025–2034, (USD MILLION)
FIGURE 82 AUSTRALIA B2B LAPTOP & PC CURRENT AND FUTURE TYPE ANALYSIS, 2025–2034, (USD MILLION)
FIGURE 83 AUSTRALIA B2B LAPTOP & PC CURRENT AND FUTURE END USER ANALYSIS, 2025–2034, (USD MILLION)
FIGURE 84 CAMBODIA B2B LAPTOP & PC CURRENT AND FUTURE TYPE ANALYSIS, 2025–2034, (USD MILLION)
FIGURE 85 CAMBODIA B2B LAPTOP & PC CURRENT AND FUTURE END USER ANALYSIS, 2025–2034, (USD MILLION)
FIGURE 86 FIJI B2B LAPTOP & PC CURRENT AND FUTURE TYPE ANALYSIS, 2025–2034, (USD MILLION)
FIGURE 87 FIJI B2B LAPTOP & PC CURRENT AND FUTURE END USER ANALYSIS, 2025–2034, (USD MILLION)
FIGURE 88 INDONESIA B2B LAPTOP & PC CURRENT AND FUTURE TYPE ANALYSIS, 2025–2034, (USD MILLION)
FIGURE 89 INDONESIA B2B LAPTOP & PC CURRENT AND FUTURE END USER ANALYSIS, 2025–2034, (USD MILLION)
FIGURE 90 SOUTH KOREA B2B LAPTOP & PC CURRENT AND FUTURE TYPE ANALYSIS, 2025–2034, (USD MILLION)
FIGURE 91 SOUTH KOREA B2B LAPTOP & PC CURRENT AND FUTURE END USER ANALYSIS, 2025–2034, (USD MILLION)
FIGURE 92 REST OF EAST ASIA AND PACIFIC B2B LAPTOP & PC CURRENT AND FUTURE TYPE ANALYSIS, 2025–2034, (USD MILLION)
FIGURE 93 REST OF EAST ASIA AND PACIFIC B2B LAPTOP & PC CURRENT AND FUTURE END USER ANALYSIS, 2025–2034, (USD MILLION)
FIGURE 94 SEA AND SOUTH ASIA B2B LAPTOP & PC CURRENT AND FUTURE MARKET VOLUME SHARE REGIONAL ANALYSIS, 2025–2034, (USD MILLION)
FIGURE 95 BANGLADESH B2B LAPTOP & PC CURRENT AND FUTURE TYPE ANALYSIS, 2025–2034, (USD MILLION)
FIGURE 96 BANGLADESH B2B LAPTOP & PC CURRENT AND FUTURE END USER ANALYSIS, 2025–2034, (USD MILLION)
FIGURE 97 NEW ZEALAND B2B LAPTOP & PC CURRENT AND FUTURE TYPE ANALYSIS, 2025–2034, (USD MILLION)
FIGURE 98 NEW ZEALAND B2B LAPTOP & PC CURRENT AND FUTURE END USER ANALYSIS, 2025–2034, (USD MILLION)
FIGURE 99 INDIA B2B LAPTOP & PC CURRENT AND FUTURE TYPE ANALYSIS, 2025–2034, (USD MILLION)
FIGURE 100 INDIA B2B LAPTOP & PC CURRENT AND FUTURE END USER ANALYSIS, 2025–2034, (USD MILLION)
FIGURE 101 SINGAPORE B2B LAPTOP & PC CURRENT AND FUTURE TYPE ANALYSIS, 2025–2034, (USD MILLION)
FIGURE 102 SINGAPORE B2B LAPTOP & PC CURRENT AND FUTURE END USER ANALYSIS, 2025–2034, (USD MILLION)
FIGURE 103 THAILAND B2B LAPTOP & PC CURRENT AND FUTURE TYPE ANALYSIS, 2025–2034, (USD MILLION)
FIGURE 104 THAILAND B2B LAPTOP & PC CURRENT AND FUTURE END USER ANALYSIS, 2025–2034, (USD MILLION)
FIGURE 105 TAIWAN B2B LAPTOP & PC CURRENT AND FUTURE TYPE ANALYSIS, 2025–2034, (USD MILLION)
FIGURE 106 TAIWAN B2B LAPTOP & PC CURRENT AND FUTURE END USER ANALYSIS, 2025–2034, (USD MILLION)
FIGURE 107 MALAYSIA B2B LAPTOP & PC CURRENT AND FUTURE TYPE ANALYSIS, 2025–2034, (USD MILLION)
FIGURE 108 MALAYSIA B2B LAPTOP & PC CURRENT AND FUTURE END USER ANALYSIS, 2025–2034, (USD MILLION)
FIGURE 109 REST OF SEA AND SOUTH ASIA B2B LAPTOP & PC CURRENT AND FUTURE TYPE ANALYSIS, 2025–2034, (USD MILLION)
FIGURE 110 REST OF SEA AND SOUTH ASIA B2B LAPTOP & PC CURRENT AND FUTURE END USER ANALYSIS, 2025–2034, (USD MILLION)
FIGURE 111 MIDDLE EAST AND AFRICA B2B LAPTOP & PC CURRENT AND FUTURE MARKET VOLUME SHARE REGIONAL ANALYSIS, 2025–2034, (USD MILLION)
FIGURE 112 GCC COUNTRIES B2B LAPTOP & PC CURRENT AND FUTURE TYPE ANALYSIS, 2025–2034, (USD MILLION)
FIGURE 113 GCC COUNTRIES B2B LAPTOP & PC CURRENT AND FUTURE END USER ANALYSIS, 2025–2034, (USD MILLION)
FIGURE 114 SAUDI ARABIA B2B LAPTOP & PC CURRENT AND FUTURE TYPE ANALYSIS, 2025–2034, (USD MILLION)
FIGURE 115 SAUDI ARABIA B2B LAPTOP & PC CURRENT AND FUTURE END USER ANALYSIS, 2025–2034, (USD MILLION)
FIGURE 116 UAE B2B LAPTOP & PC CURRENT AND FUTURE TYPE ANALYSIS, 2025–2034, (USD MILLION)
FIGURE 117 UAE B2B LAPTOP & PC CURRENT AND FUTURE END USER ANALYSIS, 2025–2034, (USD MILLION)
FIGURE 118 BAHRAIN B2B LAPTOP & PC CURRENT AND FUTURE TYPE ANALYSIS, 2025–2034, (USD MILLION)
FIGURE 119 BAHRAIN B2B LAPTOP & PC CURRENT AND FUTURE END USER ANALYSIS, 2025–2034, (USD MILLION)
FIGURE 120 KUWAIT B2B LAPTOP & PC CURRENT AND FUTURE TYPE ANALYSIS, 2025–2034, (USD MILLION)
FIGURE 121 KUWAIT B2B LAPTOP & PC CURRENT AND FUTURE END USER ANALYSIS, 2025–2034, (USD MILLION)
FIGURE 122 OMAN B2B LAPTOP & PC CURRENT AND FUTURE TYPE ANALYSIS, 2025–2034, (USD MILLION)
FIGURE 123 OMAN B2B LAPTOP & PC CURRENT AND FUTURE END USER ANALYSIS, 2025–2034, (USD MILLION)
FIGURE 124 QATAR B2B LAPTOP & PC CURRENT AND FUTURE TYPE ANALYSIS, 2025–2034, (USD MILLION)
FIGURE 125 QATAR B2B LAPTOP & PC CURRENT AND FUTURE END USER ANALYSIS, 2025–2034, (USD MILLION)
FIGURE 126 EGYPT B2B LAPTOP & PC CURRENT AND FUTURE TYPE ANALYSIS, 2025–2034, (USD MILLION)
FIGURE 127 EGYPT B2B LAPTOP & PC CURRENT AND FUTURE END USER ANALYSIS, 2025–2034, (USD MILLION)
FIGURE 128 NIGERIA B2B LAPTOP & PC CURRENT AND FUTURE TYPE ANALYSIS, 2025–2034, (USD MILLION)
FIGURE 129 NIGERIA B2B LAPTOP & PC CURRENT AND FUTURE END USER ANALYSIS, 2025–2034, (USD MILLION)
FIGURE 130 SOUTH AFRICA B2B LAPTOP & PC CURRENT AND FUTURE TYPE ANALYSIS, 2025–2034, (USD MILLION)
FIGURE 131 SOUTH AFRICA B2B LAPTOP & PC CURRENT AND FUTURE END USER ANALYSIS, 2025–2034, (USD MILLION)
FIGURE 132 ISRAEL B2B LAPTOP & PC CURRENT AND FUTURE TYPE ANALYSIS, 2025–2034, (USD MILLION)
FIGURE 133 ISRAEL B2B LAPTOP & PC CURRENT AND FUTURE END USER ANALYSIS, 2025–2034, (USD MILLION)
FIGURE 134 REST OF MEA B2B LAPTOP & PC CURRENT AND FUTURE TYPE ANALYSIS, 2025–2034, (USD MILLION)
FIGURE 135 REST OF MEA B2B LAPTOP & PC CURRENT AND FUTURE END USER ANALYSIS, 2025–2034, (USD MILLION)
FIGURE 136 U. S. MARKET SHARE ANALYSIS BY TYPE (2024)
FIGURE 137 U. S. MARKET SHARE ANALYSIS BY END USER (2024)
FIGURE 138 CANADA MARKET SHARE ANALYSIS BY TYPE (2024)
FIGURE 139 CANADA MARKET SHARE ANALYSIS BY END USER (2024)
FIGURE 140 MEXICO MARKET SHARE ANALYSIS BY TYPE (2024)
FIGURE 141 MEXICO MARKET SHARE ANALYSIS BY END USER (2024)
FIGURE 142 CHINA MARKET SHARE ANALYSIS BY TYPE (2024)
FIGURE 143 CHINA MARKET SHARE ANALYSIS BY END USER (2024)
FIGURE 144 JAPAN MARKET SHARE ANALYSIS BY TYPE (2024)
FIGURE 145 JAPAN MARKET SHARE ANALYSIS BY END USER (2024)
FIGURE 146 INDIA MARKET SHARE ANALYSIS BY TYPE (2024)
FIGURE 147 INDIA MARKET SHARE ANALYSIS BY END USER (2024)
FIGURE 148 SOUTH KOREA MARKET SHARE ANALYSIS BY TYPE (2024)
FIGURE 149 SOUTH KOREA MARKET SHARE ANALYSIS BY END USER (2024)
FIGURE 150 SAUDI ARABIA MARKET SHARE ANALYSIS BY TYPE (2024)
FIGURE 151 SAUDI ARABIA MARKET SHARE ANALYSIS BY END USER (2024)
FIGURE 152 UAE MARKET SHARE ANALYSIS BY TYPE (2024)
FIGURE 153 UAE MARKET SHARE ANALYSIS BY END USER (2024)
FIGURE 154 EGYPT MARKET SHARE ANALYSIS BY TYPE (2024)
FIGURE 155 EGYPT MARKET SHARE ANALYSIS BY END USER (2024)
FIGURE 156 NIGERIA MARKET SHARE ANALYSIS BY TYPE (2024)
FIGURE 157 NIGERIA MARKET SHARE ANALYSIS BY END USER (2024)
FIGURE 158 SOUTH AFRICA MARKET SHARE ANALYSIS BY TYPE (2024)
FIGURE 159 SOUTH AFRICA MARKET SHARE ANALYSIS BY END USER (2024)
FIGURE 160 GERMANY MARKET SHARE ANALYSIS BY TYPE (2024)
FIGURE 161 GERMANY MARKET SHARE ANALYSIS BY END USER (2024)
FIGURE 162 FRANCE MARKET SHARE ANALYSIS BY TYPE (2024)
FIGURE 163 FRANCE MARKET SHARE ANALYSIS BY END USER (2024)
FIGURE 164 UK MARKET SHARE ANALYSIS BY TYPE (2024)
FIGURE 165 UK MARKET SHARE ANALYSIS BY END USER (2024)
FIGURE 166 SPAIN MARKET SHARE ANALYSIS BY TYPE (2024)
FIGURE 167 SPAIN MARKET SHARE ANALYSIS BY END USER (2024)
FIGURE 168 ITALY MARKET SHARE ANALYSIS BY TYPE (2024)
FIGURE 169 ITALY MARKET SHARE ANALYSIS BY END USER (2024)
FIGURE 170 BRAZIL MARKET SHARE ANALYSIS BY TYPE (2024)
FIGURE 171 BRAZIL MARKET SHARE ANALYSIS BY END USER (2024)
FIGURE 172 ARGENTINA MARKET SHARE ANALYSIS BY TYPE (2024)
FIGURE 173 ARGENTINA MARKET SHARE ANALYSIS BY END USER (2024)
FIGURE 174 COLUMBIA MARKET SHARE ANALYSIS BY TYPE (2024)
FIGURE 175 COLUMBIA MARKET SHARE ANALYSIS BY END USER (2024)
FIGURE 176 GLOBAL B2B LAPTOP & PC CURRENT AND FUTURE MARKET KEY COUNTRY LEVEL ANALYSIS, 2024–2034, (USD MILLION)
FIGURE 177 FINANCIAL OVERVIEW:
Key Player Analysis
Lenovo Group Limited: Lenovo remains a global leader in the B2B computing landscape, with a strong foothold in enterprise-grade laptops and workstations tailored for data-intensive workflows. In 2025, the company has expanded its portfolio with AI-accelerated devices that support advanced construction applications such as digital twin simulations and real-time project analytics. Through its ThinkPad and ThinkStation series, Lenovo is positioning itself as a critical enabler of generative AI adoption in construction, offering optimized performance for BIM platforms and large-scale modeling tasks. Strategic investments in edge AI and sustainability-focused product lines further enhance Lenovo’s competitiveness, particularly among enterprises pursuing low-carbon digital infrastructure.
Dell Inc.: Dell continues to strengthen its role as a technology innovator by embedding AI-driven capabilities across its Latitude and Precision product lines. The company has strategically aligned with leading cloud and construction software providers to ensure seamless integration with tools such as Autodesk Revit and Oracle’s Construction Cloud. In 2025, Dell’s focus on high-performance workstations and secure mobility solutions makes it a preferred choice for construction firms handling generative AI-enabled design and digital project management. Its differentiator lies in enterprise-grade customization and advanced cybersecurity frameworks, which address growing concerns around intellectual property protection in AI-driven workflows.
Acer Inc.: Acer, traditionally recognized for its cost-competitive offerings, is carving a niche in the B2B segment by developing AI-ready laptops and portable devices optimized for SMEs in the construction sector. In 2025, the company has positioned itself as an agile disruptor, emphasizing accessibility of AI-powered tools for smaller construction firms engaged in modular building and rapid prototyping. Acer’s partnerships with regional construction technology startups have helped it introduce lightweight devices that support cloud-hosted BIM and real-time collaboration platforms. Its differentiator is affordability without compromising on AI integration, making it an attractive option for cost-sensitive enterprises expanding digital transformation initiatives.
ASUSTek Computer Inc.: ASUS has steadily advanced from a hardware supplier to an innovation-driven player in AI-enhanced computing for construction applications. By 2025, its ProArt and ExpertBook series are equipped with built-in AI accelerators, catering to architectural visualization, parametric design, and project simulation workflows. The company has invested in sustainability through eco-certified devices while also targeting high-growth markets in Asia-Pacific where modular construction and AI adoption are expanding rapidly. ASUS differentiates itself through performance-optimized GPUs and collaborative partnerships with software developers, enabling its devices to handle generative AI tasks, complex rendering, and immersive design environments with efficiency.
Market Key Players
HP Inc.
Lenovo Group Limited
Sony Corporation
ASUSTek Computer Inc.
Apple Inc.
Toshiba Corporation
Acer Inc.
Dell Inc.
Other Key Players
Driver
Rising Digital Transformation and Hybrid Work Adoption
The main factor driving the B2B Laptop and PC Market in 2025 is the fast adoption of digital transformation initiatives by global companies. Organizations are increasingly moving to cloud-first environments and data-focused workflows. This shift requires high-performance computing devices that can support collaboration, analytics, and secure remote access. The widespread transition to hybrid and remote work has increased the demand for portable, powerful, and secure laptops that provide seamless connectivity for distributed teams. Additionally, the integration of AI and machine learning is changing the preferences for enterprise hardware. This technology allows for predictive device maintenance, smarter power management, and an improved user experience. Together, these factors are significantly boosting long-term market growth.
Restraint
High Replacement Costs and Competition from Mobile Devices
Despite strong growth, the market faces significant challenges in cost-sensitive areas where high device replacement and upgrade costs create financial difficulties. Laptops and PCs used in businesses need regular updates to maintain performance, cybersecurity compliance, and compatibility with changing cloud platforms. However, frequent upgrades can strain budgets for small and medium-sized companies. Additionally, the growing use of mobile-first solutions, such as tablets and smartphones with productivity features, is reducing the reliance on traditional laptops and PCs for certain tasks. Security risks linked to remote work and device theft also make operations more complex. These issues may slow adoption in organizations with limited digital readiness or lower IT investment capabilities.
Opportunity
Sustainability-Driven Procurement and Eco-Efficient Devices
A significant growth opportunity comes from the increasing focus on sustainable purchasing strategies in enterprise IT spending. Companies are prioritizing laptops and PCs made from recyclable materials, energy-efficient processors, and eco-certified manufacturing practices to meet ESG and carbon reduction goals. By 2025, sustainability will be a key factor in corporate hardware purchasing, with many organizations seeking devices that lessen environmental impact without sacrificing performance. Manufacturers that provide long-lasting components, easy-to-repair designs, and carbon-neutral product lines are in a strong position to meet growing demand. This trend supports innovation in green computing solutions and helps suppliers stand out in competitive B2B hardware markets. As environmental compliance regulations become stricter worldwide, sustainability-driven procurement will continue to create long-term market opportunities.
Trend
Integration of AI-Powered Functionalities in Enterprise Devices
A key trend in the B2B Laptop and PC Market is the quick integration of AI-driven features in enterprise computing systems. By 2024, over 40% of new business laptops will include embedded NPUs. This advancement enables real-time productivity improvements such as automated security monitoring, intelligent performance optimization, and contextual user support. AI-powered collaboration tools are enhancing communication among remote teams, while predictive analytics help IT departments manage device fleets more effectively. The rise of on-device AI, combined with secure cloud connectivity, is changing how businesses deploy and oversee computing infrastructure on a large scale. As generative AI, digital assistants, and advanced automation become mainstream, AI-enabled hardware is expected to set the performance standard for business computing.
Recent Developments
December 2024 – Lenovo: Lenovo expanded its AI PC portfolio with new ThinkBook and ThinkPad models powered by AMD Ryzen AI processors and Snapdragon X Plus chips. The company also enhanced its ThinkShield security platform through integration with SentinelOne’s automated threat detection and response tools
December 2024 – LG Electronics: LG unveiled its 2025 Gram lineup featuring “gram AI,” which blends on-device intelligence for offline tasks with cloud-based services such as GPT-4o for connected use. Lightweight models like the Gram Pro 2-in-1 target mobile professionals.
December 2024 – Intel: Intel released its Core Ultra Series 2 processors with integrated NPUs and confirmed sampling of its 18A process node. These chips are designed to deliver high-performance AI acceleration for laptops, edge devices, and industrial PCs.
January 2025 – Dell Technologies: Dell launched a refreshed line of AI PCs at CES 2025, including the Dell Pro AI Studio toolkit aimed at simplifying AI application deployment across enterprise devices. Systems incorporate NPUs from Intel, AMD, and Qualcomm for on-device intelligence.
January 2025 – ASUS: ASUS introduced its “Copilot+ PC” series at CES 2025, covering laptops, desktops, and mini PCs optimized for business and hybrid work environments. Flagship models such as the ExpertBook B5 highlight this AI-driven expansion.