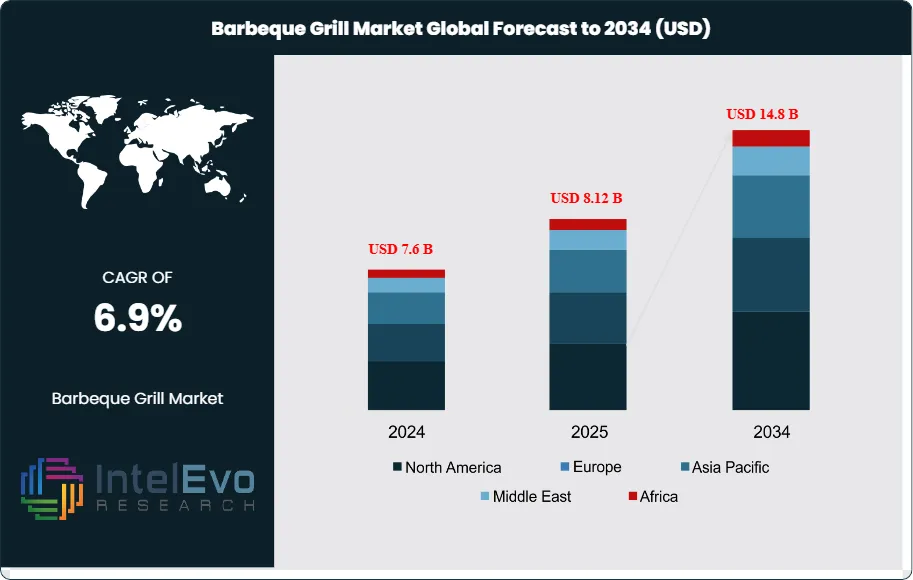
The Barbeque Grill Market is valued at approximately USD 7.6 billion in 2024 and is projected to reach nearly USD 14.8 billion by 2034, expanding at a CAGR of around 6.9% during 2025–2034. The market is gaining momentum as outdoor cooking becomes an essential lifestyle trend, backed by rising urban outdoor spaces, smart grilling technologies, and surging demand for premium gas and electric grills. Growing consumer preference for weekend leisure cooking, smart-connected grilling, and sustainable fuel alternatives is reshaping the industry’s future. With social media driving recipe trends and backyard cooking culture, the next decade is expected to see strong product innovation and higher spending on high-performance grills.
After a decade of steady uptake driven by outdoor leisure and at-home entertaining, the category has broadened from seasonal, weekend use to year-round cooking. Ownership penetration remains high in mature markets—80% of U.S. households own a grill or smoker—while participation is deepening beyond dinner into brunch (12%) and breakfast (7%). Product mix continues to evolve: gas remains the largest segment at 43% share and charcoal at 33%, yet both slipped modestly year over year (–1.3 and –0.9 percentage points, respectively) as electric models gained 1.5 points, reflecting urbanization, convenience, and electrification trends. Full-size formats dominate purchase decisions—86% of gas and 62% of electric units purchased—underscoring a preference for multi-zone cooking and entertaining.
Demand-side momentum is reinforced by lifestyle and flavor cues—cited as top drivers by 57% and 40% of consumers—alongside Gen Z and millennial intent to grill more this summer (50% and 25%). Menu diversification is expanding beyond staples such as chicken (83%) and hot dogs (82%) to plant-based experimentation among 28% of millennials, with sauces (68%), marinades (57%), and dry rubs (55%) elevating the experience. On the supply side, innovation is accelerating: connected “smart” grills with Wi-Fi, app-based monitoring, and digital temperature control are improving outcomes for less experienced users; pellet and electric platforms address ease-of-use and emissions; and material advances are extending durability while reducing maintenance. Sustainability is an emerging differentiator as manufacturers pilot eco-friendly materials and lower-emission heat sources; in parallel, natural-gas primary usage among U.S. owners stands near 9%, signaling a niche for plumbed, patio-centric installations.
Key risks include volatile input costs (steel, electronics), retail channel normalization post-pandemic, weather variability, and meat price inflation—10% of consumers expect to grill less on cost grounds. Regulatory scrutiny on outdoor emissions in dense urban areas may also accelerate the shift toward electric and pellet systems. Regionally, North America remains the largest profit pool given high ownership and replacement cycles; Western Europe is steady with premiumization in gas and pellet; and Asia Pacific and Latin America are the fastest-growing investment frontiers as Western cooking habits diffuse and outdoor living spaces proliferate. Investors should watch electrification, smart-feature attach rates, and premium full-size formats as leading indicators of value creation over the next cycle.
Key Takeaways
Market Growth: The global barbeque grill market will expand from USD 7.6 billion in 2024 to USD 14.8 billion by 2034 (6.9% CAGR), adding roughly USD 7.2 billion in new value on the back of outdoor leisure, at-home entertaining, and product replacement cycles.
Product Type: Gas grills lead with a 57.1% revenue share in 2023, supported by faster heat-up, cleaner operation, and precise temperature control that appeal to frequent users and restaurants seeking throughput.
Application/End Use: Commercial deployments account for 59.0% of demand (2023), reflecting robust procurement by restaurants, caterers, and venues; higher utilization rates and multi-unit purchases sustain premium feature adoption and aftermarket revenues.
Driver: Penetration and participation remain high—~80% of U.S. households own a grill/smoker, and ~20% of consumers plan to grill more seasonally, led by Gen Z (50% of intenders) and millennials (25%), reinforcing recurring fuel and accessories consumption.
Restraint: Cost sensitivity is rising; ~10% of consumers expect to grill less due to meat inflation, while steel and electronic component volatility and unfavorable weather patterns weigh on upgrade cycles and retail sell-through.
Opportunity: Asia Pacific and Latin America are poised for outperformance as Western cooking formats diffuse—APAC is set to deliver a ~6% CAGR through 2033, capturing an outsized share of incremental value via urban, multi-family, and balcony-safe formats (electric, compact gas).
Trend: Feature-rich, connected equipment is scaling; smart controls (Wi-Fi/app thermoregulation, probes) and lower-emission platforms (pellet/electric) are gaining mix, while full-size configurations dominate purchases (≈86% of gas and ≈62% of electric), underscoring demand for multi-zone cooking and entertaining.
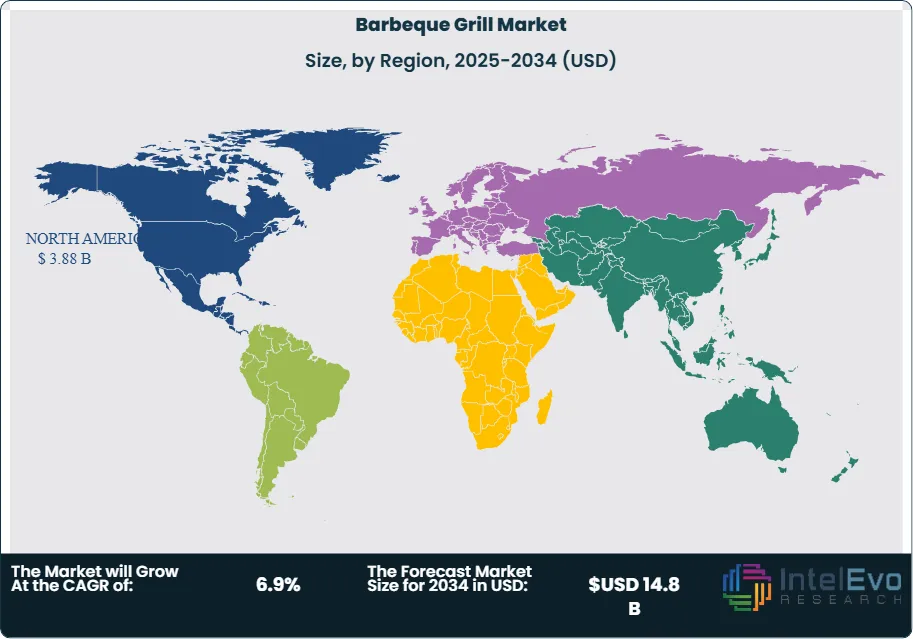
Regional Analysis: North America leads with 52.5% share (USD 2.73 billion in 2023) on high ownership and replacement rates; Western Europe maintains premiumization in gas/pellet at mid-single-digit growth, whereas APAC emerges as the key investment hotspot with the fastest CAGR and expanding modern retail channels.
Type Analysis
Gas remains the anchor of the category in 2025, accounting for an estimated 55–58% of global barbeque grill revenue as operators and households prioritize instant ignition, precise temperature control, and lower cleanup. Premiumization is evident in multi-burner, full-size formats with integrated sear zones, rotisseries, and app-enabled thermostats. While unit growth is steady (≈4–5% CAGR through 2030), value growth is amplified by higher average selling prices (ASPs) and accessory attach rates (side burners, griddle plates, connected probes).
Charcoal retains a loyal enthusiast base—roughly 30–33% share—driven by smoke flavor and ritualized usage. Innovation centers on faster ignition systems, airflow optimization, and ceramic/kamado designs that extend into low-and-slow smoking. Growth moderates (≈3–4% CAGR) as urban regulations and convenience bias cap conversion, yet specialty fuel (lump, flavored pellets/wood chunks) supports a resilient aftermarket.
Electric is the fastest riser at 10–12% share in 2025, expanding at 6–8% CAGR on apartment/balcony compliance, emissions scrutiny, and the convergence of indoor/outdoor cooking. Compact plug-in models and high-wattage, digitally controlled plates increasingly replicate gas performance, while hybrid “pellet-electric” architectures blur lines between grilling and smoking for consistent results with minimal oversight.
Application Analysis
Commercial use continues to lead with ~58–60% revenue share in 2025, underpinned by restaurants, caterers, hotels, stadiums, and event venues. High utilization drives demand for heavy-duty, energy-efficient platforms with quick recovery, multi-zone cooking, and NSF-grade materials. Feature adoption—Wi-Fi monitoring, HACCP-ready temperature logging, and automated fuel feed (pellet)—supports throughput, consistency, and labor productivity, sustaining mid-single-digit growth.
Household adoption is broadening beyond weekend cookouts as consumers integrate grilling into weekday meals. Penetration in mature markets remains high (e.g., ~80% of U.S. households own a grill/smoker), while urban dwellers favor portable gas and electric units. Replacement cycles, outdoor-living upgrades (kitchen islands, pergolas), and accessory ecosystems (thermometers, rubs, griddles) lift household spend, with value growth outpacing units on premium features and materials.
End-Use Analysis
Residential buildings account for roughly 40–45% of unit demand in 2025, with growth supported by home improvement projects and the normalization of year-round grilling. Built-in gas islands and weather-resistant materials (304/430 stainless, porcelain-enameled steel) push ASPs higher, while compact electrics open incremental demand in multi-family settings constrained by open-flame rules.
Commercial buildings—restaurants, QSRs, ghost kitchens, hotels—represent 50–55% of revenue due to higher-spec equipment and frequent replacement driven by uptime requirements. Operators increasingly prioritize total cost of ownership through efficient burners, insulated hoods, and modular components that reduce maintenance downtime.
Industrial/institutional facilities (campuses, hospitals, amusement parks, foodservice commissaries) remain a smaller but expanding niche (≈5–8% share), selecting durable, high-capacity grills that integrate with centralized ventilation and safety systems. Compliance, record-keeping, and consistency are catalysts for electrified and pellet solutions.
Regional Analysis
North America maintains leadership at ~50–52% of global revenue in 2025, supported by entrenched grilling culture, high disposable income, and robust replacement cycles. Product mix skews toward full-size gas and pellet units, with smart features and premium finishes driving value. Europe holds ~20–22% share, where convenience and regulatory dynamics favor gas and electric; northern markets emphasize durability and energy efficiency, while southern markets benefit from outdoor dining tourism.
Asia Pacific is the fastest-growing region (≈6–7% CAGR through 2030) as Western cooking formats diffuse across China, Southeast Asia, Australia, and Japan. Urbanization and balcony restrictions channel demand toward electric and compact gas platforms, while modern retail and e-commerce expand distribution. Latin America (≈5–6% share) scales from a low base on rising incomes and backyard entertaining, with Brazil and Mexico as demand anchors. The Middle East & Africa (≈4–5% share) sees steady gains tied to hospitality investments and outdoor dining, where heat-resilient materials and efficient burners address climatic conditions.
By Product Type (Charcoal, Gas, Electric), By Application (Household, Commercial)
Research Methodology
Primary Research- 100 Interviews of Stakeholders
Secondary Research
Desk Research
Regional scope
North America (United States, Canada, Mexico)
Latin America (Brazil, Argentina, Columbia)
East Asia And Pacific (China, Japan, South Korea, Australia, Cambodia, Fiji, Indonesia)
Sea And South Asia (India, Singapore, Thailand, Taiwan, Malaysia)
Eastern Europe (Poland, Russia, Czech Republic, Romania)
Western Europe (Germany, U.K., France, Spain, Itlay)
Middle East & Africa (GCC Countries, Egypt, Nigeria, South Africa, Israel)
Competitive Landscape
Traeger Pellet Grills LLC, The Coleman Company, Inc., Char Broil LLC, Royal Gourmet, Landmann, Weber, Dansons, Broilmaster, Kenmore, The Middleby Corporation, Other Key Players
Customization Scope
Customization for segments, region/country-level will be provided. Moreover, additional customization can be done based on the requirements.
Pricing and Purchase Options
Avail customized purchase options to meet your exact research needs. We have three licenses to opt for: Single User License, Multi-User License (Up to 5 Users), Corporate Use License (Unlimited User and Printable PDF).
TABLE OF CONTENTS
1. EXECUTIVE SUMMARY
1.1. MARKET SNAPSHOT
1.2. KEY FINDINGS & INSIGHTS
1.3. ANALYST RECOMMENDATIONS
1.4. FUTURE OUTLOOK
2. RESEARCH METHODOLOGY
2.1. MARKET DEFINITION & SCOPE
2.2. RESEARCH OBJECTIVES: PRIMARY & SECONDARY DATA SOURCES
2.3. DATA COLLECTION SOURCES
2.3.1. COVERAGE OF 100+ PRIMARY RESEARCH/CONSULTATION CALLS WITH INDUSTRY STAKEHOLDERS
FIGURE 17 NORTH AMERICA BARBEQUE GRILL CURRENT AND FUTURE TYPE ANALYSIS, 2025–2034, (USD MILLION)
FIGURE 18 NORTH AMERICA BARBEQUE GRILL CURRENT AND FUTURE END USER ANALYSIS, 2025–2034, (USD MILLION)
FIGURE 19 MARKET SHARE BY COUNTRY
FIGURE 20 LATIN AMERICA BARBEQUE GRILL CURRENT AND FUTURE TYPE ANALYSIS, 2025–2034, (USD MILLION)
FIGURE 21 LATIN AMERICA BARBEQUE GRILL CURRENT AND FUTURE END USER ANALYSIS, 2025–2034, (USD MILLION)
FIGURE 22 MARKET SHARE BY COUNTRY
FIGURE 23 EASTERN EUROPE BARBEQUE GRILL CURRENT AND FUTURE TYPE ANALYSIS, 2025–2034, (USD MILLION)
FIGURE 24 EASTERN EUROPE BARBEQUE GRILL CURRENT AND FUTURE END USER ANALYSIS, 2025–2034, (USD MILLION)
FIGURE 25 MARKET SHARE BY COUNTRY
FIGURE 26 WESTERN EUROPE BARBEQUE GRILL CURRENT AND FUTURE TYPE ANALYSIS, 2025–2034, (USD MILLION)
FIGURE 27 WESTERN EUROPE BARBEQUE GRILL CURRENT AND FUTURE END USER ANALYSIS, 2025–2034, (USD MILLION)
FIGURE 28 MARKET SHARE BY COUNTRY
FIGURE 29 EAST ASIA AND PACIFIC BARBEQUE GRILL CURRENT AND FUTURE TYPE ANALYSIS, 2025–2034, (USD MILLION)
FIGURE 30 EAST ASIA AND PACIFIC BARBEQUE GRILL CURRENT AND FUTURE END USER ANALYSIS, 2025–2034, (USD MILLION)
FIGURE 31 MARKET SHARE BY COUNTRY
FIGURE 32 SEA AND SOUTH ASIA BARBEQUE GRILL CURRENT AND FUTURE TYPE ANALYSIS, 2025–2034, (USD MILLION)
FIGURE 33 SEA AND SOUTH ASIA BARBEQUE GRILL CURRENT AND FUTURE END USER ANALYSIS, 2025–2034, (USD MILLION)
FIGURE 34 MARKET SHARE BY COUNTRY
FIGURE 35 MIDDLE EAST AND AFRICA BARBEQUE GRILL CURRENT AND FUTURE TYPE ANALYSIS, 2025–2034, (USD MILLION)
FIGURE 36 MIDDLE EAST AND AFRICA BARBEQUE GRILL CURRENT AND FUTURE END USER ANALYSIS, 2025–2034, (USD MILLION)
FIGURE 37 NORTH AMERICA BARBEQUE GRILL CURRENT AND FUTURE MARKET VOLUME SHARE REGIONAL ANALYSIS, 2025–2034, (USD MILLION)
FIGURE 38 U.S. BARBEQUE GRILL CURRENT AND FUTURE TYPE ANALYSIS, 2025–2034, (USD MILLION)
FIGURE 39 U.S. BARBEQUE GRILL CURRENT AND FUTURE END USER ANALYSIS, 2025–2034, (USD MILLION)
FIGURE 40 CANADA BARBEQUE GRILL CURRENT AND FUTURE TYPE ANALYSIS, 2025–2034, (USD MILLION)
FIGURE 41 CANADA BARBEQUE GRILL CURRENT AND FUTURE END USER ANALYSIS, 2025–2034, (USD MILLION)
FIGURE 42 LATIN AMERICA BARBEQUE GRILL CURRENT AND FUTURE MARKET VOLUME SHARE REGIONAL ANALYSIS, 2025–2034, (USD MILLION)
FIGURE 43 MEXICO BARBEQUE GRILL CURRENT AND FUTURE TYPE ANALYSIS, 2025–2034, (USD MILLION)
FIGURE 44 MEXICO BARBEQUE GRILL CURRENT AND FUTURE END USER ANALYSIS, 2025–2034, (USD MILLION)
FIGURE 45 BRAZIL BARBEQUE GRILL CURRENT AND FUTURE TYPE ANALYSIS, 2025–2034, (USD MILLION)
FIGURE 46 BRAZIL BARBEQUE GRILL CURRENT AND FUTURE END USER ANALYSIS, 2025–2034, (USD MILLION)
FIGURE 47 ARGENTINA BARBEQUE GRILL CURRENT AND FUTURE TYPE ANALYSIS, 2025–2034, (USD MILLION)
FIGURE 48 ARGENTINA BARBEQUE GRILL CURRENT AND FUTURE END USER ANALYSIS, 2025–2034, (USD MILLION)
FIGURE 49 COLUMBIA BARBEQUE GRILL CURRENT AND FUTURE TYPE ANALYSIS, 2025–2034, (USD MILLION)
FIGURE 50 COLUMBIA BARBEQUE GRILL CURRENT AND FUTURE END USER ANALYSIS, 2025–2034, (USD MILLION)
FIGURE 51 REST OF LATIN AMERICA BARBEQUE GRILL CURRENT AND FUTURE TYPE ANALYSIS, 2025–2034, (USD MILLION)
FIGURE 52 REST OF LATIN AMERICA BARBEQUE GRILL CURRENT AND FUTURE END USER ANALYSIS, 2025–2034, (USD MILLION)
FIGURE 53 EASTERN EUROPE BARBEQUE GRILL CURRENT AND FUTURE MARKET VOLUME SHARE REGIONAL ANALYSIS, 2025–2034, (USD MILLION)
FIGURE 54 POLAND BARBEQUE GRILL CURRENT AND FUTURE TYPE ANALYSIS, 2025–2034, (USD MILLION)
FIGURE 55 POLAND BARBEQUE GRILL CURRENT AND FUTURE END USER ANALYSIS, 2025–2034, (USD MILLION)
FIGURE 56 RUSSIA BARBEQUE GRILL CURRENT AND FUTURE TYPE ANALYSIS, 2025–2034, (USD MILLION)
FIGURE 57 RUSSIA BARBEQUE GRILL CURRENT AND FUTURE END USER ANALYSIS, 2025–2034, (USD MILLION)
FIGURE 58 CZECH REPUBLIC BARBEQUE GRILL CURRENT AND FUTURE TYPE ANALYSIS, 2025–2034, (USD MILLION)
FIGURE 59 CZECH REPUBLIC BARBEQUE GRILL CURRENT AND FUTURE END USER ANALYSIS, 2025–2034, (USD MILLION)
FIGURE 60 ROMANIA BARBEQUE GRILL CURRENT AND FUTURE TYPE ANALYSIS, 2025–2034, (USD MILLION)
FIGURE 61 ROMANIA BARBEQUE GRILL CURRENT AND FUTURE END USER ANALYSIS, 2025–2034, (USD MILLION)
FIGURE 62 REST OF EASTERN EUROPE BARBEQUE GRILL CURRENT AND FUTURE TYPE ANALYSIS, 2025–2034, (USD MILLION)
FIGURE 63 REST OF EASTERN EUROPE BARBEQUE GRILL CURRENT AND FUTURE END USER ANALYSIS, 2025–2034, (USD MILLION)
FIGURE 64 WESTERN EUROPE BARBEQUE GRILL CURRENT AND FUTURE MARKET VOLUME SHARE REGIONAL ANALYSIS, 2025–2034, (USD MILLION)
FIGURE 65 GERMANY BARBEQUE GRILL CURRENT AND FUTURE TYPE ANALYSIS, 2025–2034, (USD MILLION)
FIGURE 66 GERMANY BARBEQUE GRILL CURRENT AND FUTURE END USER ANALYSIS, 2025–2034, (USD MILLION)
FIGURE 67 FRANCE BARBEQUE GRILL CURRENT AND FUTURE TYPE ANALYSIS, 2025–2034, (USD MILLION)
FIGURE 68 FRANCE BARBEQUE GRILL CURRENT AND FUTURE END USER ANALYSIS, 2025–2034, (USD MILLION)
FIGURE 69 UK BARBEQUE GRILL CURRENT AND FUTURE TYPE ANALYSIS, 2025–2034, (USD MILLION)
FIGURE 70 UK BARBEQUE GRILL CURRENT AND FUTURE END USER ANALYSIS, 2025–2034, (USD MILLION)
FIGURE 71 SPAIN BARBEQUE GRILL CURRENT AND FUTURE TYPE ANALYSIS, 2025–2034, (USD MILLION)
FIGURE 72 SPAIN BARBEQUE GRILL CURRENT AND FUTURE END USER ANALYSIS, 2025–2034, (USD MILLION)
FIGURE 73 ITALY BARBEQUE GRILL CURRENT AND FUTURE TYPE ANALYSIS, 2025–2034, (USD MILLION)
FIGURE 74 ITALY BARBEQUE GRILL CURRENT AND FUTURE END USER ANALYSIS, 2025–2034, (USD MILLION)
FIGURE 75 REST OF WESTERN EUROPE BARBEQUE GRILL CURRENT AND FUTURE TYPE ANALYSIS, 2025–2034, (USD MILLION)
FIGURE 76 REST OF WESTERN EUROPE BARBEQUE GRILL CURRENT AND FUTURE END USER ANALYSIS, 2025–2034, (USD MILLION)
FIGURE 77 EAST ASIA AND PACIFIC BARBEQUE GRILL CURRENT AND FUTURE MARKET VOLUME SHARE REGIONAL ANALYSIS, 2025–2034, (USD MILLION)
FIGURE 78 CHINA BARBEQUE GRILL CURRENT AND FUTURE TYPE ANALYSIS, 2025–2034, (USD MILLION)
FIGURE 79 CHINA BARBEQUE GRILL CURRENT AND FUTURE END USER ANALYSIS, 2025–2034, (USD MILLION)
FIGURE 80 JAPAN BARBEQUE GRILL CURRENT AND FUTURE TYPE ANALYSIS, 2025–2034, (USD MILLION)
FIGURE 81 JAPAN BARBEQUE GRILL CURRENT AND FUTURE END USER ANALYSIS, 2025–2034, (USD MILLION)
FIGURE 82 AUSTRALIA BARBEQUE GRILL CURRENT AND FUTURE TYPE ANALYSIS, 2025–2034, (USD MILLION)
FIGURE 83 AUSTRALIA BARBEQUE GRILL CURRENT AND FUTURE END USER ANALYSIS, 2025–2034, (USD MILLION)
FIGURE 84 CAMBODIA BARBEQUE GRILL CURRENT AND FUTURE TYPE ANALYSIS, 2025–2034, (USD MILLION)
FIGURE 85 CAMBODIA BARBEQUE GRILL CURRENT AND FUTURE END USER ANALYSIS, 2025–2034, (USD MILLION)
FIGURE 86 FIJI BARBEQUE GRILL CURRENT AND FUTURE TYPE ANALYSIS, 2025–2034, (USD MILLION)
FIGURE 87 FIJI BARBEQUE GRILL CURRENT AND FUTURE END USER ANALYSIS, 2025–2034, (USD MILLION)
FIGURE 88 INDONESIA BARBEQUE GRILL CURRENT AND FUTURE TYPE ANALYSIS, 2025–2034, (USD MILLION)
FIGURE 89 INDONESIA BARBEQUE GRILL CURRENT AND FUTURE END USER ANALYSIS, 2025–2034, (USD MILLION)
FIGURE 90 SOUTH KOREA BARBEQUE GRILL CURRENT AND FUTURE TYPE ANALYSIS, 2025–2034, (USD MILLION)
FIGURE 91 SOUTH KOREA BARBEQUE GRILL CURRENT AND FUTURE END USER ANALYSIS, 2025–2034, (USD MILLION)
FIGURE 92 REST OF EAST ASIA AND PACIFIC BARBEQUE GRILL CURRENT AND FUTURE TYPE ANALYSIS, 2025–2034, (USD MILLION)
FIGURE 93 REST OF EAST ASIA AND PACIFIC BARBEQUE GRILL CURRENT AND FUTURE END USER ANALYSIS, 2025–2034, (USD MILLION)
FIGURE 94 SEA AND SOUTH ASIA BARBEQUE GRILL CURRENT AND FUTURE MARKET VOLUME SHARE REGIONAL ANALYSIS, 2025–2034, (USD MILLION)
FIGURE 95 BANGLADESH BARBEQUE GRILL CURRENT AND FUTURE TYPE ANALYSIS, 2025–2034, (USD MILLION)
FIGURE 96 BANGLADESH BARBEQUE GRILL CURRENT AND FUTURE END USER ANALYSIS, 2025–2034, (USD MILLION)
FIGURE 97 NEW ZEALAND BARBEQUE GRILL CURRENT AND FUTURE TYPE ANALYSIS, 2025–2034, (USD MILLION)
FIGURE 98 NEW ZEALAND BARBEQUE GRILL CURRENT AND FUTURE END USER ANALYSIS, 2025–2034, (USD MILLION)
FIGURE 99 INDIA BARBEQUE GRILL CURRENT AND FUTURE TYPE ANALYSIS, 2025–2034, (USD MILLION)
FIGURE 100 INDIA BARBEQUE GRILL CURRENT AND FUTURE END USER ANALYSIS, 2025–2034, (USD MILLION)
FIGURE 101 SINGAPORE BARBEQUE GRILL CURRENT AND FUTURE TYPE ANALYSIS, 2025–2034, (USD MILLION)
FIGURE 102 SINGAPORE BARBEQUE GRILL CURRENT AND FUTURE END USER ANALYSIS, 2025–2034, (USD MILLION)
FIGURE 103 THAILAND BARBEQUE GRILL CURRENT AND FUTURE TYPE ANALYSIS, 2025–2034, (USD MILLION)
FIGURE 104 THAILAND BARBEQUE GRILL CURRENT AND FUTURE END USER ANALYSIS, 2025–2034, (USD MILLION)
FIGURE 105 TAIWAN BARBEQUE GRILL CURRENT AND FUTURE TYPE ANALYSIS, 2025–2034, (USD MILLION)
FIGURE 106 TAIWAN BARBEQUE GRILL CURRENT AND FUTURE END USER ANALYSIS, 2025–2034, (USD MILLION)
FIGURE 107 MALAYSIA BARBEQUE GRILL CURRENT AND FUTURE TYPE ANALYSIS, 2025–2034, (USD MILLION)
FIGURE 108 MALAYSIA BARBEQUE GRILL CURRENT AND FUTURE END USER ANALYSIS, 2025–2034, (USD MILLION)
FIGURE 109 REST OF SEA AND SOUTH ASIA BARBEQUE GRILL CURRENT AND FUTURE TYPE ANALYSIS, 2025–2034, (USD MILLION)
FIGURE 110 REST OF SEA AND SOUTH ASIA BARBEQUE GRILL CURRENT AND FUTURE END USER ANALYSIS, 2025–2034, (USD MILLION)
FIGURE 111 MIDDLE EAST AND AFRICA BARBEQUE GRILL CURRENT AND FUTURE MARKET VOLUME SHARE REGIONAL ANALYSIS, 2025–2034, (USD MILLION)
FIGURE 112 GCC COUNTRIES BARBEQUE GRILL CURRENT AND FUTURE TYPE ANALYSIS, 2025–2034, (USD MILLION)
FIGURE 113 GCC COUNTRIES BARBEQUE GRILL CURRENT AND FUTURE END USER ANALYSIS, 2025–2034, (USD MILLION)
FIGURE 114 SAUDI ARABIA BARBEQUE GRILL CURRENT AND FUTURE TYPE ANALYSIS, 2025–2034, (USD MILLION)
FIGURE 115 SAUDI ARABIA BARBEQUE GRILL CURRENT AND FUTURE END USER ANALYSIS, 2025–2034, (USD MILLION)
FIGURE 116 UAE BARBEQUE GRILL CURRENT AND FUTURE TYPE ANALYSIS, 2025–2034, (USD MILLION)
FIGURE 117 UAE BARBEQUE GRILL CURRENT AND FUTURE END USER ANALYSIS, 2025–2034, (USD MILLION)
FIGURE 118 BAHRAIN BARBEQUE GRILL CURRENT AND FUTURE TYPE ANALYSIS, 2025–2034, (USD MILLION)
FIGURE 119 BAHRAIN BARBEQUE GRILL CURRENT AND FUTURE END USER ANALYSIS, 2025–2034, (USD MILLION)
FIGURE 120 KUWAIT BARBEQUE GRILL CURRENT AND FUTURE TYPE ANALYSIS, 2025–2034, (USD MILLION)
FIGURE 121 KUWAIT BARBEQUE GRILL CURRENT AND FUTURE END USER ANALYSIS, 2025–2034, (USD MILLION)
FIGURE 122 OMAN BARBEQUE GRILL CURRENT AND FUTURE TYPE ANALYSIS, 2025–2034, (USD MILLION)
FIGURE 123 OMAN BARBEQUE GRILL CURRENT AND FUTURE END USER ANALYSIS, 2025–2034, (USD MILLION)
FIGURE 124 QATAR BARBEQUE GRILL CURRENT AND FUTURE TYPE ANALYSIS, 2025–2034, (USD MILLION)
FIGURE 125 QATAR BARBEQUE GRILL CURRENT AND FUTURE END USER ANALYSIS, 2025–2034, (USD MILLION)
FIGURE 126 EGYPT BARBEQUE GRILL CURRENT AND FUTURE TYPE ANALYSIS, 2025–2034, (USD MILLION)
FIGURE 127 EGYPT BARBEQUE GRILL CURRENT AND FUTURE END USER ANALYSIS, 2025–2034, (USD MILLION)
FIGURE 128 NIGERIA BARBEQUE GRILL CURRENT AND FUTURE TYPE ANALYSIS, 2025–2034, (USD MILLION)
FIGURE 129 NIGERIA BARBEQUE GRILL CURRENT AND FUTURE END USER ANALYSIS, 2025–2034, (USD MILLION)
FIGURE 130 SOUTH AFRICA BARBEQUE GRILL CURRENT AND FUTURE TYPE ANALYSIS, 2025–2034, (USD MILLION)
FIGURE 131 SOUTH AFRICA BARBEQUE GRILL CURRENT AND FUTURE END USER ANALYSIS, 2025–2034, (USD MILLION)
FIGURE 132 ISRAEL BARBEQUE GRILL CURRENT AND FUTURE TYPE ANALYSIS, 2025–2034, (USD MILLION)
FIGURE 133 ISRAEL BARBEQUE GRILL CURRENT AND FUTURE END USER ANALYSIS, 2025–2034, (USD MILLION)
FIGURE 134 REST OF MEA BARBEQUE GRILL CURRENT AND FUTURE TYPE ANALYSIS, 2025–2034, (USD MILLION)
FIGURE 135 REST OF MEA BARBEQUE GRILL CURRENT AND FUTURE END USER ANALYSIS, 2025–2034, (USD MILLION)
FIGURE 136 U. S. MARKET SHARE ANALYSIS BY TYPE (2024)
FIGURE 137 U. S. MARKET SHARE ANALYSIS BY END USER (2024)
FIGURE 138 CANADA MARKET SHARE ANALYSIS BY TYPE (2024)
FIGURE 139 CANADA MARKET SHARE ANALYSIS BY END USER (2024)
FIGURE 140 MEXICO MARKET SHARE ANALYSIS BY TYPE (2024)
FIGURE 141 MEXICO MARKET SHARE ANALYSIS BY END USER (2024)
FIGURE 142 CHINA MARKET SHARE ANALYSIS BY TYPE (2024)
FIGURE 143 CHINA MARKET SHARE ANALYSIS BY END USER (2024)
FIGURE 144 JAPAN MARKET SHARE ANALYSIS BY TYPE (2024)
FIGURE 145 JAPAN MARKET SHARE ANALYSIS BY END USER (2024)
FIGURE 146 INDIA MARKET SHARE ANALYSIS BY TYPE (2024)
FIGURE 147 INDIA MARKET SHARE ANALYSIS BY END USER (2024)
FIGURE 148 SOUTH KOREA MARKET SHARE ANALYSIS BY TYPE (2024)
FIGURE 149 SOUTH KOREA MARKET SHARE ANALYSIS BY END USER (2024)
FIGURE 150 SAUDI ARABIA MARKET SHARE ANALYSIS BY TYPE (2024)
FIGURE 151 SAUDI ARABIA MARKET SHARE ANALYSIS BY END USER (2024)
FIGURE 152 UAE MARKET SHARE ANALYSIS BY TYPE (2024)
FIGURE 153 UAE MARKET SHARE ANALYSIS BY END USER (2024)
FIGURE 154 EGYPT MARKET SHARE ANALYSIS BY TYPE (2024)
FIGURE 155 EGYPT MARKET SHARE ANALYSIS BY END USER (2024)
FIGURE 156 NIGERIA MARKET SHARE ANALYSIS BY TYPE (2024)
FIGURE 157 NIGERIA MARKET SHARE ANALYSIS BY END USER (2024)
FIGURE 158 SOUTH AFRICA MARKET SHARE ANALYSIS BY TYPE (2024)
FIGURE 159 SOUTH AFRICA MARKET SHARE ANALYSIS BY END USER (2024)
FIGURE 160 GERMANY MARKET SHARE ANALYSIS BY TYPE (2024)
FIGURE 161 GERMANY MARKET SHARE ANALYSIS BY END USER (2024)
FIGURE 162 FRANCE MARKET SHARE ANALYSIS BY TYPE (2024)
FIGURE 163 FRANCE MARKET SHARE ANALYSIS BY END USER (2024)
FIGURE 164 UK MARKET SHARE ANALYSIS BY TYPE (2024)
FIGURE 165 UK MARKET SHARE ANALYSIS BY END USER (2024)
FIGURE 166 SPAIN MARKET SHARE ANALYSIS BY TYPE (2024)
FIGURE 167 SPAIN MARKET SHARE ANALYSIS BY END USER (2024)
FIGURE 168 ITALY MARKET SHARE ANALYSIS BY TYPE (2024)
FIGURE 169 ITALY MARKET SHARE ANALYSIS BY END USER (2024)
FIGURE 170 BRAZIL MARKET SHARE ANALYSIS BY TYPE (2024)
FIGURE 171 BRAZIL MARKET SHARE ANALYSIS BY END USER (2024)
FIGURE 172 ARGENTINA MARKET SHARE ANALYSIS BY TYPE (2024)
FIGURE 173 ARGENTINA MARKET SHARE ANALYSIS BY END USER (2024)
FIGURE 174 COLUMBIA MARKET SHARE ANALYSIS BY TYPE (2024)
FIGURE 175 COLUMBIA MARKET SHARE ANALYSIS BY END USER (2024)
FIGURE 176 GLOBAL BARBEQUE GRILL CURRENT AND FUTURE MARKET KEY COUNTRY LEVEL ANALYSIS, 2024–2034, (USD MILLION)
FIGURE 177 FINANCIAL OVERVIEW:
Key Player Analysis
The Middleby Corporation: A leader and systems innovator spanning commercial foodservice and premium residential grills, Middleby leverages a multi-brand portfolio (e.g., Viking, Lynx, EVO) to participate across gas, pellet, and plancha/flat-top formats. As of 2025, the company’s Outdoor & Residential platforms benefit from cross-pollinated R&D developed in its commercial lines—high-efficiency burners, insulated hoods, and precision controls—supporting premium ASPs and resilience in replacement cycles. Management has prioritized smart connectivity and HACCP-ready temperature logging for hospitality buyers, aligning with operator requirements and enabling upsell to software-enabled accessories. With total company revenue historically around the multi-billion-dollar mark and outdoor categories growing mid-single digits, Middleby’s scale in distribution and parts/service remains a key differentiator that compresses total cost of ownership for enterprise customers.
Strategically, Middleby continues to expand margins through modular chassis, shared components, and selective M&A to fill capability gaps (e.g., heat management, automation, specialty cooking surfaces). The company’s differentiation rests on performance per BTU, durability (304 stainless, cast components), and integration with outdoor kitchens. In 2025, growth is supported by premium gas islands (often >USD 2,000 ASP), electrification pilots for regulated markets, and partnerships with luxury builders and hospitality chains—positioning Middleby as the preferred specification brand for high-duty, energy-efficient installations.
Weber: Positioned as a category leader and brand standard in premium consumer grilling, Weber commands strong recognition in gas and charcoal while scaling connected products (Weber Connect, app-guided probes) and expanding into pellet and electric lines. In 2025, Weber’s portfolio addresses all major formats—kettle charcoal, Genesis and Spirit gas, SmokeFire pellet, and Lumin electric—capturing share across price tiers. Smart-feature penetration continues to rise, supporting 10–20% unit price premiums and higher attachment for accessories, fuels, and covers. The company’s omni-channel reach (big-box retail, specialty dealers, DTC) and global service network underpin repeat purchase and brand loyalty, with North America remaining the largest revenue base and Europe providing stable second-leg growth.
Recent initiatives emphasize digital content (recipe libraries, firmware updates), improved heat management, and sustainability (longer-life coatings, parts availability for repair). Weber’s differentiation lies in product reliability, porcelain-enameled finishes, and a deep accessories ecosystem that increases lifetime value. In a market growing ~4–5% CAGR through 2033, Weber’s share gains are concentrated in premium gas and emerging electric segments, where urban compliance and smoke reduction are decisive purchase criteria.
The Coleman Company, Inc.: A challenger and mobility specialist, Coleman focuses on portable gas and compact charcoal/electric grills tailored to camping, tailgating, and balcony-constrained use cases. As part of a broader outdoor recreation portfolio, Coleman benefits from cross-category merchandising (coolers, lighting, camp furniture), enabling strong basket economics in mass retail and e-commerce. In 2025, the brand’s RoadTrip series and collapsible designs capitalize on travel and outdoor leisure trends, with unit growth outpacing the market in the sub-USD 300 price band.
Strategically, Coleman invests in lightweight materials, quick-fold mechanisms, and cartridge-based fuel systems to simplify transport and setup. Differentiation is anchored in portability, value pricing, and wide retail shelf presence across North America and selected Asia Pacific markets. Partnerships with campgrounds, RV dealers, and event sponsors expand visibility, while incremental electrified offerings position the brand for municipalities tightening open-flame rules. The result is durable share in the entry and mid-portable tiers, with attractive volume throughput even as premium categories premiumize.
Broilmaster: A niche premium player, Broilmaster is recognized for ultra-durable cast-aluminum heads and “lifetime grill” positioning aimed at enthusiasts who prioritize longevity and serviceability over short replacement cycles. The brand’s 2025 lineup emphasizes heavy-gauge construction, even heat distribution, and rebuildable components—appealing to consumers seeking TCO advantages versus frequent mid-range replacements. Distribution through specialty dealers supports white-glove installation and aftersales, reinforcing a high-touch, premium experience.
Broilmaster’s strategy centers on craftsmanship, modular upgrades (burners, grates, side stations), and U.S.-leaning assembly that resonates with buyers valuing provenance and service support. While absolute volumes are smaller than mass players, the brand maintains above-category gross margins and strong customer advocacy. As electrification and low-emission demand rise, Broilmaster’s path to growth involves integrating precise digital controls and introducing compliant accessories without compromising its durability ethos—sustaining relevance within premium residential outdoor kitchens.
MarketKey Players
Traeger Pellet Grills LLC
The Coleman Company, Inc.
Char‑Broil LLC
Royal Gourmet
Landmann
Weber
Dansons
Broilmaster
Kenmore
The Middleby Corporation
Other Key Players
Driver:
Accelerating Weekly Adoption and Premiumization in Outdoor Cooking
As of 2025, outdoor cooking has moved from seasonal pastime to weekly meal prep and social entertainment, lifting category cadence across both households and foodservice. The market is tracking at roughly USD 5.7 billion in 2025 and remains on pace for ~4.5–4.7% CAGR through 2033, supported by high penetration in mature markets (e.g., ~80% of U.S. households own a grill/smoker) and rising participation among younger cohorts. Convenience-first formats—especially multi-burner gas and high-wattage electric—shorten cook times and expand weekday use, while the proliferation of outdoor kitchens and accessories increases average selling prices and attachment revenues. Strategically, brands that bundle hardware with fuel, probes, and sauces capture recurring spend and defend margins as volumes normalize.
Restraint:
Environmental Regulations and Cost Volatility Reshape Category Mix
Tightening environmental and safety regulations are compressing charcoal demand and complicating product roadmaps. Urban air-quality targets, balcony/open-flame restrictions, and scrutiny of solid-fuel emissions are nudging consumers toward gas, pellet, and electric alternatives, resulting in low single-digit declines for charcoal units in several regulated metros since 2024. At the same time, steel, electronics, and freight cost volatility is pressuring bill-of-materials and stretching payback periods for premium SKUs. The net effect is a mix shift away from legacy charcoal lines and narrower promotional windows, compelling manufacturers to reallocate capex to compliant platforms and to redesign for energy efficiency to protect channel sell-through.
Connected and automated grills are emerging as the highest-growth pocket, with smart-feature penetration expected to exceed 20% of premium grill shipments by 2027 and a segment CAGR in the low double digits (≈10–12%). Wi-Fi/app control, probe-guided cooking, and predictive temperature algorithms reduce failure risk for novice users and standardize outcomes for commercial operators—expanding the addressable base and supporting 15–30% ASP premiums. Leading brands (e.g., Weber, Traeger, Nexgrill/ACE private labels) are pairing hardware with software updates, recipe libraries, and consumables subscriptions, creating annuity-like revenue streams. For investors, ecosystems that lock in fuels, pellets, and digital services offer higher lifetime value and greater pricing power across cycles.
Trend:
Electrification and Sustainability Drive the Next Wave of Innovation
Electrification and sustainability are reshaping product design and procurement criteria. Electric and pellet platforms are gaining share (electric estimated at ~10–12% of revenue in 2025) as buyers prioritize smoke reduction, emissions compliance, and indoor/outdoor flexibility. Manufacturers are introducing recycled stainless components, longer-life coatings, and higher thermal efficiency (insulated hoods, precision burners), while pilots for solar-assist charging and lower-carbon fuels signal the next wave of differentiation. In commercial settings, HACCP-ready temperature logging and energy-use analytics are becoming standard RFP requirements, favoring digitally instrumented models. The strategic implication is clear: portfolios that combine low-emission heat sources with data-rich controls will capture procurement mandates and command premium margins through 2028 and beyond.
Recent Developments
Dec 2024 – Weber & Blackstone: Weber announced a definitive agreement to combine with Blackstone Products, merging complementary portfolios of grilling and outdoor griddles under a joint organization while maintaining both brands.
Feb 2025 – (Expected close) Weber‑Blackstone combined entity: The merger of Weber and Blackstone was completed in early 2025, forming the new “Weber Blackstone” business with combined revenue estimated north of USD 2 billion.
Mar 2025 – Nexgrill Industries: Nexgrill launched its Gourmet Pro line, a modular “all-in-one” system capable of grilling, sautéing, griddling, and smoking in a single unit.
Jun 2025 – BBQ‑AID: BBQ‑AID acquired FlavrQ (patented system enabling charcoal grilling on gas grills) in a deal positioned to extend its accessory and hybrid fuel offerings (deal terms not disclosed).
Sep 2025 – BBQGuys: BBQGuys acquired Mont Alpi, a modular outdoor kitchen/turnkey systems manufacturer, to add vertical integration and product depth across appliances, islands, and outdoor kitchen modules.
Sep 2025 – Miele: At IFA 2025, Miele unveiled its “Dreams” modular outdoor kitchen line, anchored by the Fire Pro IQ intelligent gas grill that autonomously regulates temperature across four zones and executes recipe-based grilling via app control.