Global Battery Material Market Size, Share, Analysis Report By Battery Type (Lead acid, Lithium-ion, Others), Material (Anode, Electrolyte, Cathode, Binder, Others), End-User (Consumer Electronics, Automotive, Industrial, Others), Region and Key Players - Industry Segment Overview, Market Dynamics, Competitive Strategies, Trends and Forecast 2025-2034
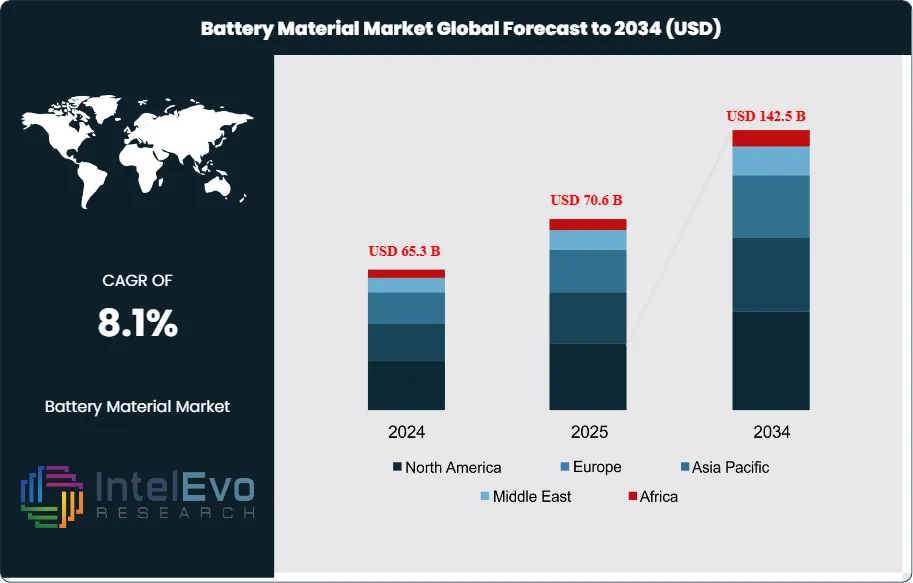
The Battery Material Market size is expected to be worth around USD 142.5 billion by 2034, from USD 65.3 billion in 2024, growing at a CAGR of 8.1% during the forecast period from 2025 to 2034. Rising electric vehicle (EV) adoption, growing renewable energy storage demand, and continuous advancements in lithium-ion and solid-state batteries are fueling the growth of the battery material industry worldwide. With sustainability and innovation at its core, the market is paving the way for a cleaner, energy-efficient future.
The global battery material market is experiencing significant growth, propelled by the increasing adoption of electric vehicles (EVs), the expansion of renewable energy storage solutions, and the rising demand for portable electronic devices. Key materials such as lithium, cobalt, nickel, graphite, and manganese are essential components in battery production, particularly for lithium-ion batteries, which dominate the current market. This report provides a comprehensive analysis of the battery material market, including factors influencing its growth, regional dynamics, the impact of COVID-19, and future prospects.
Key trends shaping the future include: Emphasis on ethical and environmentally friendly extraction of raw materials. Development of efficient recycling processes to recover valuable materials and reduce waste. Ongoing research into alternative materials and battery chemistries to enhance performance and reduce costs. Government initiatives and international agreements will influence market dynamics and investment decisions.
The COVID-19 pandemic disrupted the battery material market by causing supply chain interruptions, labor shortages, and reduced industrial activity. Lockdowns and travel restrictions hindered mining operations and delayed the transportation of raw materials, leading to production slowdowns. However, the pandemic also highlighted the importance of resilient supply chains and accelerated the push for domestic manufacturing capabilities. As economies recover, the battery material market is rebounding, with renewed focus on sustainability and supply chain diversification.
Key Takeaways:
Market Growth: The Battery Material Market is expected to reach USD 142.5 billion by 2034, growing at a robust CAGR of 8.1% from 2024, experience rapid expansion, especially in the automotive and renewable storage segments.
Battery Type Dominance: Lithium-ion batteries currently dominate the battery material market due to their superior energy density, lightweight profile, and extensive usage across electric vehicles and portable electronics. While lead-acid batteries maintain relevance in stationary applications, lithium-ion is projected to see the fastest growth due to increasing demand from clean energy and EV sectors.
Material Dominance: Cathode materials dominate the battery material market due to their significant impact on a battery’s capacity, performance, and cost. However, anode materials, particularly innovations like silicon-based anodes, are projected to see substantial growth in the near future due to increasing demand for higher energy density.
End-User Dominance: The automotive segment leads the battery material market, driven by the surge in electric vehicle (EV) production worldwide. Meanwhile, the consumer electronics segment continues to witness steady growth but is projected to be overtaken in pace by the industrial sector as demand for energy storage systems and grid applications rises.
Driver: The global shift toward electric mobility and clean energy solutions is driving demand for advanced battery materials. Government incentives, technological innovation, and expansion of renewable energy storage applications further fuel the market.
Restraint: The battery material market faces limitations such as supply chain instability, ethical sourcing concerns, and price volatility of critical raw materials. These challenges may hinder scalability and pose risks to sustainable growth.
Opportunity: Advancements in battery chemistries and recycling technologies open promising opportunities in the battery material market. Increasing investment in sustainable sourcing and second-life applications also presents avenues for expansion.
Trend: The battery material market is witnessing major trends such as localization of supply chains, increased R&D in sustainable chemistries, and digitization of production processes. Demand for low-cost, high-efficiency, and eco-friendly materials continues to shape market direction.
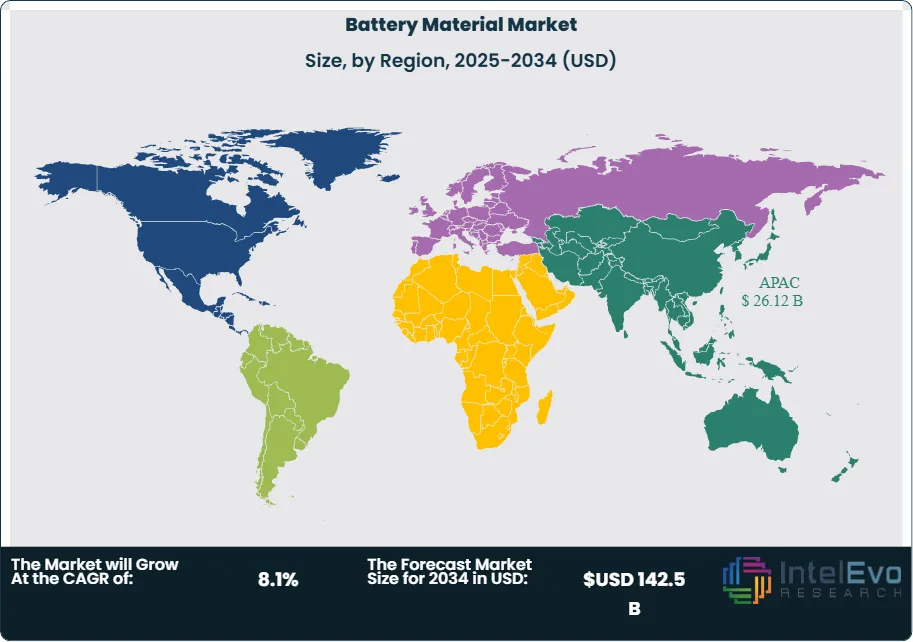
Regional Analysis: The Asia-Pacific region dominates the global battery material market, driven by large-scale production of batteries in China, Japan, and South Korea, along with rising electric vehicle (EV) and electronics manufacturing.
Battery Type Analysis:
Lithium-ion Leads With more than 60% Market Share In Battery Material Market: The lithium-ion battery segment leads the battery material market and is expected to continue its dominance in the coming years. Lithium-ion batteries are widely used in electric vehicles (EVs), consumer electronics, grid energy storage, and power tools due to their high energy density, long cycle life, and ability to deliver reliable performance under varying environmental conditions. With rapid electrification of transport and industrial sectors, demand for high-performance battery materials like lithium, nickel, cobalt, and manganese has surged, favoring lithium-ion technologies.
In contrast, lead-acid batteries, though older and bulkier, still serve critical roles in backup power systems, automotive starter batteries, and UPS (uninterruptible power supply) applications. However, their lower energy density and shorter lifespan limit their future growth potential.
Looking ahead, lithium-ion is anticipated to witness the fastest growth, especially with increasing R&D in solid-state and cobalt-free lithium-ion variants. This trend is further reinforced by global investments in gigafactories, EV subsidies, and renewable energy storage initiatives.
Material Analysis:
The cathode segment leads the battery material market and accounts for a major share of total battery production costs. Cathodes are critical in determining battery energy density, voltage, and overall performance, making them the most technically and economically influential component. Materials like lithium nickel manganese cobalt oxide (NMC) and lithium iron phosphate (LFP) dominate current cathode chemistries, used extensively in electric vehicles (EVs), consumer electronics, and grid energy storage. Manufacturers are investing heavily in optimizing cathode compositions to improve performance while reducing reliance on scarce and expensive elements like cobalt.
In contrast, the anode segment is poised for rapid growth, especially with increasing research into silicon-based and lithium metal anodes. These materials promise to significantly enhance the energy storage capacity and charging speed of batteries—key demands in both the EV and portable electronics sectors. This growth potential is also supported by major industry collaborations and pilot-scale developments.
End-User Analysis:
The automotive sector dominates the battery material market due to the rapid global adoption of electric vehicles. With governments setting aggressive emission reduction goals and offering incentives for EV purchases, automakers are shifting away from internal combustion engines, thus dramatically increasing the demand for advanced batteries. Lithium-ion battery chemistry is at the core of this revolution, and the need for high-capacity, long-lasting, and safe battery materials—especially cathodes and electrolytes—is more critical than ever. The automotive industry’s scale and capital-intensive nature also make it the most lucrative end-use segment for battery material suppliers.
On the other hand, the industrial segment is expected to experience the fastest growth in the coming years. The rise of renewable energy sources such as solar and wind requires large-scale energy storage systems for grid balancing and backup power. This creates a burgeoning market for industrial-grade batteries, which demand robust, long-life materials. As energy infrastructure modernizes globally and off-grid solutions grow in emerging economies, the industrial segment is poised to become a key driver of the battery material market, potentially reshaping demand trends beyond the automotive and electronics sectors.
Region Analysis:
Asia-Pacific Leads With over 40% Market Share In Battery Material Market: The Asia-Pacific region holds the largest share of the global battery material market, primarily because of China’s leadership in lithium-ion battery manufacturing and supply chain control. Countries like Japan and South Korea also contribute significantly with established battery producers such as Panasonic, LG Energy Solution, and Samsung SDI. The region benefits from easy access to raw materials, technological advancements, and a growing consumer base for electric vehicles and electronics. Government incentives, environmental policies, and local production capabilities create a self-reliant and high-growth market landscape.
Europe, while currently behind in volume, is witnessing the fastest growth. The EU’s Green Deal and push for carbon neutrality by 2050 have resulted in stringent vehicle emission norms, accelerating the transition to EVs. Nations like Germany, France, and the Nordics are heavily investing in battery gigafactories and localized material sourcing, reducing reliance on imports and fostering regional demand for battery materials.
By (Material Type, Cathode Materials, (Lithium Cobalt Oxide (LCO), Lithium Iron Phosphate (LFP), Nickel Manganese Cobalt (NMC), Nickel Cobalt Aluminum (NCA), Others), Anode Materials, (Natural Graphite, Synthetic Graphite, Silicon-based Anodes, Lithium Titanate (LTO), Others), Electrolytes, (Liquid Electrolytes, Solid-State Electrolytes, Polymer Electrolytes), Separators, (Polyethylene (PE), Polypropylene (PP), Ceramic-Coated Separators), Conductive Additives & Binders), By Battery Type (Lithium-ion Batteries, Lead-Acid Batteries, Nickel-Metal Hydride (NiMH) Batteries, Solid-State Batteries, Flow Batteries), By Application (Automotive (Electric Vehicles, Hybrid Vehicles), Consumer Electronics (Smartphones, Laptops, Wearables), Energy Storage Systems (Residential, Commercial, Utility-scale), Industrial Equipment and Tools, Others (Aerospace, Marine, Medical Devices)), By End User (OEMs, Battery Manufacturers, Raw Material Suppliers, Recycling Companies)
Research Methodology
Primary Research- 100 Interviews of Stakeholders
Secondary Research
Desk Research
Regional scope
North America (United States, Canada, Mexico)
Latin America (Brazil, Argentina, Columbia)
East Asia And Pacific (China, Japan, South Korea, Australia, Cambodia, Fiji, Indonesia)
Sea And South Asia (India, Singapore, Thailand, Taiwan, Malaysia)
Eastern Europe (Poland, Russia, Czech Republic, Romania)
Western Europe (Germany, U.K., France, Spain, Itlay)
Middle East & Africa (GCC Countries, Egypt, Nigeria, South Africa, Israel)
Competitive Landscape
Asahi Kasei, Umicore Cobalt & Specialty Materials (CSM), BASF SE, Hitachi Chemical Co. Ltd., Toray Industries, Sumitomo Corporation, Johnson Matthey, TCI Chemicals (India) Pvt. Ltd., Kureha Corporation, Mitsubishi Chemical Holdings, Targray Technology International, NEI Corporation, NEO Battery Materials Ltd., NICHIA CORPORATION, 3M, Posco, Shanghai Shanshan Tech Co. Ltd.
Customization Scope
Customization for segments, region/country-level will be provided. Moreover, additional customization can be done based on the requirements.
Pricing and Purchase Options
Avail customized purchase options to meet your exact research needs. We have three licenses to opt for: Single User License, Multi-User License (Up to 5 Users), Corporate Use License (Unlimited User and Printable PDF).
TABLE OF CONTENTS
1. EXECUTIVE SUMMARY
1.1. MARKET SNAPSHOT
1.2. KEY FINDINGS & INSIGHTS
1.3. ANALYST RECOMMENDATIONS
1.4. FUTURE OUTLOOK
2. RESEARCH METHODOLOGY
2.1. MARKET DEFINITION & SCOPE
2.2. RESEARCH OBJECTIVES: PRIMARY & SECONDARY DATA SOURCES
2.3. DATA COLLECTION SOURCES
2.3.1. COVERAGE OF 100+ PRIMARY RESEARCH/CONSULTATION CALLS WITH INDUSTRY STAKEHOLDERS
FIGURE 17 NORTH AMERICA BATTERY MATERIAL CURRENT AND FUTURE TYPE ANALYSIS, 2025–2034, (USD MILLION)
FIGURE 18 NORTH AMERICA BATTERY MATERIAL CURRENT AND FUTURE END USER ANALYSIS, 2025–2034, (USD MILLION)
FIGURE 19 MARKET SHARE BY COUNTRY
FIGURE 20 LATIN AMERICA BATTERY MATERIAL CURRENT AND FUTURE TYPE ANALYSIS, 2025–2034, (USD MILLION)
FIGURE 21 LATIN AMERICA BATTERY MATERIAL CURRENT AND FUTURE END USER ANALYSIS, 2025–2034, (USD MILLION)
FIGURE 22 MARKET SHARE BY COUNTRY
FIGURE 23 EASTERN EUROPE BATTERY MATERIAL CURRENT AND FUTURE TYPE ANALYSIS, 2025–2034, (USD MILLION)
FIGURE 24 EASTERN EUROPE BATTERY MATERIAL CURRENT AND FUTURE END USER ANALYSIS, 2025–2034, (USD MILLION)
FIGURE 25 MARKET SHARE BY COUNTRY
FIGURE 26 WESTERN EUROPE BATTERY MATERIAL CURRENT AND FUTURE TYPE ANALYSIS, 2025–2034, (USD MILLION)
FIGURE 27 WESTERN EUROPE BATTERY MATERIAL CURRENT AND FUTURE END USER ANALYSIS, 2025–2034, (USD MILLION)
FIGURE 28 MARKET SHARE BY COUNTRY
FIGURE 29 EAST ASIA AND PACIFIC BATTERY MATERIAL CURRENT AND FUTURE TYPE ANALYSIS, 2025–2034, (USD MILLION)
FIGURE 30 EAST ASIA AND PACIFIC BATTERY MATERIAL CURRENT AND FUTURE END USER ANALYSIS, 2025–2034, (USD MILLION)
FIGURE 31 MARKET SHARE BY COUNTRY
FIGURE 32 SEA AND SOUTH ASIA BATTERY MATERIAL CURRENT AND FUTURE TYPE ANALYSIS, 2025–2034, (USD MILLION)
FIGURE 33 SEA AND SOUTH ASIA BATTERY MATERIAL CURRENT AND FUTURE END USER ANALYSIS, 2025–2034, (USD MILLION)
FIGURE 34 MARKET SHARE BY COUNTRY
FIGURE 35 MIDDLE EAST AND AFRICA BATTERY MATERIAL CURRENT AND FUTURE TYPE ANALYSIS, 2025–2034, (USD MILLION)
FIGURE 36 MIDDLE EAST AND AFRICA BATTERY MATERIAL CURRENT AND FUTURE END USER ANALYSIS, 2025–2034, (USD MILLION)
FIGURE 37 NORTH AMERICA BATTERY MATERIAL CURRENT AND FUTURE MARKET VOLUME SHARE REGIONAL ANALYSIS, 2025–2034, (USD MILLION)
FIGURE 38 U.S. BATTERY MATERIAL CURRENT AND FUTURE TYPE ANALYSIS, 2025–2034, (USD MILLION)
FIGURE 39 U.S. BATTERY MATERIAL CURRENT AND FUTURE END USER ANALYSIS, 2025–2034, (USD MILLION)
FIGURE 40 CANADA BATTERY MATERIAL CURRENT AND FUTURE TYPE ANALYSIS, 2025–2034, (USD MILLION)
FIGURE 41 CANADA BATTERY MATERIAL CURRENT AND FUTURE END USER ANALYSIS, 2025–2034, (USD MILLION)
FIGURE 42 LATIN AMERICA BATTERY MATERIAL CURRENT AND FUTURE MARKET VOLUME SHARE REGIONAL ANALYSIS, 2025–2034, (USD MILLION)
FIGURE 43 MEXICO BATTERY MATERIAL CURRENT AND FUTURE TYPE ANALYSIS, 2025–2034, (USD MILLION)
FIGURE 44 MEXICO BATTERY MATERIAL CURRENT AND FUTURE END USER ANALYSIS, 2025–2034, (USD MILLION)
FIGURE 45 BRAZIL BATTERY MATERIAL CURRENT AND FUTURE TYPE ANALYSIS, 2025–2034, (USD MILLION)
FIGURE 46 BRAZIL BATTERY MATERIAL CURRENT AND FUTURE END USER ANALYSIS, 2025–2034, (USD MILLION)
FIGURE 47 ARGENTINA BATTERY MATERIAL CURRENT AND FUTURE TYPE ANALYSIS, 2025–2034, (USD MILLION)
FIGURE 48 ARGENTINA BATTERY MATERIAL CURRENT AND FUTURE END USER ANALYSIS, 2025–2034, (USD MILLION)
FIGURE 49 COLUMBIA BATTERY MATERIAL CURRENT AND FUTURE TYPE ANALYSIS, 2025–2034, (USD MILLION)
FIGURE 50 COLUMBIA BATTERY MATERIAL CURRENT AND FUTURE END USER ANALYSIS, 2025–2034, (USD MILLION)
FIGURE 51 REST OF LATIN AMERICA BATTERY MATERIAL CURRENT AND FUTURE TYPE ANALYSIS, 2025–2034, (USD MILLION)
FIGURE 52 REST OF LATIN AMERICA BATTERY MATERIAL CURRENT AND FUTURE END USER ANALYSIS, 2025–2034, (USD MILLION)
FIGURE 53 EASTERN EUROPE BATTERY MATERIAL CURRENT AND FUTURE MARKET VOLUME SHARE REGIONAL ANALYSIS, 2025–2034, (USD MILLION)
FIGURE 54 POLAND BATTERY MATERIAL CURRENT AND FUTURE TYPE ANALYSIS, 2025–2034, (USD MILLION)
FIGURE 55 POLAND BATTERY MATERIAL CURRENT AND FUTURE END USER ANALYSIS, 2025–2034, (USD MILLION)
FIGURE 56 RUSSIA BATTERY MATERIAL CURRENT AND FUTURE TYPE ANALYSIS, 2025–2034, (USD MILLION)
FIGURE 57 RUSSIA BATTERY MATERIAL CURRENT AND FUTURE END USER ANALYSIS, 2025–2034, (USD MILLION)
FIGURE 58 CZECH REPUBLIC BATTERY MATERIAL CURRENT AND FUTURE TYPE ANALYSIS, 2025–2034, (USD MILLION)
FIGURE 59 CZECH REPUBLIC BATTERY MATERIAL CURRENT AND FUTURE END USER ANALYSIS, 2025–2034, (USD MILLION)
FIGURE 60 ROMANIA BATTERY MATERIAL CURRENT AND FUTURE TYPE ANALYSIS, 2025–2034, (USD MILLION)
FIGURE 61 ROMANIA BATTERY MATERIAL CURRENT AND FUTURE END USER ANALYSIS, 2025–2034, (USD MILLION)
FIGURE 62 REST OF EASTERN EUROPE BATTERY MATERIAL CURRENT AND FUTURE TYPE ANALYSIS, 2025–2034, (USD MILLION)
FIGURE 63 REST OF EASTERN EUROPE BATTERY MATERIAL CURRENT AND FUTURE END USER ANALYSIS, 2025–2034, (USD MILLION)
FIGURE 64 WESTERN EUROPE BATTERY MATERIAL CURRENT AND FUTURE MARKET VOLUME SHARE REGIONAL ANALYSIS, 2025–2034, (USD MILLION)
FIGURE 65 GERMANY BATTERY MATERIAL CURRENT AND FUTURE TYPE ANALYSIS, 2025–2034, (USD MILLION)
FIGURE 66 GERMANY BATTERY MATERIAL CURRENT AND FUTURE END USER ANALYSIS, 2025–2034, (USD MILLION)
FIGURE 67 FRANCE BATTERY MATERIAL CURRENT AND FUTURE TYPE ANALYSIS, 2025–2034, (USD MILLION)
FIGURE 68 FRANCE BATTERY MATERIAL CURRENT AND FUTURE END USER ANALYSIS, 2025–2034, (USD MILLION)
FIGURE 69 UK BATTERY MATERIAL CURRENT AND FUTURE TYPE ANALYSIS, 2025–2034, (USD MILLION)
FIGURE 70 UK BATTERY MATERIAL CURRENT AND FUTURE END USER ANALYSIS, 2025–2034, (USD MILLION)
FIGURE 71 SPAIN BATTERY MATERIAL CURRENT AND FUTURE TYPE ANALYSIS, 2025–2034, (USD MILLION)
FIGURE 72 SPAIN BATTERY MATERIAL CURRENT AND FUTURE END USER ANALYSIS, 2025–2034, (USD MILLION)
FIGURE 73 ITALY BATTERY MATERIAL CURRENT AND FUTURE TYPE ANALYSIS, 2025–2034, (USD MILLION)
FIGURE 74 ITALY BATTERY MATERIAL CURRENT AND FUTURE END USER ANALYSIS, 2025–2034, (USD MILLION)
FIGURE 75 REST OF WESTERN EUROPE BATTERY MATERIAL CURRENT AND FUTURE TYPE ANALYSIS, 2025–2034, (USD MILLION)
FIGURE 76 REST OF WESTERN EUROPE BATTERY MATERIAL CURRENT AND FUTURE END USER ANALYSIS, 2025–2034, (USD MILLION)
FIGURE 77 EAST ASIA AND PACIFIC BATTERY MATERIAL CURRENT AND FUTURE MARKET VOLUME SHARE REGIONAL ANALYSIS, 2025–2034, (USD MILLION)
FIGURE 78 CHINA BATTERY MATERIAL CURRENT AND FUTURE TYPE ANALYSIS, 2025–2034, (USD MILLION)
FIGURE 79 CHINA BATTERY MATERIAL CURRENT AND FUTURE END USER ANALYSIS, 2025–2034, (USD MILLION)
FIGURE 80 JAPAN BATTERY MATERIAL CURRENT AND FUTURE TYPE ANALYSIS, 2025–2034, (USD MILLION)
FIGURE 81 JAPAN BATTERY MATERIAL CURRENT AND FUTURE END USER ANALYSIS, 2025–2034, (USD MILLION)
FIGURE 82 AUSTRALIA BATTERY MATERIAL CURRENT AND FUTURE TYPE ANALYSIS, 2025–2034, (USD MILLION)
FIGURE 83 AUSTRALIA BATTERY MATERIAL CURRENT AND FUTURE END USER ANALYSIS, 2025–2034, (USD MILLION)
FIGURE 84 CAMBODIA BATTERY MATERIAL CURRENT AND FUTURE TYPE ANALYSIS, 2025–2034, (USD MILLION)
FIGURE 85 CAMBODIA BATTERY MATERIAL CURRENT AND FUTURE END USER ANALYSIS, 2025–2034, (USD MILLION)
FIGURE 86 FIJI BATTERY MATERIAL CURRENT AND FUTURE TYPE ANALYSIS, 2025–2034, (USD MILLION)
FIGURE 87 FIJI BATTERY MATERIAL CURRENT AND FUTURE END USER ANALYSIS, 2025–2034, (USD MILLION)
FIGURE 88 INDONESIA BATTERY MATERIAL CURRENT AND FUTURE TYPE ANALYSIS, 2025–2034, (USD MILLION)
FIGURE 89 INDONESIA BATTERY MATERIAL CURRENT AND FUTURE END USER ANALYSIS, 2025–2034, (USD MILLION)
FIGURE 90 SOUTH KOREA BATTERY MATERIAL CURRENT AND FUTURE TYPE ANALYSIS, 2025–2034, (USD MILLION)
FIGURE 91 SOUTH KOREA BATTERY MATERIAL CURRENT AND FUTURE END USER ANALYSIS, 2025–2034, (USD MILLION)
FIGURE 92 REST OF EAST ASIA AND PACIFIC BATTERY MATERIAL CURRENT AND FUTURE TYPE ANALYSIS, 2025–2034, (USD MILLION)
FIGURE 93 REST OF EAST ASIA AND PACIFIC BATTERY MATERIAL CURRENT AND FUTURE END USER ANALYSIS, 2025–2034, (USD MILLION)
FIGURE 94 SEA AND SOUTH ASIA BATTERY MATERIAL CURRENT AND FUTURE MARKET VOLUME SHARE REGIONAL ANALYSIS, 2025–2034, (USD MILLION)
FIGURE 95 BANGLADESH BATTERY MATERIAL CURRENT AND FUTURE TYPE ANALYSIS, 2025–2034, (USD MILLION)
FIGURE 96 BANGLADESH BATTERY MATERIAL CURRENT AND FUTURE END USER ANALYSIS, 2025–2034, (USD MILLION)
FIGURE 97 NEW ZEALAND BATTERY MATERIAL CURRENT AND FUTURE TYPE ANALYSIS, 2025–2034, (USD MILLION)
FIGURE 98 NEW ZEALAND BATTERY MATERIAL CURRENT AND FUTURE END USER ANALYSIS, 2025–2034, (USD MILLION)
FIGURE 99 INDIA BATTERY MATERIAL CURRENT AND FUTURE TYPE ANALYSIS, 2025–2034, (USD MILLION)
FIGURE 100 INDIA BATTERY MATERIAL CURRENT AND FUTURE END USER ANALYSIS, 2025–2034, (USD MILLION)
FIGURE 101 SINGAPORE BATTERY MATERIAL CURRENT AND FUTURE TYPE ANALYSIS, 2025–2034, (USD MILLION)
FIGURE 102 SINGAPORE BATTERY MATERIAL CURRENT AND FUTURE END USER ANALYSIS, 2025–2034, (USD MILLION)
FIGURE 103 THAILAND BATTERY MATERIAL CURRENT AND FUTURE TYPE ANALYSIS, 2025–2034, (USD MILLION)
FIGURE 104 THAILAND BATTERY MATERIAL CURRENT AND FUTURE END USER ANALYSIS, 2025–2034, (USD MILLION)
FIGURE 105 TAIWAN BATTERY MATERIAL CURRENT AND FUTURE TYPE ANALYSIS, 2025–2034, (USD MILLION)
FIGURE 106 TAIWAN BATTERY MATERIAL CURRENT AND FUTURE END USER ANALYSIS, 2025–2034, (USD MILLION)
FIGURE 107 MALAYSIA BATTERY MATERIAL CURRENT AND FUTURE TYPE ANALYSIS, 2025–2034, (USD MILLION)
FIGURE 108 MALAYSIA BATTERY MATERIAL CURRENT AND FUTURE END USER ANALYSIS, 2025–2034, (USD MILLION)
FIGURE 109 REST OF SEA AND SOUTH ASIA BATTERY MATERIAL CURRENT AND FUTURE TYPE ANALYSIS, 2025–2034, (USD MILLION)
FIGURE 110 REST OF SEA AND SOUTH ASIA BATTERY MATERIAL CURRENT AND FUTURE END USER ANALYSIS, 2025–2034, (USD MILLION)
FIGURE 111 MIDDLE EAST AND AFRICA BATTERY MATERIAL CURRENT AND FUTURE MARKET VOLUME SHARE REGIONAL ANALYSIS, 2025–2034, (USD MILLION)
FIGURE 112 GCC COUNTRIES BATTERY MATERIAL CURRENT AND FUTURE TYPE ANALYSIS, 2025–2034, (USD MILLION)
FIGURE 113 GCC COUNTRIES BATTERY MATERIAL CURRENT AND FUTURE END USER ANALYSIS, 2025–2034, (USD MILLION)
FIGURE 114 SAUDI ARABIA BATTERY MATERIAL CURRENT AND FUTURE TYPE ANALYSIS, 2025–2034, (USD MILLION)
FIGURE 115 SAUDI ARABIA BATTERY MATERIAL CURRENT AND FUTURE END USER ANALYSIS, 2025–2034, (USD MILLION)
FIGURE 116 UAE BATTERY MATERIAL CURRENT AND FUTURE TYPE ANALYSIS, 2025–2034, (USD MILLION)
FIGURE 117 UAE BATTERY MATERIAL CURRENT AND FUTURE END USER ANALYSIS, 2025–2034, (USD MILLION)
FIGURE 118 BAHRAIN BATTERY MATERIAL CURRENT AND FUTURE TYPE ANALYSIS, 2025–2034, (USD MILLION)
FIGURE 119 BAHRAIN BATTERY MATERIAL CURRENT AND FUTURE END USER ANALYSIS, 2025–2034, (USD MILLION)
FIGURE 120 KUWAIT BATTERY MATERIAL CURRENT AND FUTURE TYPE ANALYSIS, 2025–2034, (USD MILLION)
FIGURE 121 KUWAIT BATTERY MATERIAL CURRENT AND FUTURE END USER ANALYSIS, 2025–2034, (USD MILLION)
FIGURE 122 OMAN BATTERY MATERIAL CURRENT AND FUTURE TYPE ANALYSIS, 2025–2034, (USD MILLION)
FIGURE 123 OMAN BATTERY MATERIAL CURRENT AND FUTURE END USER ANALYSIS, 2025–2034, (USD MILLION)
FIGURE 124 QATAR BATTERY MATERIAL CURRENT AND FUTURE TYPE ANALYSIS, 2025–2034, (USD MILLION)
FIGURE 125 QATAR BATTERY MATERIAL CURRENT AND FUTURE END USER ANALYSIS, 2025–2034, (USD MILLION)
FIGURE 126 EGYPT BATTERY MATERIAL CURRENT AND FUTURE TYPE ANALYSIS, 2025–2034, (USD MILLION)
FIGURE 127 EGYPT BATTERY MATERIAL CURRENT AND FUTURE END USER ANALYSIS, 2025–2034, (USD MILLION)
FIGURE 128 NIGERIA BATTERY MATERIAL CURRENT AND FUTURE TYPE ANALYSIS, 2025–2034, (USD MILLION)
FIGURE 129 NIGERIA BATTERY MATERIAL CURRENT AND FUTURE END USER ANALYSIS, 2025–2034, (USD MILLION)
FIGURE 130 SOUTH AFRICA BATTERY MATERIAL CURRENT AND FUTURE TYPE ANALYSIS, 2025–2034, (USD MILLION)
FIGURE 131 SOUTH AFRICA BATTERY MATERIAL CURRENT AND FUTURE END USER ANALYSIS, 2025–2034, (USD MILLION)
FIGURE 132 ISRAEL BATTERY MATERIAL CURRENT AND FUTURE TYPE ANALYSIS, 2025–2034, (USD MILLION)
FIGURE 133 ISRAEL BATTERY MATERIAL CURRENT AND FUTURE END USER ANALYSIS, 2025–2034, (USD MILLION)
FIGURE 134 REST OF MEA BATTERY MATERIAL CURRENT AND FUTURE TYPE ANALYSIS, 2025–2034, (USD MILLION)
FIGURE 135 REST OF MEA BATTERY MATERIAL CURRENT AND FUTURE END USER ANALYSIS, 2025–2034, (USD MILLION)
FIGURE 136 U. S. MARKET SHARE ANALYSIS BY TYPE (2024)
FIGURE 137 U. S. MARKET SHARE ANALYSIS BY END USER (2024)
FIGURE 138 CANADA MARKET SHARE ANALYSIS BY TYPE (2024)
FIGURE 139 CANADA MARKET SHARE ANALYSIS BY END USER (2024)
FIGURE 140 MEXICO MARKET SHARE ANALYSIS BY TYPE (2024)
FIGURE 141 MEXICO MARKET SHARE ANALYSIS BY END USER (2024)
FIGURE 142 CHINA MARKET SHARE ANALYSIS BY TYPE (2024)
FIGURE 143 CHINA MARKET SHARE ANALYSIS BY END USER (2024)
FIGURE 144 JAPAN MARKET SHARE ANALYSIS BY TYPE (2024)
FIGURE 145 JAPAN MARKET SHARE ANALYSIS BY END USER (2024)
FIGURE 146 INDIA MARKET SHARE ANALYSIS BY TYPE (2024)
FIGURE 147 INDIA MARKET SHARE ANALYSIS BY END USER (2024)
FIGURE 148 SOUTH KOREA MARKET SHARE ANALYSIS BY TYPE (2024)
FIGURE 149 SOUTH KOREA MARKET SHARE ANALYSIS BY END USER (2024)
FIGURE 150 SAUDI ARABIA MARKET SHARE ANALYSIS BY TYPE (2024)
FIGURE 151 SAUDI ARABIA MARKET SHARE ANALYSIS BY END USER (2024)
FIGURE 152 UAE MARKET SHARE ANALYSIS BY TYPE (2024)
FIGURE 153 UAE MARKET SHARE ANALYSIS BY END USER (2024)
FIGURE 154 EGYPT MARKET SHARE ANALYSIS BY TYPE (2024)
FIGURE 155 EGYPT MARKET SHARE ANALYSIS BY END USER (2024)
FIGURE 156 NIGERIA MARKET SHARE ANALYSIS BY TYPE (2024)
FIGURE 157 NIGERIA MARKET SHARE ANALYSIS BY END USER (2024)
FIGURE 158 SOUTH AFRICA MARKET SHARE ANALYSIS BY TYPE (2024)
FIGURE 159 SOUTH AFRICA MARKET SHARE ANALYSIS BY END USER (2024)
FIGURE 160 GERMANY MARKET SHARE ANALYSIS BY TYPE (2024)
FIGURE 161 GERMANY MARKET SHARE ANALYSIS BY END USER (2024)
FIGURE 162 FRANCE MARKET SHARE ANALYSIS BY TYPE (2024)
FIGURE 163 FRANCE MARKET SHARE ANALYSIS BY END USER (2024)
FIGURE 164 UK MARKET SHARE ANALYSIS BY TYPE (2024)
FIGURE 165 UK MARKET SHARE ANALYSIS BY END USER (2024)
FIGURE 166 SPAIN MARKET SHARE ANALYSIS BY TYPE (2024)
FIGURE 167 SPAIN MARKET SHARE ANALYSIS BY END USER (2024)
FIGURE 168 ITALY MARKET SHARE ANALYSIS BY TYPE (2024)
FIGURE 169 ITALY MARKET SHARE ANALYSIS BY END USER (2024)
FIGURE 170 BRAZIL MARKET SHARE ANALYSIS BY TYPE (2024)
FIGURE 171 BRAZIL MARKET SHARE ANALYSIS BY END USER (2024)
FIGURE 172 ARGENTINA MARKET SHARE ANALYSIS BY TYPE (2024)
FIGURE 173 ARGENTINA MARKET SHARE ANALYSIS BY END USER (2024)
FIGURE 174 COLUMBIA MARKET SHARE ANALYSIS BY TYPE (2024)
FIGURE 175 COLUMBIA MARKET SHARE ANALYSIS BY END USER (2024)
FIGURE 176 GLOBAL BATTERY MATERIAL CURRENT AND FUTURE MARKET KEY COUNTRY LEVEL ANALYSIS, 2024–2034, (USD MILLION)
FIGURE 177 FINANCIAL OVERVIEW:
Key Players Analysis:
BASF SE: BASF is a leading global supplier of advanced cathode active materials (CAM) for lithium-ion batteries, providing high-performance CAM to the world’s largest cell producers and for leading OEM platforms. The company complements its portfolio with sourcing and metals management, as well as various battery recycling solutions. By leveraging industry-leading R&D platforms and a strong innovation pipeline, BASF aims to fulfill customers' sustainability ambitions, driven by responsible sourcing and a low carbon footprint.
Umicore Cobalt & Specialty Materials (CSM): Umicore offers a varied portfolio of reliable, high-performance materials for lithium-ion battery applications, from pure battery-grade cobalt and nickel compounds to next-generation cathode active materials. The company is committed to responsible sourcing, implementing due diligence in cobalt supply chains, promoting traceability, and extending these practices to materials like nickel and lithium. Umicore's sustainable supply chains aim to close the loop for critical materials and limit carbon emissions.
POSCO: POSCO Future M produces cathode active materials and anodes for EV batteries. The company is showing rapid growth by receiving significant orders from major domestic battery companies. As of 2023, it has a production capacity of 155,000 tons and has set a goal of producing 1 million tons of cathode materials by 2030. POSCO is aggressively expanding its plants and plans to increase production of precursors and cathode materials significantly by 2030.
Sumitomo Corporation: Sumitomo Corporation has formed a strategic alliance with Tivan Limited to develop the Speewah Fluorite Project in Western Australia's East Kimberley region. This marks Sumitomo's first venture into Australia's critical minerals sector. Under the agreement, Sumitomo will be the exclusive distributor of Speewah's commercial-grade fluorspar in Asia, focusing on the Japanese market. Fluorspar is crucial for semiconductor manufacturing and electric vehicle battery production.
Targray Technology International: Targray is a leading global supplier of battery materials for lithium-ion cell manufacturers. The company delivers proven safety, higher efficiency, and longer cycles, with materials trusted by commercial battery manufacturers, developers, and research labs worldwide. Targray's product line includes cathode materials, copper foil, electrolyte solutions, nickel foil, binders, pouch cell material, graphite anode materials, aluminum foil, and battery packaging. The company focuses on delivering value through product and process innovation, working collaboratively with battery companies on sourcing advanced materials, enhancing product features, lowering lead times, and managing risk in the supply chain.
Market Key Players
Asahi Kasei
Umicore Cobalt & Specialty Materials (CSM)
BASF SE
Hitachi Chemical Co., Ltd.
Toray Industries
Sumitomo Corporation
Johnson Matthey
TCI Chemicals (India) Pvt. Ltd.
Kureha Corporation
Mitsubishi Chemical Holdings
Targray Technology International
NEI Corporation
NEO Battery Materials Ltd.
NICHIA CORPORATION
3M
Posco
Shanghai Shanshan Tech Co., Ltd.
Driver:
Surging Demand for Electric Vehicles (EVs)
The explosive growth in the electric vehicle industry has significantly increased the consumption of lithium-ion batteries, which require critical raw materials such as lithium, cobalt, and nickel. As automakers ramp up EV production, especially in regions like Europe and China, battery material suppliers are under pressure to scale up capacity. Battery performance, range, and charging efficiency are key differentiators in the EV space, increasing the need for higher-purity and more efficient materials. The push for sustainability and carbon neutrality by governments is also creating long-term demand momentum in this segment.
Government Policies and Clean Energy Targets
Supportive regulations and financial incentives are boosting investments in battery manufacturing and raw material sourcing. Countries like the U.S., Germany, and South Korea have introduced policy frameworks to localize battery production and reduce dependence on imports. Renewable energy projects now require efficient energy storage systems, increasing demand for large-scale battery deployments. This results in higher consumption of materials like lithium iron phosphate (LFP), further driving market growth.
Restrain:
Supply Chain Disruptions and Material Scarcity
Sourcing key battery materials like cobalt and lithium remains challenging due to limited geographical availability and geopolitical instability. The Democratic Republic of the Congo, for example, dominates cobalt production but poses ethical and political risks. COVID-19 and subsequent global crises exposed the vulnerability of the supply chain, with shipping delays and shortages causing production setbacks. These supply constraints inflate costs and challenge long-term supply security for manufacturers.
Environmental and Regulatory Challenges
The extraction and processing of battery materials raise environmental concerns, including water use, habitat destruction, and pollution. Additionally, tightening environmental regulations can delay project approvals and increase operational costs for mining and processing companies. Increasing scrutiny from investors and consumers regarding the sustainability of battery components adds reputational risk, compelling companies to invest in cleaner technologies and traceable sourcing, which may increase upfront costs.
Opportunities:
Battery Recycling and Circular Economy
Battery recycling is emerging as a crucial strategy to address supply shortages and reduce environmental impact. Companies are investing in technologies to recover lithium, cobalt, and nickel from used batteries, creating a secondary supply stream. Governments are encouraging recycling through mandates and subsidies, and automakers are partnering with recyclers to secure critical materials. This not only supports cost reduction but also enhances the sustainability profile of EVs and energy storage systems.
Next-Generation Battery Technologies
Solid-state batteries, lithium-sulfur batteries, and sodium-ion technologies are under development, offering new market segments for material suppliers. These advanced technologies require novel materials such as solid electrolytes, high-capacity anodes, and new cathode chemistries. As R&D progresses, companies entering early into these materials are likely to gain competitive advantages. Startups and established material firms alike are pursuing strategic partnerships to capitalize on the future of battery technology.
Trends:
Localization and Vertical Integration
Battery manufacturers are increasingly looking to establish vertically integrated supply chains to minimize risks and control costs. Companies like Tesla, CATL, and LG Energy Solution are investing in their own mining and refining operations. Governments are also incentivizing local battery ecosystems to reduce dependency on foreign materials. This trend is expected to increase domestic investment in raw material extraction and processing in key markets like the U.S., EU, and India.
Sustainable and Low-Carbon Materials
As ESG (Environmental, Social, Governance) standards become central to investment decisions, battery producers are prioritizing green materials. There’s a rising shift toward cobalt-free or low-cobalt chemistries like LFP and NMC 811. Suppliers are focusing on reducing carbon footprints through renewable-powered operations and efficient extraction technologies. Certification schemes and blockchain-based traceability are being adopted to verify ethical and sustainable sourcing, influencing buying decisions across the supply chain.
Recent Development:
In April 2025 - Australia-based Sayona Mining is acquiring U.S.-based Piedmont Lithium in an all-stock deal valued at approximately $1.2 billion, marking a major consolidation in the North American lithium sector. The combined company will operate under the name "Elevra Lithium," creating the largest hard-rock lithium producer in the United States and significantly reshaping the regional lithium supply chain. The merger, which will result in a roughly 50:50 equity split between Sayona and Piedmont shareholders, is expected to close by mid-2025, pending shareholder and regulatory approvals.
In January 2025 - NEO Battery Materials Ltd. (“NEO” or the “Company”) (TSXV: NBM) (OTC: NBMFF), a developer of low-cost silicon anode materials for longer-lasting, fast-charging lithium-ion batteries, has announced the launch of its advanced high-performance silicon anode product, NBMSiDE® P-300, which delivers breakthrough battery capacity. In addition to its main focus on electric vehicles and electronics, NEO is expanding its strategic downstream efforts to include the space and electric vertical take-off and landing (eVTOL) industries by leveraging the compatibility of its technology with solid-state batteries.