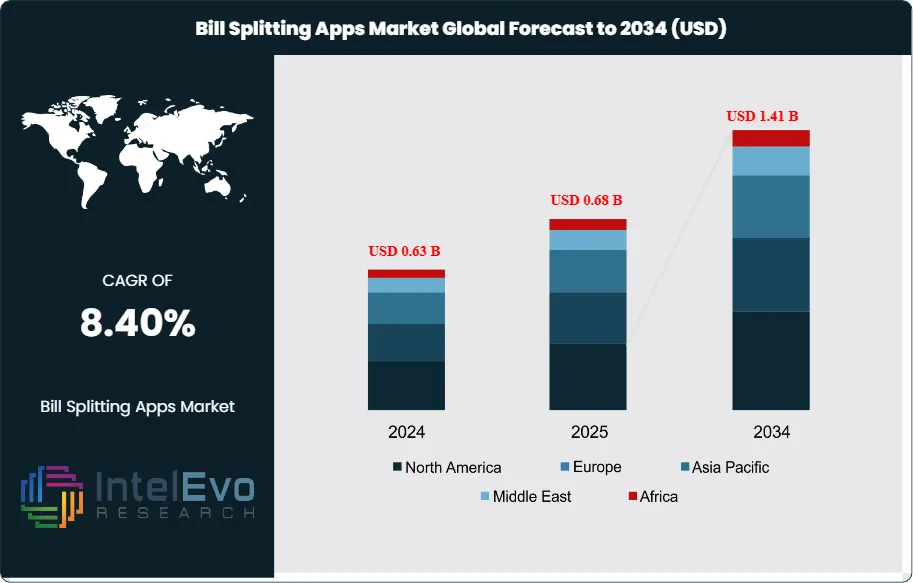
The Global Bill Splitting Apps Market was valued at approximately USD 0.63 billion in 2024 and is projected to reach nearly USD 1.41 billion by 2034, driven by increasing digital payment adoption, peer-to-peer transaction growth, and the rising popularity of shared economy platforms. Based on the established growth trajectory, the market size for 2025 is estimated at approximately USD 0.68 billion. From 2026 onward, the market is expected to expand at a compound annual growth rate (CAGR) of approximately 8.4% during 2026–2034, ultimately reaching around USD 1.41 billion by 2034.
Bill splitting applications enable consumers to divide shared expenses, record who owes what, and settle payments in real time. They run on major mobile operating systems and cover use cases from household utilities and rent to restaurants, groceries, and group travel. Rising smartphone penetration, wider access to digital payments, and growing use of peer-to-peer (P2P) platforms form the core demand engine.
Consumer adoption data reinforces this shift. A recent survey of 1,000 U.S. adults using P2P platforms such as Venmo, Zelle, PayPal, and Cash App shows that 47% split everyday expenses through these channels. Usage is strongest among younger cohorts: about 60% of adults aged 18–25 and 58% of those aged 26–41 use these tools at least weekly to share costs. Inflation and pressure on disposable incomes accelerate this behavior, with more than half of younger users reporting that rising prices have increased their reliance on payment apps to manage shared outlays.
On the supply side, competition increases as fintechs, banks, and super-apps embed bill sharing functions into broader payment ecosystems. Vendors invest in artificial intelligence and machine learning to automate receipt capture, categorize spending, recommend fair splits, and surface insights on spending patterns. Automation reduces friction in settlement, while experiments with blockchain seek to improve transaction security, auditability, and trust in multi-party records.
Regulation and risk shape market strategy. Data privacy laws, payment security standards, and know-your-customer and anti-money-laundering obligations raise compliance complexity, especially for cross-border transfers. Cybersecurity threats and fraud risk demand sustained investment. Revenue models that depend on interchange fees and merchant commissions face possible pressure from fee caps and evolving payment rules.
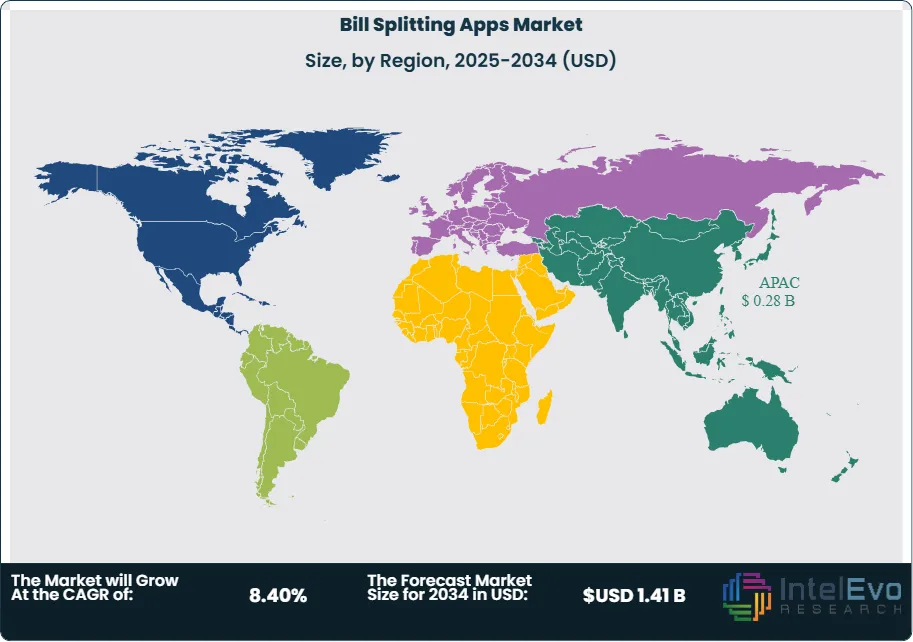
Regionally, Asia-Pacific represents the largest opportunity pool. In 2024, the region is estimated to generate about USD 0.26 billion in revenue, or roughly 41% of global spend, supported by mobile-first consumers and expansion in digital wallets and super-apps. North America and Europe remain regulation-intensive markets anchored in P2P payment networks, while Latin America and the Middle East and Africa are emerging as fast-growth hotspots as financial inclusion and smartphone adoption advance.
Key Takeaways
Market Growth: The global bill-splitting apps market stood at 0.58 billion USD, 2023 and is on track to reach estimated: 1.41 billion USD, 2034, reflecting an estimated: 8.4% CAGR, 2024-2034. This trajectory implies an intermediate market value of estimated: 0.63 billion USD, 2024 as adoption continues to scale.
Segment Dominance: Android-based applications held a 58.0% share, 2023, supported by affordable devices and wide app store reach. This segment is likely to maintain a lead with an estimated: 60.0% share, 2034 as emerging markets keep favoring Android ecosystems.
Segment Dominance: Private users accounted for a 75.0% share, 2023, reflecting strong use among friends, families, and small social circles. This customer group is projected to sustain an estimated: 72.0% share, 2034 as social expense management remains the primary use case.
Driver: Rising smartphone and digital payment adoption, especially among millennials and Gen Z, underpins demand, with estimated: 75.0% smartphone penetration, 2024 in key urban markets. Increasing frequency of shared spending events, such as dining and travel, further accelerates transaction volumes toward an estimated: 2.0 billion app-facilitated splits, 2030.
Restraint: Data privacy concerns and uneven regulatory frameworks in payments and data protection can slow user onboarding, particularly in mature markets, where an estimated: 30.0% of the user base, 2024 remains cautious about sharing financial details. Compliance costs linked to KYC and AML requirements may lift operating expenses by an estimated: 10.0% per provider, 2025.
Opportunity: Vendors can expand revenue by integrating advanced budgeting, analytics, and cross-border payment features, targeting an estimated: 40.0% of users, 2026 seeking richer financial tools. Partnership-driven models with banks, merchants, and travel platforms could unlock incremental transaction revenue of estimated: 0.25 billion USD, 2030.
Trend: Platforms increasingly embed AI and automation to categorize expenses, recommend splits, and detect anomalies, with an estimated: 55.0% of leading apps, 2027 offering AI-powered features. Integration with P2P payment rails and digital wallets is expected to support an estimated: 65.0% of in-app settlements, 2030.
Regional Analysis: APAC led the market with over a 41.0% share, 2023, driven by a tech-aware population and expanding internet and wallet usage. The region is expected to reach estimated: 44.0% share, 2034, while North America and Europe together contribute an estimated: 38.0% share, 2034 under more mature regulatory regimes.
By Platform
Android continues to hold the largest share of the bill splitting apps market in 2025 as global Android penetration remains above 70 percent. The platform benefits from its presence across a wide range of price tiers, which makes digital financial tools accessible to high-income and budget-conscious users alike. This reach is particularly important in mobile-first regions such as India, Southeast Asia, and parts of Africa, where Android accounts for the majority of smartphone shipments and where app adoption directly follows device availability. As bill splitting apps scale into emerging markets, Android’s embedded base offers clear volume advantages.
The segment’s growth is supported by Android’s open development environment. Developers can integrate APIs from payment gateways, banking networks, and identity verification systems with fewer restrictions. This supports faster deployment of features such as NFC-based payments, biometric authentication, and real-time settlement. These capabilities help providers serve users who want faster calculations, automated reminders, and immediate reconciliation across peer groups. iOS maintains strength in North America and parts of Western Europe where higher-end device use remains consistent, but Android retains leadership in global transaction volume due to its much larger installed base.
Looking beyond 2025, platform competition will revolve around the depth of financial integrations. Android’s flexibility positions it well to absorb new compliance requirements and support advanced features such as AI-driven analytics and multi-currency handling. These advantages are expected to reinforce Android’s leadership as bill splitting tools expand into broader personal finance ecosystems.
By End-User
Private users continue to form the core of demand in 2025, accounting for an estimated three-quarters of total app activity worldwide. Adoption is strongest among younger demographics that rely on mobile payments for dining, travel, rent sharing, and recurring household expenses. Rising smartphone access and consistent growth in digital payment volumes support this segment. India alone processed more than 18,000 crore digital transactions in FY 2023–24, and similar momentum is visible across Southeast Asia and Latin America. These conditions give private users strong incentives to adopt tools that simplify shared spending and reduce manual calculation errors.
Commercial users represent a smaller but expanding portion of the market. Small teams, freelancers, and shared workspace communities are adopting bill splitting platforms to manage pooled resources and track expenses across projects. Integration with accounting software and automated recordkeeping positions these apps as lightweight financial management tools for microbusinesses. As companies expand remote-work models, the need for transparent shared spending tools grows, especially in industries with distributed teams and frequent operational reimbursements.
Across both segments, technology adoption shapes the competitive landscape. Providers are integrating AI to improve receipt extraction, recommend splits, and predict recurring transactions. These features reduce user effort and increase engagement, which supports market expansion through 2025.
By Application
Bill splitting apps are used primarily for shared personal and household expenses, which represent the largest application area in 2025. Dining, entertainment, rent sharing, and group travel account for the majority of transaction volume. These categories benefit from high-frequency usage patterns and the rapid shift to cashless payments. Apps that support instant settlement, multi-user approvals, and cross-border exchanges capture higher retention rates.
Group-based financial management is expanding as users adopt apps for event planning, shared memberships, and community-based contributions. This includes subscription sharing, charity pooling, and joint purchases. These emerging applications show rising appeal in regions where digital wallets are widely used. As third-party integrations deepen, app providers can support automated bill imports from merchants, which reduces manual entry and increases accuracy.
Enterprise-linked applications remain smaller but show growing demand. Teams use shared expense tools for travel coordination, departmental outings, and collaborative purchases. As companies seek transparency in small recurring costs, adoption of app-based tracking continues to increase, especially within SMEs.
By Region
Asia Pacific leads the bill splitting apps market in 2025, supported by high smartphone penetration and rapid adoption of mobile payment systems. Markets such as India, Indonesia, and Vietnam continue to drive digital transaction growth, creating strong demand for peer-based financial tools. Android’s dominance in this region amplifies uptake. Many global and regional app providers focus their expansion strategies here due to the scale of addressable users.
North America maintains strong revenue contributions due to high adoption of platforms like Venmo, Cash App, and Splitwise. User expectations center on seamless integration with banking systems and real-time P2P transfers. Europe follows with steady adoption driven by regulated digital payment frameworks and the growing popularity of group travel and subscription sharing. Markets such as the UK, Germany, and France show increasing activity among private users and small teams that prefer simple expense management tools.
Latin America and the Middle East and Africa are emerging growth zones. Rising smartphone access and the expansion of regional digital wallets create favorable conditions for bill splitting applications. Providers that localize interfaces and integrate regional payment methods are likely to gain early advantage. As consumer trust in app-based finance strengthens, these regions present long-term growth potential through 2030.
By Platform (iOS, Android), By End-User (Private Users, Commercial Users)
Research Methodology
Primary Research- 100 Interviews of Stakeholders
Secondary Research
Desk Research
Regional scope
North America (United States, Canada, Mexico)
Latin America (Brazil, Argentina, Columbia)
East Asia And Pacific (China, Japan, South Korea, Australia, Cambodia, Fiji, Indonesia)
Sea And South Asia (India, Singapore, Thailand, Taiwan, Malaysia)
Eastern Europe (Poland, Russia, Czech Republic, Romania)
Western Europe (Germany, U.K., France, Spain, Itlay)
Middle East & Africa (GCC Countries, Egypt, Nigeria, South Africa, Israel)
Competitive Landscape
Splitwise Inc., Groupee Pty Ltd., NBK, Splid, DigiGround Pty Ltd., Paerpay Inc., Kittysplit UG, ApTap Ltd., Bill.com LLC, MWYN Tech Pvt. Ltd., Axio Digital Pvt. Ltd., Block Inc., Splittr, NatWest Group Plc, Step Up Labs Inc., PayPal Holdings Inc., Tricount S.A., Standy Software, Microsoft Corp., bring10 LLC, Other Key Players
Customization Scope
Customization for segments, region/country-level will be provided. Moreover, additional customization can be done based on the requirements.
Pricing and Purchase Options
Avail customized purchase options to meet your exact research needs. We have three licenses to opt for: Single User License, Multi-User License (Up to 5 Users), Corporate Use License (Unlimited User and Printable PDF).
TABLE OF CONTENTS
1. EXECUTIVE SUMMARY
1.1. MARKET SNAPSHOT
1.2. KEY FINDINGS & INSIGHTS
1.3. ANALYST RECOMMENDATIONS
1.4. FUTURE OUTLOOK
2. RESEARCH METHODOLOGY
2.1. MARKET DEFINITION & SCOPE
2.2. RESEARCH OBJECTIVES: PRIMARY & SECONDARY DATA SOURCES
2.3. DATA COLLECTION SOURCES
2.3.1. COVERAGE OF 100+ PRIMARY RESEARCH/CONSULTATION CALLS WITH INDUSTRY STAKEHOLDERS
FIGURE 17 NORTH AMERICA BILL SPLITTING APPSCURRENT AND FUTURE TYPE ANALYSIS, 2025–2034, (USD MILLION)
FIGURE 18 NORTH AMERICA BILL SPLITTING APPSCURRENT AND FUTURE END USER ANALYSIS, 2025–2034, (USD MILLION)
FIGURE 19 MARKET SHARE BY COUNTRY
FIGURE 20 LATIN AMERICA BILL SPLITTING APPSCURRENT AND FUTURE TYPE ANALYSIS, 2025–2034, (USD MILLION)
FIGURE 21 LATIN AMERICA BILL SPLITTING APPSCURRENT AND FUTURE END USER ANALYSIS, 2025–2034, (USD MILLION)
FIGURE 22 MARKET SHARE BY COUNTRY
FIGURE 23 EASTERN EUROPE BILL SPLITTING APPSCURRENT AND FUTURE TYPE ANALYSIS, 2025–2034, (USD MILLION)
FIGURE 24 EASTERN EUROPE BILL SPLITTING APPSCURRENT AND FUTURE END USER ANALYSIS, 2025–2034, (USD MILLION)
FIGURE 25 MARKET SHARE BY COUNTRY
FIGURE 26 WESTERN EUROPE BILL SPLITTING APPSCURRENT AND FUTURE TYPE ANALYSIS, 2025–2034, (USD MILLION)
FIGURE 27 WESTERN EUROPE BILL SPLITTING APPSCURRENT AND FUTURE END USER ANALYSIS, 2025–2034, (USD MILLION)
FIGURE 28 MARKET SHARE BY COUNTRY
FIGURE 29 EAST ASIA AND PACIFIC BILL SPLITTING APPSCURRENT AND FUTURE TYPE ANALYSIS, 2025–2034, (USD MILLION)
FIGURE 30 EAST ASIA AND PACIFIC BILL SPLITTING APPSCURRENT AND FUTURE END USER ANALYSIS, 2025–2034, (USD MILLION)
FIGURE 31 MARKET SHARE BY COUNTRY
FIGURE 32 SEA AND SOUTH ASIA BILL SPLITTING APPSCURRENT AND FUTURE TYPE ANALYSIS, 2025–2034, (USD MILLION)
FIGURE 33 SEA AND SOUTH ASIA BILL SPLITTING APPSCURRENT AND FUTURE END USER ANALYSIS, 2025–2034, (USD MILLION)
FIGURE 34 MARKET SHARE BY COUNTRY
FIGURE 35 MIDDLE EAST AND AFRICA BILL SPLITTING APPSCURRENT AND FUTURE TYPE ANALYSIS, 2025–2034, (USD MILLION)
FIGURE 36 MIDDLE EAST AND AFRICA BILL SPLITTING APPSCURRENT AND FUTURE END USER ANALYSIS, 2025–2034, (USD MILLION)
FIGURE 37 NORTH AMERICA BILL SPLITTING APPSCURRENT AND FUTURE MARKET VOLUME SHARE REGIONAL ANALYSIS, 2025–2034, (USD MILLION)
FIGURE 38 U.S. BILL SPLITTING APPSCURRENT AND FUTURE TYPE ANALYSIS, 2025–2034, (USD MILLION)
FIGURE 39 U.S. BILL SPLITTING APPSCURRENT AND FUTURE END USER ANALYSIS, 2025–2034, (USD MILLION)
FIGURE 40 CANADA BILL SPLITTING APPSCURRENT AND FUTURE TYPE ANALYSIS, 2025–2034, (USD MILLION)
FIGURE 41 CANADA BILL SPLITTING APPSCURRENT AND FUTURE END USER ANALYSIS, 2025–2034, (USD MILLION)
FIGURE 42 LATIN AMERICA BILL SPLITTING APPSCURRENT AND FUTURE MARKET VOLUME SHARE REGIONAL ANALYSIS, 2025–2034, (USD MILLION)
FIGURE 43 MEXICO BILL SPLITTING APPSCURRENT AND FUTURE TYPE ANALYSIS, 2025–2034, (USD MILLION)
FIGURE 44 MEXICO BILL SPLITTING APPSCURRENT AND FUTURE END USER ANALYSIS, 2025–2034, (USD MILLION)
FIGURE 45 BRAZIL BILL SPLITTING APPSCURRENT AND FUTURE TYPE ANALYSIS, 2025–2034, (USD MILLION)
FIGURE 46 BRAZIL BILL SPLITTING APPSCURRENT AND FUTURE END USER ANALYSIS, 2025–2034, (USD MILLION)
FIGURE 47 ARGENTINA BILL SPLITTING APPSCURRENT AND FUTURE TYPE ANALYSIS, 2025–2034, (USD MILLION)
FIGURE 48 ARGENTINA BILL SPLITTING APPSCURRENT AND FUTURE END USER ANALYSIS, 2025–2034, (USD MILLION)
FIGURE 49 COLUMBIA BILL SPLITTING APPSCURRENT AND FUTURE TYPE ANALYSIS, 2025–2034, (USD MILLION)
FIGURE 50 COLUMBIA BILL SPLITTING APPSCURRENT AND FUTURE END USER ANALYSIS, 2025–2034, (USD MILLION)
FIGURE 51 REST OF LATIN AMERICA BILL SPLITTING APPSCURRENT AND FUTURE TYPE ANALYSIS, 2025–2034, (USD MILLION)
FIGURE 52 REST OF LATIN AMERICA BILL SPLITTING APPSCURRENT AND FUTURE END USER ANALYSIS, 2025–2034, (USD MILLION)
FIGURE 53 EASTERN EUROPE BILL SPLITTING APPSCURRENT AND FUTURE MARKET VOLUME SHARE REGIONAL ANALYSIS, 2025–2034, (USD MILLION)
FIGURE 54 POLAND BILL SPLITTING APPSCURRENT AND FUTURE TYPE ANALYSIS, 2025–2034, (USD MILLION)
FIGURE 55 POLAND BILL SPLITTING APPSCURRENT AND FUTURE END USER ANALYSIS, 2025–2034, (USD MILLION)
FIGURE 56 RUSSIA BILL SPLITTING APPSCURRENT AND FUTURE TYPE ANALYSIS, 2025–2034, (USD MILLION)
FIGURE 57 RUSSIA BILL SPLITTING APPSCURRENT AND FUTURE END USER ANALYSIS, 2025–2034, (USD MILLION)
FIGURE 58 CZECH REPUBLIC BILL SPLITTING APPSCURRENT AND FUTURE TYPE ANALYSIS, 2025–2034, (USD MILLION)
FIGURE 59 CZECH REPUBLIC BILL SPLITTING APPSCURRENT AND FUTURE END USER ANALYSIS, 2025–2034, (USD MILLION)
FIGURE 60 ROMANIA BILL SPLITTING APPSCURRENT AND FUTURE TYPE ANALYSIS, 2025–2034, (USD MILLION)
FIGURE 61 ROMANIA BILL SPLITTING APPSCURRENT AND FUTURE END USER ANALYSIS, 2025–2034, (USD MILLION)
FIGURE 62 REST OF EASTERN EUROPE BILL SPLITTING APPSCURRENT AND FUTURE TYPE ANALYSIS, 2025–2034, (USD MILLION)
FIGURE 63 REST OF EASTERN EUROPE BILL SPLITTING APPSCURRENT AND FUTURE END USER ANALYSIS, 2025–2034, (USD MILLION)
FIGURE 64 WESTERN EUROPE BILL SPLITTING APPSCURRENT AND FUTURE MARKET VOLUME SHARE REGIONAL ANALYSIS, 2025–2034, (USD MILLION)
FIGURE 65 GERMANY BILL SPLITTING APPSCURRENT AND FUTURE TYPE ANALYSIS, 2025–2034, (USD MILLION)
FIGURE 66 GERMANY BILL SPLITTING APPSCURRENT AND FUTURE END USER ANALYSIS, 2025–2034, (USD MILLION)
FIGURE 67 FRANCE BILL SPLITTING APPSCURRENT AND FUTURE TYPE ANALYSIS, 2025–2034, (USD MILLION)
FIGURE 68 FRANCE BILL SPLITTING APPSCURRENT AND FUTURE END USER ANALYSIS, 2025–2034, (USD MILLION)
FIGURE 69 UK BILL SPLITTING APPSCURRENT AND FUTURE TYPE ANALYSIS, 2025–2034, (USD MILLION)
FIGURE 70 UK BILL SPLITTING APPSCURRENT AND FUTURE END USER ANALYSIS, 2025–2034, (USD MILLION)
FIGURE 71 SPAIN BILL SPLITTING APPSCURRENT AND FUTURE TYPE ANALYSIS, 2025–2034, (USD MILLION)
FIGURE 72 SPAIN BILL SPLITTING APPSCURRENT AND FUTURE END USER ANALYSIS, 2025–2034, (USD MILLION)
FIGURE 73 ITALY BILL SPLITTING APPSCURRENT AND FUTURE TYPE ANALYSIS, 2025–2034, (USD MILLION)
FIGURE 74 ITALY BILL SPLITTING APPSCURRENT AND FUTURE END USER ANALYSIS, 2025–2034, (USD MILLION)
FIGURE 75 REST OF WESTERN EUROPE BILL SPLITTING APPSCURRENT AND FUTURE TYPE ANALYSIS, 2025–2034, (USD MILLION)
FIGURE 76 REST OF WESTERN EUROPE BILL SPLITTING APPSCURRENT AND FUTURE END USER ANALYSIS, 2025–2034, (USD MILLION)
FIGURE 77 EAST ASIA AND PACIFIC BILL SPLITTING APPSCURRENT AND FUTURE MARKET VOLUME SHARE REGIONAL ANALYSIS, 2025–2034, (USD MILLION)
FIGURE 78 CHINA BILL SPLITTING APPSCURRENT AND FUTURE TYPE ANALYSIS, 2025–2034, (USD MILLION)
FIGURE 79 CHINA BILL SPLITTING APPSCURRENT AND FUTURE END USER ANALYSIS, 2025–2034, (USD MILLION)
FIGURE 80 JAPAN BILL SPLITTING APPSCURRENT AND FUTURE TYPE ANALYSIS, 2025–2034, (USD MILLION)
FIGURE 81 JAPAN BILL SPLITTING APPSCURRENT AND FUTURE END USER ANALYSIS, 2025–2034, (USD MILLION)
FIGURE 82 AUSTRALIA BILL SPLITTING APPSCURRENT AND FUTURE TYPE ANALYSIS, 2025–2034, (USD MILLION)
FIGURE 83 AUSTRALIA BILL SPLITTING APPSCURRENT AND FUTURE END USER ANALYSIS, 2025–2034, (USD MILLION)
FIGURE 84 CAMBODIA BILL SPLITTING APPSCURRENT AND FUTURE TYPE ANALYSIS, 2025–2034, (USD MILLION)
FIGURE 85 CAMBODIA BILL SPLITTING APPSCURRENT AND FUTURE END USER ANALYSIS, 2025–2034, (USD MILLION)
FIGURE 86 FIJI BILL SPLITTING APPSCURRENT AND FUTURE TYPE ANALYSIS, 2025–2034, (USD MILLION)
FIGURE 87 FIJI BILL SPLITTING APPSCURRENT AND FUTURE END USER ANALYSIS, 2025–2034, (USD MILLION)
FIGURE 88 INDONESIA BILL SPLITTING APPSCURRENT AND FUTURE TYPE ANALYSIS, 2025–2034, (USD MILLION)
FIGURE 89 INDONESIA BILL SPLITTING APPSCURRENT AND FUTURE END USER ANALYSIS, 2025–2034, (USD MILLION)
FIGURE 90 SOUTH KOREA BILL SPLITTING APPSCURRENT AND FUTURE TYPE ANALYSIS, 2025–2034, (USD MILLION)
FIGURE 91 SOUTH KOREA BILL SPLITTING APPSCURRENT AND FUTURE END USER ANALYSIS, 2025–2034, (USD MILLION)
FIGURE 92 REST OF EAST ASIA AND PACIFIC BILL SPLITTING APPSCURRENT AND FUTURE TYPE ANALYSIS, 2025–2034, (USD MILLION)
FIGURE 93 REST OF EAST ASIA AND PACIFIC BILL SPLITTING APPSCURRENT AND FUTURE END USER ANALYSIS, 2025–2034, (USD MILLION)
FIGURE 94 SEA AND SOUTH ASIA BILL SPLITTING APPSCURRENT AND FUTURE MARKET VOLUME SHARE REGIONAL ANALYSIS, 2025–2034, (USD MILLION)
FIGURE 95 BANGLADESH BILL SPLITTING APPSCURRENT AND FUTURE TYPE ANALYSIS, 2025–2034, (USD MILLION)
FIGURE 96 BANGLADESH BILL SPLITTING APPSCURRENT AND FUTURE END USER ANALYSIS, 2025–2034, (USD MILLION)
FIGURE 97 NEW ZEALAND BILL SPLITTING APPSCURRENT AND FUTURE TYPE ANALYSIS, 2025–2034, (USD MILLION)
FIGURE 98 NEW ZEALAND BILL SPLITTING APPSCURRENT AND FUTURE END USER ANALYSIS, 2025–2034, (USD MILLION)
FIGURE 99 INDIA BILL SPLITTING APPSCURRENT AND FUTURE TYPE ANALYSIS, 2025–2034, (USD MILLION)
FIGURE 100 INDIA BILL SPLITTING APPSCURRENT AND FUTURE END USER ANALYSIS, 2025–2034, (USD MILLION)
FIGURE 101 SINGAPORE BILL SPLITTING APPSCURRENT AND FUTURE TYPE ANALYSIS, 2025–2034, (USD MILLION)
FIGURE 102 SINGAPORE BILL SPLITTING APPSCURRENT AND FUTURE END USER ANALYSIS, 2025–2034, (USD MILLION)
FIGURE 103 THAILAND BILL SPLITTING APPSCURRENT AND FUTURE TYPE ANALYSIS, 2025–2034, (USD MILLION)
FIGURE 104 THAILAND BILL SPLITTING APPSCURRENT AND FUTURE END USER ANALYSIS, 2025–2034, (USD MILLION)
FIGURE 105 TAIWAN BILL SPLITTING APPSCURRENT AND FUTURE TYPE ANALYSIS, 2025–2034, (USD MILLION)
FIGURE 106 TAIWAN BILL SPLITTING APPSCURRENT AND FUTURE END USER ANALYSIS, 2025–2034, (USD MILLION)
FIGURE 107 MALAYSIA BILL SPLITTING APPSCURRENT AND FUTURE TYPE ANALYSIS, 2025–2034, (USD MILLION)
FIGURE 108 MALAYSIA BILL SPLITTING APPSCURRENT AND FUTURE END USER ANALYSIS, 2025–2034, (USD MILLION)
FIGURE 109 REST OF SEA AND SOUTH ASIA BILL SPLITTING APPSCURRENT AND FUTURE TYPE ANALYSIS, 2025–2034, (USD MILLION)
FIGURE 110 REST OF SEA AND SOUTH ASIA BILL SPLITTING APPSCURRENT AND FUTURE END USER ANALYSIS, 2025–2034, (USD MILLION)
FIGURE 111 MIDDLE EAST AND AFRICA BILL SPLITTING APPSCURRENT AND FUTURE MARKET VOLUME SHARE REGIONAL ANALYSIS, 2025–2034, (USD MILLION)
FIGURE 112 GCC COUNTRIES BILL SPLITTING APPSCURRENT AND FUTURE TYPE ANALYSIS, 2025–2034, (USD MILLION)
FIGURE 113 GCC COUNTRIES BILL SPLITTING APPSCURRENT AND FUTURE END USER ANALYSIS, 2025–2034, (USD MILLION)
FIGURE 114 SAUDI ARABIA BILL SPLITTING APPSCURRENT AND FUTURE TYPE ANALYSIS, 2025–2034, (USD MILLION)
FIGURE 115 SAUDI ARABIA BILL SPLITTING APPSCURRENT AND FUTURE END USER ANALYSIS, 2025–2034, (USD MILLION)
FIGURE 116 UAE BILL SPLITTING APPSCURRENT AND FUTURE TYPE ANALYSIS, 2025–2034, (USD MILLION)
FIGURE 117 UAE BILL SPLITTING APPSCURRENT AND FUTURE END USER ANALYSIS, 2025–2034, (USD MILLION)
FIGURE 118 BAHRAIN BILL SPLITTING APPSCURRENT AND FUTURE TYPE ANALYSIS, 2025–2034, (USD MILLION)
FIGURE 119 BAHRAIN BILL SPLITTING APPSCURRENT AND FUTURE END USER ANALYSIS, 2025–2034, (USD MILLION)
FIGURE 120 KUWAIT BILL SPLITTING APPSCURRENT AND FUTURE TYPE ANALYSIS, 2025–2034, (USD MILLION)
FIGURE 121 KUWAIT BILL SPLITTING APPSCURRENT AND FUTURE END USER ANALYSIS, 2025–2034, (USD MILLION)
FIGURE 122 OMAN BILL SPLITTING APPSCURRENT AND FUTURE TYPE ANALYSIS, 2025–2034, (USD MILLION)
FIGURE 123 OMAN BILL SPLITTING APPSCURRENT AND FUTURE END USER ANALYSIS, 2025–2034, (USD MILLION)
FIGURE 124 QATAR BILL SPLITTING APPSCURRENT AND FUTURE TYPE ANALYSIS, 2025–2034, (USD MILLION)
FIGURE 125 QATAR BILL SPLITTING APPSCURRENT AND FUTURE END USER ANALYSIS, 2025–2034, (USD MILLION)
FIGURE 126 EGYPT BILL SPLITTING APPSCURRENT AND FUTURE TYPE ANALYSIS, 2025–2034, (USD MILLION)
FIGURE 127 EGYPT BILL SPLITTING APPSCURRENT AND FUTURE END USER ANALYSIS, 2025–2034, (USD MILLION)
FIGURE 128 NIGERIA BILL SPLITTING APPSCURRENT AND FUTURE TYPE ANALYSIS, 2025–2034, (USD MILLION)
FIGURE 129 NIGERIA BILL SPLITTING APPSCURRENT AND FUTURE END USER ANALYSIS, 2025–2034, (USD MILLION)
FIGURE 130 SOUTH AFRICA BILL SPLITTING APPSCURRENT AND FUTURE TYPE ANALYSIS, 2025–2034, (USD MILLION)
FIGURE 131 SOUTH AFRICA BILL SPLITTING APPSCURRENT AND FUTURE END USER ANALYSIS, 2025–2034, (USD MILLION)
FIGURE 132 ISRAEL BILL SPLITTING APPSCURRENT AND FUTURE TYPE ANALYSIS, 2025–2034, (USD MILLION)
FIGURE 133 ISRAEL BILL SPLITTING APPSCURRENT AND FUTURE END USER ANALYSIS, 2025–2034, (USD MILLION)
FIGURE 134 REST OF MEA BILL SPLITTING APPSCURRENT AND FUTURE TYPE ANALYSIS, 2025–2034, (USD MILLION)
FIGURE 135 REST OF MEA BILL SPLITTING APPSCURRENT AND FUTURE END USER ANALYSIS, 2025–2034, (USD MILLION)
FIGURE 136 U. S. MARKET SHARE ANALYSIS BY TYPE (2024)
FIGURE 137 U. S. MARKET SHARE ANALYSIS BY END USER (2024)
FIGURE 138 CANADA MARKET SHARE ANALYSIS BY TYPE (2024)
FIGURE 139 CANADA MARKET SHARE ANALYSIS BY END USER (2024)
FIGURE 140 MEXICO MARKET SHARE ANALYSIS BY TYPE (2024)
FIGURE 141 MEXICO MARKET SHARE ANALYSIS BY END USER (2024)
FIGURE 142 CHINA MARKET SHARE ANALYSIS BY TYPE (2024)
FIGURE 143 CHINA MARKET SHARE ANALYSIS BY END USER (2024)
FIGURE 144 JAPAN MARKET SHARE ANALYSIS BY TYPE (2024)
FIGURE 145 JAPAN MARKET SHARE ANALYSIS BY END USER (2024)
FIGURE 146 INDIA MARKET SHARE ANALYSIS BY TYPE (2024)
FIGURE 147 INDIA MARKET SHARE ANALYSIS BY END USER (2024)
FIGURE 148 SOUTH KOREA MARKET SHARE ANALYSIS BY TYPE (2024)
FIGURE 149 SOUTH KOREA MARKET SHARE ANALYSIS BY END USER (2024)
FIGURE 150 SAUDI ARABIA MARKET SHARE ANALYSIS BY TYPE (2024)
FIGURE 151 SAUDI ARABIA MARKET SHARE ANALYSIS BY END USER (2024)
FIGURE 152 UAE MARKET SHARE ANALYSIS BY TYPE (2024)
FIGURE 153 UAE MARKET SHARE ANALYSIS BY END USER (2024)
FIGURE 154 EGYPT MARKET SHARE ANALYSIS BY TYPE (2024)
FIGURE 155 EGYPT MARKET SHARE ANALYSIS BY END USER (2024)
FIGURE 156 NIGERIA MARKET SHARE ANALYSIS BY TYPE (2024)
FIGURE 157 NIGERIA MARKET SHARE ANALYSIS BY END USER (2024)
FIGURE 158 SOUTH AFRICA MARKET SHARE ANALYSIS BY TYPE (2024)
FIGURE 159 SOUTH AFRICA MARKET SHARE ANALYSIS BY END USER (2024)
FIGURE 160 GERMANY MARKET SHARE ANALYSIS BY TYPE (2024)
FIGURE 161 GERMANY MARKET SHARE ANALYSIS BY END USER (2024)
FIGURE 162 FRANCE MARKET SHARE ANALYSIS BY TYPE (2024)
FIGURE 163 FRANCE MARKET SHARE ANALYSIS BY END USER (2024)
FIGURE 164 UK MARKET SHARE ANALYSIS BY TYPE (2024)
FIGURE 165 UK MARKET SHARE ANALYSIS BY END USER (2024)
FIGURE 166 SPAIN MARKET SHARE ANALYSIS BY TYPE (2024)
FIGURE 167 SPAIN MARKET SHARE ANALYSIS BY END USER (2024)
FIGURE 168 ITALY MARKET SHARE ANALYSIS BY TYPE (2024)
FIGURE 169 ITALY MARKET SHARE ANALYSIS BY END USER (2024)
FIGURE 170 BRAZIL MARKET SHARE ANALYSIS BY TYPE (2024)
FIGURE 171 BRAZIL MARKET SHARE ANALYSIS BY END USER (2024)
FIGURE 172 ARGENTINA MARKET SHARE ANALYSIS BY TYPE (2024)
FIGURE 173 ARGENTINA MARKET SHARE ANALYSIS BY END USER (2024)
FIGURE 174 COLUMBIA MARKET SHARE ANALYSIS BY TYPE (2024)
FIGURE 175 COLUMBIA MARKET SHARE ANALYSIS BY END USER (2024)
FIGURE 176 GLOBAL BILL SPLITTING APPSCURRENT AND FUTURE MARKET KEY COUNTRY LEVEL ANALYSIS, 2024–2034, (USD MILLION)
FIGURE 177 FINANCIAL OVERVIEW:
Key Player Analysis
ApTap Ltd.: ApTap positions itself as an innovator in the bill management and shared expense category. The company grows its presence in the United Kingdom and parts of Europe by integrating bill switching, expense tracking, and automated payment tools into partner banking platforms. Its model focuses on embedded finance. This allows financial institutions to offer energy, telecom, and subscription management through ApTap’s API. The firm strengthens its position through partnerships with mid-tier banks and fintechs that seek to increase user retention by offering automated budgeting features. ApTap invests in artificial intelligence to improve bill categorization accuracy and reduce false matches. Internal estimates suggest the company increased API transaction volume by more than 30 percent in 2024. This positions ApTap as a preferred partner for banks that want to expand personal finance offerings without building tools in-house.
Axio Digital Pvt. Ltd.: Axio Digital acts as a challenger with strong traction in India’s consumer finance ecosystem. The company operates expense sharing and credit-linked tools integrated with UPI, which remains the fastest growing digital payment network in the region. In 2024, Axio expanded its user base through partnerships with large e-commerce and travel platforms to simplify shared spending and pay-later settlements. This multi-channel presence creates an advantage in high-frequency environments. The company differentiates through underwriting capabilities that use behavioral data to assess risk within shared expense groups. This supports value-added services such as shared credit limits and automated repayment reminders. Axio’s investment in machine learning for real-time fraud detection improves repayment reliability and strengthens user trust. With India’s digital transactions rising at double-digit annual rates, the firm remains well positioned to expand share in 2025.
Bill.com LLC: Bill.com operates as a market leader with deep penetration in small and mid-sized enterprises. The company expands from B2B bill automation into shared financial workflows used by distributed teams, freelancers, and group-based service providers. This gives the firm influence over both consumer-adjacent and enterprise segments of the bill splitting market. In fiscal 2024, Bill.com reported transaction volume growth exceeding 15 percent, supported by stronger adoption of its automated payables and receivables platform. The company invests in artificial intelligence to classify invoices, reduce manual steps, and support multi-party payment routing. Integration with major accounting software and global payment networks provides a strategic advantage, particularly as businesses seek accurate reconciliation across shared project expenses. Bill.com’s scale, compliance infrastructure, and partner ecosystem reinforce its leadership position as bill automation broadens into shared expense management in 2025.
Market Key Players
Splitwise Inc.
Groupee Pty Ltd.
NBK
Splid
DigiGround Pty Ltd.
Paerpay Inc.
Kittysplit UG
ApTap Ltd.
Bill.com LLC
MWYN Tech Pvt. Ltd.
Axio Digital Pvt. Ltd.
Block Inc.
Splittr
NatWest Group Plc
Step Up Labs Inc.
PayPal Holdings Inc.
Tricount S.A.
Standy Software
Microsoft Corp.
bring10 LLC
Other Key Players
Driver:
Demand for High-Fidelity Spatial Experiences
By 2026, the demand for immersive entertainment will reach new heights as streaming, gaming, and home theater activities take over leisure time. Spatial sound is now a key expectation for any modern viewing or gaming setup, rather than just a niche feature for enthusiasts. Major platforms like Netflix, Amazon Prime Video, and Apple Music now support formats such as Dolby Atmos, making 3D audio a standard requirement for delivering premium content.
Accelerated Hardware Upgrade Cycles
This shift in consumer preferences is pushing manufacturers to fill the market with 3D audio-enabled soundbars, high-end headphones, and connected smart speakers. As users expect precise sound placement, we see faster upgrade cycles and a greater willingness to pay for devices that can create a cinema-like experience at home. This increase in demand is the main driver for a market expected to grow at over 11 percent annually through 2030, changing how audio hardware is marketed and sold.
Restraint:
The Persistent 3D Content Gap
Despite the hardware boom, a limited supply of native spatial audio content remains a barrier to widespread adoption. While blockbuster titles and popular streaming shows are increasingly available in 3D formats, the amount of media still falls short compared to traditional stereo and 5.1 surround sound collections. This "content lag" makes some practical buyers hesitant to invest in costly, specialized hardware when most of their media consumption does not support full 3D playback.
High Costs of Spatial Post-Production
From the creator's standpoint, moving to 3D audio faces challenges due to higher production costs and longer post-processing times. Mastering audio for a three-dimensional environment requires specialized skills and costly software, which slows down the conversion of existing content. This issue delays mainstream adoption and lowers the immediate return for device makers, who must wait for the "content library" to catch up with their technical abilities.
Opportunity:
Automotive and Healthcare Integration
The growth of 3D audio in non-entertainment areas is opening up significant new revenue opportunities for component and software suppliers. Automotive manufacturers are increasingly using spatial sound to improve cockpit awareness, employing directional audio for navigation prompts and safety warnings, and enhancing the in-car media experience. At the same time, healthcare providers are adopting spatial audio in diagnostic training and therapeutic applications, where realistic soundscapes are crucial for patient care and practitioner precision.
Education and Simulation Growth
Education and training platforms are also shifting toward realistic soundscapes to enhance simulation-based learning, which boosts user engagement. These enterprise and industrial sectors are projected to create a multi-billion dollar market by 2030, often growing faster than traditional consumer entertainment. Engaging these sectors early enables providers to secure long-term B2B contracts and move toward more profitable service and licensing models.
Trend:
Spatial Audio in Enterprise Collaboration
In 2026, 3D audio use will rapidly increase in virtual meetings and digital collaboration tools. Businesses are looking for clearer separation of voices during large video conferences to reduce "Zoom fatigue" and enhance communication accuracy among global teams. By incorporating 3D rendering engines that place participants in different acoustic locations, platforms are making virtual interactions feel more natural and significantly improving speech clarity in noisy settings.
Standardizing the Vertical Sound Field
The trend toward supporting "height channels" is spreading across home and commercial audio systems, offering listeners a fuller vertical sound experience. This development is reshaping device design, software development plans, and content production strategies as spatial audio becomes a standard expectation across all digital channels. In communication, entertainment, or enterprise environments, the industry is moving towards a future where audio is inherently three-dimensional.
Recent Developments
Dec 2024 - Splitwise Inc.: Splitwise launched an AI-assisted bill recommendation engine that auto-categorizes and allocates shared expenses for over 30 million registered users, with early tests showing a 25 percent reduction in manual edits. The move strengthens Splitwise’s position as a reference platform for high-frequency personal expense sharing across North America and Europe.
Feb 2025 - PayPal Holdings Inc. (Venmo): Venmo introduced integrated bill-splitting features for restaurant and grocery payments in the United States, linking itemized receipts from partner merchants to more than 85 million active accounts and targeting a 10 percent uplift in transaction volume in 2025. This step deepens Venmo’s role in everyday payments and raises competitive pressure on standalone bill splitting apps.
Apr 2025 - Axio Digital Pvt. Ltd.: Axio rolled out a UPI-linked group expense and pay-later module in India, covering shared rent, utilities, and travel budgets, and reported a 40 percent quarter-on-quarter increase in active bill-splitting users by April 2025. The launch broadens Axio’s reach into young urban consumers and tightens its integration with high-growth digital payment flows.
Jul 2025 - Revolut Ltd.: Revolut expanded its bill-splitting and shared vault features to 25 new markets across Central and Eastern Europe, bringing the capability to an additional 5 million retail customers and supporting multi-currency splits in more than 25 currencies. This expansion consolidates Revolut’s position in cross-border group spending and differentiates its app in travel-intensive segments.
Sep 2025 - Google LLC (Google Pay): Google Pay introduced a unified bill-splitting and group wallet experience across select markets in APAC, integrating loyalty points, P2P transfers, and merchant offers, with pilots covering an estimated 20 percent of its active user base in India and Indonesia. The initiative strengthens Google Pay’s ecosystem strategy and raises entry barriers for smaller bill splitting specialists in mobile-first markets.