Billiards and Snooker Equipment Market Size, Growth | CAGR of 4.1%
Global Billiards and Snooker Equipment Market Size, Share & Sports Goods Analysis By Product Type (Tables, Billiards Tables, Snooker Tables, Pool Tables, Cues, Balls, Accessories), By Material (Wood, Metal, Composite Materials, Others), By Distribution Channel (Offline, Online), Professional League Impact, Material Innovation Trends & Forecast 2025–2034
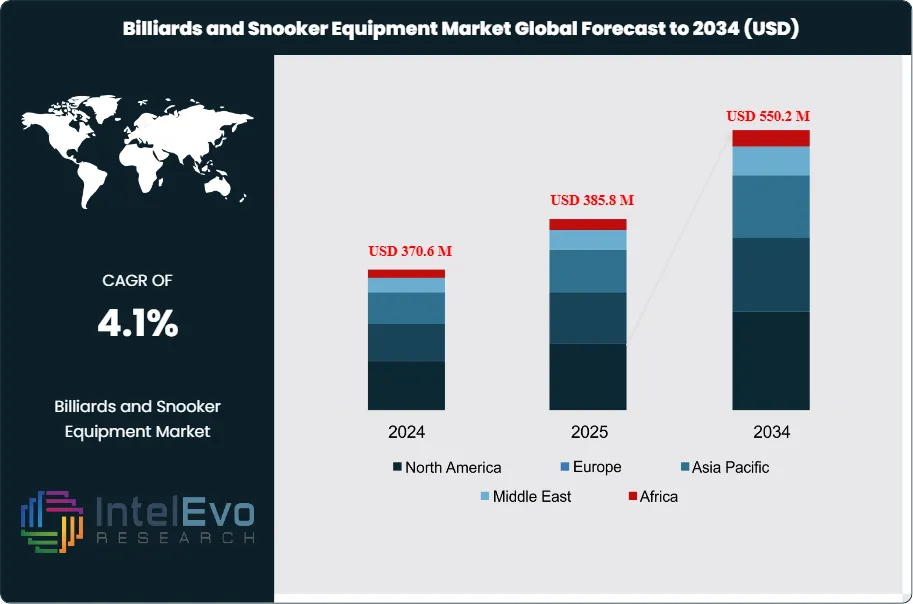
The Billiards and Snooker Equipment Market is estimated at USD 370.6 million in 2024 and is on track to reach roughly USD 550.2 million by 2034, implying a compound annual growth rate (CAGR) of 4.1% over 2025–2034. This steady expansion is supported by the growing popularity of cue sports as recreational and competitive activities, along with increased investments in sports clubs, lounges, and home entertainment setups. Rising interest in professional tournaments, social gaming venues, and premium customized equipment is further enhancing market visibility and long-term demand across both developed and emerging economies.
Market expansion reflects both the enduring appeal of cue sports and the steady diversification of product offerings across professional, recreational, and luxury segments. Historically, the market has grown at a modest pace, supported by strong participation in Europe and Asia, while recent years have seen renewed interest driven by televised tournaments, rising club memberships, and the expansion of organized leagues.
Demand is shaped by a combination of recreational participation and professional competition. In England alone, around 19,300 people actively play snooker, while the World Snooker Federation spans more than 90 member countries, underscoring the sport’s global footprint. Large-scale tournaments such as the BCA Pool League World Championships, which deploys over 500 tables, highlight the scale of equipment demand during competitive events. At the same time, the market benefits from the diversity of billiards formats, with more than 30 recognized game types sustaining a broad consumer base.
Growth drivers include rising consumer spending on leisure activities, the premiumization of sports equipment, and government investment in sports infrastructure. Luxury demand is evident in products such as Bugatti’s £217,000 self-levelling pool table, designed for high-net-worth buyers and superyacht owners. On the supply side, manufacturers face challenges related to raw material costs, adherence to international standards, and the need to balance mass-market affordability with premium product development. Regulatory oversight of sports facilities and equipment specifications also plays a role in shaping competitive dynamics.
Technology is beginning to influence product design and adoption. Digital scorekeeping systems, precision-engineered cues, and advanced table leveling mechanisms are gaining traction, particularly in professional and luxury segments. These innovations enhance performance consistency and appeal to both competitive players and collectors.
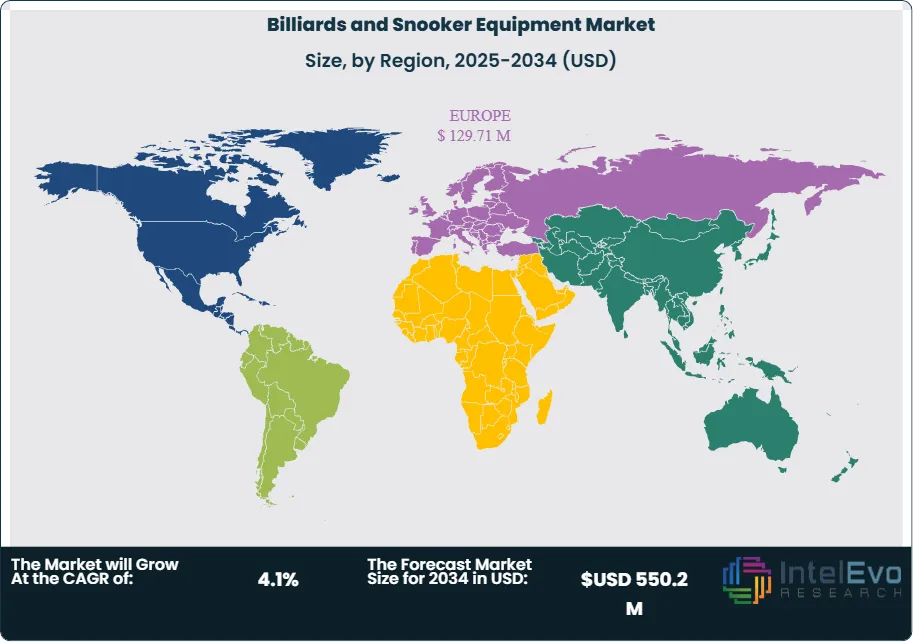
Regionally, Europe remains the largest market, supported by a strong snooker tradition and established clubs. Asia-Pacific is emerging as a key growth hub, with rising participation in China and India creating new opportunities for manufacturers and distributors. North America continues to show steady demand, particularly in pool and recreational billiards. For investors, Asia-Pacific represents the most attractive growth frontier, while Europe and North America remain stable revenue bases.
Overall, the market outlook points to steady expansion, with opportunities concentrated in premium equipment, tournament-driven demand, and emerging participation markets.
Key Takeaways
Market Growth: The global billiards and snooker equipment market was valued at USD 370.6 million in 2024 and is projected to reach USD 550.2 million by 2034, expanding at a CAGR of 4.1%. Growth is supported by rising recreational participation, professional tournaments, and premium product demand.
Product Type: Tables accounted for 63.7% of total revenue in 2024, reflecting their indispensable role in both professional and recreational play. High replacement costs and standardized specifications reinforce their dominance in overall market value.
Material: Wood held 58.2% of the material segment in 2024, driven by its durability, performance consistency, and traditional preference among players. Engineered wood and composite alternatives are gaining traction but remain secondary.
Distribution Channel: Offline retail captured 72.1% of sales in 2024, as customers continue to prefer in-store product evaluation for high-value items such as tables and cues. Online channels are expanding but remain under 30% of total sales.
Driver: Global participation in cue sports is expanding, with the World Snooker Federation representing over 90 countries. Large-scale tournaments such as the BCA Pool League World Championships, featuring 500 tables, create recurring demand for professional-grade equipment.
Restraint: High product costs, particularly for premium tables priced above USD 5,000, limit adoption in price-sensitive markets. Fluctuations in raw material prices, especially hardwood, further constrain manufacturer margins.
Opportunity: Asia-Pacific presents the strongest growth potential, with rising participation in China and India expected to drive double-digit demand growth. Expanding middle-class spending on leisure activities positions the region as a key investment hotspot.
Trend: Luxury and technology-driven products are gaining visibility. Examples include Bugatti’s £217,000 self-levelling pool table, which targets ultra-premium buyers, and digital scorekeeping systems that enhance professional play.
Regional Analysis: Europe remains the largest market, supported by a strong snooker tradition and established clubs. North America maintains a stable base with consistent recreational demand. Asia-Pacific is the fastest-growing region, projected to outpace global CAGR due to expanding player communities and rising disposable incomes.
Product Type Analysis
Tables remain the dominant product category, accounting for 63.7% of global revenues in 2024, and are expected to maintain their lead through 2034. Their central role in gameplay ensures consistent demand across professional tournaments, sports clubs, and private households. Variants such as billiards, snooker, and pool tables cater to different game formats, with professional-grade models commanding premium pricing. Table quality, including surface precision and durability, directly influences player performance, making this segment critical for both recreational and competitive markets.
Cues represent the second-largest category, with steady demand driven by customization in weight, balance, and material composition. Professional players increasingly prefer high-performance cues crafted from advanced composites or hybrid materials, while casual players continue to rely on traditional wooden cues. Balls, though uniform in design, remain indispensable, with sets tailored to specific formats such as snooker or pool. Accessories, including racks, chalk, and protective covers, contribute a smaller share but play a vital role in equipment upkeep and game integrity.
Material Analysis
Wood continues to dominate the material segment, holding 58.2% of the market in 2024, supported by its durability, workability, and traditional association with cue sports. Premium hardwoods such as maple and ash remain the preferred choice for tables and cues, reinforcing the sport’s heritage appeal. This dominance is expected to persist, although rising costs of quality timber may encourage gradual adoption of alternatives.
Metal is primarily used in structural frames and reinforcement components, valued for its strength and stability in high-end tables. Composite materials are gaining traction, particularly in outdoor models and performance cues, due to their resistance to warping and environmental wear. Other materials, including synthetic fabrics for table covers and rubber cushions for rails, are essential for maintaining international gameplay standards and ensuring consistent performance across venues.
Distribution Channel Analysis
Offline retail accounted for 72.1% of global sales in 2024 and remains the preferred channel for high-value purchases such as tables and professional cues. Specialty sports stores, clubs, and direct dealer networks dominate this segment, as customers prioritize physical inspection before committing to large investments. The tactile nature of cues and the visual appeal of tables reinforce the importance of in-person evaluation.
Online channels, while smaller in share, are expanding steadily, particularly in regions with limited access to specialty stores. E-commerce platforms offer broader product ranges and competitive pricing, attracting younger consumers and casual players. However, the offline channel is expected to retain its lead through 2034, given the high replacement costs and the importance of product assurance in premium categories.
By Region
North America remains the largest regional market, supported by a strong cultural affinity for cue sports, high disposable incomes, and the presence of professional leagues. The United States and Canada host major tournaments that drive recurring demand for professional-grade equipment. Continued investment in cue sports infrastructure and the rising popularity of luxury tables are expected to sustain regional growth.
Europe holds a significant share, anchored by the United Kingdom’s long-standing snooker tradition and a dense network of clubs and venues. The region benefits from a loyal fan base and consistent tournament activity, ensuring stable equipment demand. Asia Pacific, however, represents the fastest-growing market, with China and India driving participation growth. Rising middle-class spending and expanding club networks are expected to push the region’s CAGR above the global average.
Latin America and the Middle East & Africa remain smaller but emerging markets. Latin America is witnessing gradual adoption through leisure clubs and sports diversification, while the Middle East is seeing demand from luxury hotels and resorts incorporating cue sports into recreational offerings. Both regions present long-term opportunities as participation broadens and consumer spending on leisure activities increases.
By Product Type (Tables, Billiards Tables, Snooker Tables, Pool Tables, Cues, Balls, Accessories), By Material (Wood, Metal, Composite Materials, Others), By Distribution Channel (Offline, Online)
Research Methodology
Primary Research- 100 Interviews of Stakeholders
Secondary Research
Desk Research
Regional scope
North America (United States, Canada, Mexico)
Latin America (Brazil, Argentina, Columbia)
East Asia And Pacific (China, Japan, South Korea, Australia, Cambodia, Fiji, Indonesia)
Sea And South Asia (India, Singapore, Thailand, Taiwan, Malaysia)
Eastern Europe (Poland, Russia, Czech Republic, Romania)
Western Europe (Germany, U.K., France, Spain, Itlay)
Middle East & Africa (GCC Countries, Egypt, Nigeria, South Africa, Israel)
Customization for segments, region/country-level will be provided. Moreover, additional customization can be done based on the requirements.
Pricing and Purchase Options
Avail customized purchase options to meet your exact research needs. We have three licenses to opt for: Single User License, Multi-User License (Up to 5 Users), Corporate Use License (Unlimited User and Printable PDF).
TABLE OF CONTENTS
1. EXECUTIVE SUMMARY
1.1. MARKET SNAPSHOT
1.2. KEY FINDINGS & INSIGHTS
1.3. ANALYST RECOMMENDATIONS
1.4. FUTURE OUTLOOK
2. RESEARCH METHODOLOGY
2.1. MARKET DEFINITION & SCOPE
2.2. RESEARCH OBJECTIVES: PRIMARY & SECONDARY DATA SOURCES
2.3. DATA COLLECTION SOURCES
2.3.1. COVERAGE OF 100+ PRIMARY RESEARCH/CONSULTATION CALLS WITH INDUSTRY STAKEHOLDERS
FIGURE 17 NORTH AMERICA BILLIARDS AND SNOOKER EQUIPMENT CURRENT AND FUTURE TYPE ANALYSIS, 2025–2034, (USD MILLION)
FIGURE 18 NORTH AMERICA BILLIARDS AND SNOOKER EQUIPMENT CURRENT AND FUTURE END USER ANALYSIS, 2025–2034, (USD MILLION)
FIGURE 19 MARKET SHARE BY COUNTRY
FIGURE 20 LATIN AMERICA BILLIARDS AND SNOOKER EQUIPMENT CURRENT AND FUTURE TYPE ANALYSIS, 2025–2034, (USD MILLION)
FIGURE 21 LATIN AMERICA BILLIARDS AND SNOOKER EQUIPMENT CURRENT AND FUTURE END USER ANALYSIS, 2025–2034, (USD MILLION)
FIGURE 22 MARKET SHARE BY COUNTRY
FIGURE 23 EASTERN EUROPE BILLIARDS AND SNOOKER EQUIPMENT CURRENT AND FUTURE TYPE ANALYSIS, 2025–2034, (USD MILLION)
FIGURE 24 EASTERN EUROPE BILLIARDS AND SNOOKER EQUIPMENT CURRENT AND FUTURE END USER ANALYSIS, 2025–2034, (USD MILLION)
FIGURE 25 MARKET SHARE BY COUNTRY
FIGURE 26 WESTERN EUROPE BILLIARDS AND SNOOKER EQUIPMENT CURRENT AND FUTURE TYPE ANALYSIS, 2025–2034, (USD MILLION)
FIGURE 27 WESTERN EUROPE BILLIARDS AND SNOOKER EQUIPMENT CURRENT AND FUTURE END USER ANALYSIS, 2025–2034, (USD MILLION)
FIGURE 28 MARKET SHARE BY COUNTRY
FIGURE 29 EAST ASIA AND PACIFIC BILLIARDS AND SNOOKER EQUIPMENT CURRENT AND FUTURE TYPE ANALYSIS, 2025–2034, (USD MILLION)
FIGURE 30 EAST ASIA AND PACIFIC BILLIARDS AND SNOOKER EQUIPMENT CURRENT AND FUTURE END USER ANALYSIS, 2025–2034, (USD MILLION)
FIGURE 31 MARKET SHARE BY COUNTRY
FIGURE 32 SEA AND SOUTH ASIA BILLIARDS AND SNOOKER EQUIPMENT CURRENT AND FUTURE TYPE ANALYSIS, 2025–2034, (USD MILLION)
FIGURE 33 SEA AND SOUTH ASIA BILLIARDS AND SNOOKER EQUIPMENT CURRENT AND FUTURE END USER ANALYSIS, 2025–2034, (USD MILLION)
FIGURE 34 MARKET SHARE BY COUNTRY
FIGURE 35 MIDDLE EAST AND AFRICA BILLIARDS AND SNOOKER EQUIPMENT CURRENT AND FUTURE TYPE ANALYSIS, 2025–2034, (USD MILLION)
FIGURE 36 MIDDLE EAST AND AFRICA BILLIARDS AND SNOOKER EQUIPMENT CURRENT AND FUTURE END USER ANALYSIS, 2025–2034, (USD MILLION)
FIGURE 37 NORTH AMERICA BILLIARDS AND SNOOKER EQUIPMENT CURRENT AND FUTURE MARKET VOLUME SHARE REGIONAL ANALYSIS, 2025–2034, (USD MILLION)
FIGURE 38 U.S. BILLIARDS AND SNOOKER EQUIPMENT CURRENT AND FUTURE TYPE ANALYSIS, 2025–2034, (USD MILLION)
FIGURE 39 U.S. BILLIARDS AND SNOOKER EQUIPMENT CURRENT AND FUTURE END USER ANALYSIS, 2025–2034, (USD MILLION)
FIGURE 40 CANADA BILLIARDS AND SNOOKER EQUIPMENT CURRENT AND FUTURE TYPE ANALYSIS, 2025–2034, (USD MILLION)
FIGURE 41 CANADA BILLIARDS AND SNOOKER EQUIPMENT CURRENT AND FUTURE END USER ANALYSIS, 2025–2034, (USD MILLION)
FIGURE 42 LATIN AMERICA BILLIARDS AND SNOOKER EQUIPMENT CURRENT AND FUTURE MARKET VOLUME SHARE REGIONAL ANALYSIS, 2025–2034, (USD MILLION)
FIGURE 43 MEXICO BILLIARDS AND SNOOKER EQUIPMENT CURRENT AND FUTURE TYPE ANALYSIS, 2025–2034, (USD MILLION)
FIGURE 44 MEXICO BILLIARDS AND SNOOKER EQUIPMENT CURRENT AND FUTURE END USER ANALYSIS, 2025–2034, (USD MILLION)
FIGURE 45 BRAZIL BILLIARDS AND SNOOKER EQUIPMENT CURRENT AND FUTURE TYPE ANALYSIS, 2025–2034, (USD MILLION)
FIGURE 46 BRAZIL BILLIARDS AND SNOOKER EQUIPMENT CURRENT AND FUTURE END USER ANALYSIS, 2025–2034, (USD MILLION)
FIGURE 47 ARGENTINA BILLIARDS AND SNOOKER EQUIPMENT CURRENT AND FUTURE TYPE ANALYSIS, 2025–2034, (USD MILLION)
FIGURE 48 ARGENTINA BILLIARDS AND SNOOKER EQUIPMENT CURRENT AND FUTURE END USER ANALYSIS, 2025–2034, (USD MILLION)
FIGURE 49 COLUMBIA BILLIARDS AND SNOOKER EQUIPMENT CURRENT AND FUTURE TYPE ANALYSIS, 2025–2034, (USD MILLION)
FIGURE 50 COLUMBIA BILLIARDS AND SNOOKER EQUIPMENT CURRENT AND FUTURE END USER ANALYSIS, 2025–2034, (USD MILLION)
FIGURE 51 REST OF LATIN AMERICA BILLIARDS AND SNOOKER EQUIPMENT CURRENT AND FUTURE TYPE ANALYSIS, 2025–2034, (USD MILLION)
FIGURE 52 REST OF LATIN AMERICA BILLIARDS AND SNOOKER EQUIPMENT CURRENT AND FUTURE END USER ANALYSIS, 2025–2034, (USD MILLION)
FIGURE 53 EASTERN EUROPE BILLIARDS AND SNOOKER EQUIPMENT CURRENT AND FUTURE MARKET VOLUME SHARE REGIONAL ANALYSIS, 2025–2034, (USD MILLION)
FIGURE 54 POLAND BILLIARDS AND SNOOKER EQUIPMENT CURRENT AND FUTURE TYPE ANALYSIS, 2025–2034, (USD MILLION)
FIGURE 55 POLAND BILLIARDS AND SNOOKER EQUIPMENT CURRENT AND FUTURE END USER ANALYSIS, 2025–2034, (USD MILLION)
FIGURE 56 RUSSIA BILLIARDS AND SNOOKER EQUIPMENT CURRENT AND FUTURE TYPE ANALYSIS, 2025–2034, (USD MILLION)
FIGURE 57 RUSSIA BILLIARDS AND SNOOKER EQUIPMENT CURRENT AND FUTURE END USER ANALYSIS, 2025–2034, (USD MILLION)
FIGURE 58 CZECH REPUBLIC BILLIARDS AND SNOOKER EQUIPMENT CURRENT AND FUTURE TYPE ANALYSIS, 2025–2034, (USD MILLION)
FIGURE 59 CZECH REPUBLIC BILLIARDS AND SNOOKER EQUIPMENT CURRENT AND FUTURE END USER ANALYSIS, 2025–2034, (USD MILLION)
FIGURE 60 ROMANIA BILLIARDS AND SNOOKER EQUIPMENT CURRENT AND FUTURE TYPE ANALYSIS, 2025–2034, (USD MILLION)
FIGURE 61 ROMANIA BILLIARDS AND SNOOKER EQUIPMENT CURRENT AND FUTURE END USER ANALYSIS, 2025–2034, (USD MILLION)
FIGURE 62 REST OF EASTERN EUROPE BILLIARDS AND SNOOKER EQUIPMENT CURRENT AND FUTURE TYPE ANALYSIS, 2025–2034, (USD MILLION)
FIGURE 63 REST OF EASTERN EUROPE BILLIARDS AND SNOOKER EQUIPMENT CURRENT AND FUTURE END USER ANALYSIS, 2025–2034, (USD MILLION)
FIGURE 64 WESTERN EUROPE BILLIARDS AND SNOOKER EQUIPMENT CURRENT AND FUTURE MARKET VOLUME SHARE REGIONAL ANALYSIS, 2025–2034, (USD MILLION)
FIGURE 65 GERMANY BILLIARDS AND SNOOKER EQUIPMENT CURRENT AND FUTURE TYPE ANALYSIS, 2025–2034, (USD MILLION)
FIGURE 66 GERMANY BILLIARDS AND SNOOKER EQUIPMENT CURRENT AND FUTURE END USER ANALYSIS, 2025–2034, (USD MILLION)
FIGURE 67 FRANCE BILLIARDS AND SNOOKER EQUIPMENT CURRENT AND FUTURE TYPE ANALYSIS, 2025–2034, (USD MILLION)
FIGURE 68 FRANCE BILLIARDS AND SNOOKER EQUIPMENT CURRENT AND FUTURE END USER ANALYSIS, 2025–2034, (USD MILLION)
FIGURE 69 UK BILLIARDS AND SNOOKER EQUIPMENT CURRENT AND FUTURE TYPE ANALYSIS, 2025–2034, (USD MILLION)
FIGURE 70 UK BILLIARDS AND SNOOKER EQUIPMENT CURRENT AND FUTURE END USER ANALYSIS, 2025–2034, (USD MILLION)
FIGURE 71 SPAIN BILLIARDS AND SNOOKER EQUIPMENT CURRENT AND FUTURE TYPE ANALYSIS, 2025–2034, (USD MILLION)
FIGURE 72 SPAIN BILLIARDS AND SNOOKER EQUIPMENT CURRENT AND FUTURE END USER ANALYSIS, 2025–2034, (USD MILLION)
FIGURE 73 ITALY BILLIARDS AND SNOOKER EQUIPMENT CURRENT AND FUTURE TYPE ANALYSIS, 2025–2034, (USD MILLION)
FIGURE 74 ITALY BILLIARDS AND SNOOKER EQUIPMENT CURRENT AND FUTURE END USER ANALYSIS, 2025–2034, (USD MILLION)
FIGURE 75 REST OF WESTERN EUROPE BILLIARDS AND SNOOKER EQUIPMENT CURRENT AND FUTURE TYPE ANALYSIS, 2025–2034, (USD MILLION)
FIGURE 76 REST OF WESTERN EUROPE BILLIARDS AND SNOOKER EQUIPMENT CURRENT AND FUTURE END USER ANALYSIS, 2025–2034, (USD MILLION)
FIGURE 77 EAST ASIA AND PACIFIC BILLIARDS AND SNOOKER EQUIPMENT CURRENT AND FUTURE MARKET VOLUME SHARE REGIONAL ANALYSIS, 2025–2034, (USD MILLION)
FIGURE 78 CHINA BILLIARDS AND SNOOKER EQUIPMENT CURRENT AND FUTURE TYPE ANALYSIS, 2025–2034, (USD MILLION)
FIGURE 79 CHINA BILLIARDS AND SNOOKER EQUIPMENT CURRENT AND FUTURE END USER ANALYSIS, 2025–2034, (USD MILLION)
FIGURE 80 JAPAN BILLIARDS AND SNOOKER EQUIPMENT CURRENT AND FUTURE TYPE ANALYSIS, 2025–2034, (USD MILLION)
FIGURE 81 JAPAN BILLIARDS AND SNOOKER EQUIPMENT CURRENT AND FUTURE END USER ANALYSIS, 2025–2034, (USD MILLION)
FIGURE 82 AUSTRALIA BILLIARDS AND SNOOKER EQUIPMENT CURRENT AND FUTURE TYPE ANALYSIS, 2025–2034, (USD MILLION)
FIGURE 83 AUSTRALIA BILLIARDS AND SNOOKER EQUIPMENT CURRENT AND FUTURE END USER ANALYSIS, 2025–2034, (USD MILLION)
FIGURE 84 CAMBODIA BILLIARDS AND SNOOKER EQUIPMENT CURRENT AND FUTURE TYPE ANALYSIS, 2025–2034, (USD MILLION)
FIGURE 85 CAMBODIA BILLIARDS AND SNOOKER EQUIPMENT CURRENT AND FUTURE END USER ANALYSIS, 2025–2034, (USD MILLION)
FIGURE 86 FIJI BILLIARDS AND SNOOKER EQUIPMENT CURRENT AND FUTURE TYPE ANALYSIS, 2025–2034, (USD MILLION)
FIGURE 87 FIJI BILLIARDS AND SNOOKER EQUIPMENT CURRENT AND FUTURE END USER ANALYSIS, 2025–2034, (USD MILLION)
FIGURE 88 INDONESIA BILLIARDS AND SNOOKER EQUIPMENT CURRENT AND FUTURE TYPE ANALYSIS, 2025–2034, (USD MILLION)
FIGURE 89 INDONESIA BILLIARDS AND SNOOKER EQUIPMENT CURRENT AND FUTURE END USER ANALYSIS, 2025–2034, (USD MILLION)
FIGURE 90 SOUTH KOREA BILLIARDS AND SNOOKER EQUIPMENT CURRENT AND FUTURE TYPE ANALYSIS, 2025–2034, (USD MILLION)
FIGURE 91 SOUTH KOREA BILLIARDS AND SNOOKER EQUIPMENT CURRENT AND FUTURE END USER ANALYSIS, 2025–2034, (USD MILLION)
FIGURE 92 REST OF EAST ASIA AND PACIFIC BILLIARDS AND SNOOKER EQUIPMENT CURRENT AND FUTURE TYPE ANALYSIS, 2025–2034, (USD MILLION)
FIGURE 93 REST OF EAST ASIA AND PACIFIC BILLIARDS AND SNOOKER EQUIPMENT CURRENT AND FUTURE END USER ANALYSIS, 2025–2034, (USD MILLION)
FIGURE 94 SEA AND SOUTH ASIA BILLIARDS AND SNOOKER EQUIPMENT CURRENT AND FUTURE MARKET VOLUME SHARE REGIONAL ANALYSIS, 2025–2034, (USD MILLION)
FIGURE 95 BANGLADESH BILLIARDS AND SNOOKER EQUIPMENT CURRENT AND FUTURE TYPE ANALYSIS, 2025–2034, (USD MILLION)
FIGURE 96 BANGLADESH BILLIARDS AND SNOOKER EQUIPMENT CURRENT AND FUTURE END USER ANALYSIS, 2025–2034, (USD MILLION)
FIGURE 97 NEW ZEALAND BILLIARDS AND SNOOKER EQUIPMENT CURRENT AND FUTURE TYPE ANALYSIS, 2025–2034, (USD MILLION)
FIGURE 98 NEW ZEALAND BILLIARDS AND SNOOKER EQUIPMENT CURRENT AND FUTURE END USER ANALYSIS, 2025–2034, (USD MILLION)
FIGURE 99 INDIA BILLIARDS AND SNOOKER EQUIPMENT CURRENT AND FUTURE TYPE ANALYSIS, 2025–2034, (USD MILLION)
FIGURE 100 INDIA BILLIARDS AND SNOOKER EQUIPMENT CURRENT AND FUTURE END USER ANALYSIS, 2025–2034, (USD MILLION)
FIGURE 101 SINGAPORE BILLIARDS AND SNOOKER EQUIPMENT CURRENT AND FUTURE TYPE ANALYSIS, 2025–2034, (USD MILLION)
FIGURE 102 SINGAPORE BILLIARDS AND SNOOKER EQUIPMENT CURRENT AND FUTURE END USER ANALYSIS, 2025–2034, (USD MILLION)
FIGURE 103 THAILAND BILLIARDS AND SNOOKER EQUIPMENT CURRENT AND FUTURE TYPE ANALYSIS, 2025–2034, (USD MILLION)
FIGURE 104 THAILAND BILLIARDS AND SNOOKER EQUIPMENT CURRENT AND FUTURE END USER ANALYSIS, 2025–2034, (USD MILLION)
FIGURE 105 TAIWAN BILLIARDS AND SNOOKER EQUIPMENT CURRENT AND FUTURE TYPE ANALYSIS, 2025–2034, (USD MILLION)
FIGURE 106 TAIWAN BILLIARDS AND SNOOKER EQUIPMENT CURRENT AND FUTURE END USER ANALYSIS, 2025–2034, (USD MILLION)
FIGURE 107 MALAYSIA BILLIARDS AND SNOOKER EQUIPMENT CURRENT AND FUTURE TYPE ANALYSIS, 2025–2034, (USD MILLION)
FIGURE 108 MALAYSIA BILLIARDS AND SNOOKER EQUIPMENT CURRENT AND FUTURE END USER ANALYSIS, 2025–2034, (USD MILLION)
FIGURE 109 REST OF SEA AND SOUTH ASIA BILLIARDS AND SNOOKER EQUIPMENT CURRENT AND FUTURE TYPE ANALYSIS, 2025–2034, (USD MILLION)
FIGURE 110 REST OF SEA AND SOUTH ASIA BILLIARDS AND SNOOKER EQUIPMENT CURRENT AND FUTURE END USER ANALYSIS, 2025–2034, (USD MILLION)
FIGURE 111 MIDDLE EAST AND AFRICA BILLIARDS AND SNOOKER EQUIPMENT CURRENT AND FUTURE MARKET VOLUME SHARE REGIONAL ANALYSIS, 2025–2034, (USD MILLION)
FIGURE 112 GCC COUNTRIES BILLIARDS AND SNOOKER EQUIPMENT CURRENT AND FUTURE TYPE ANALYSIS, 2025–2034, (USD MILLION)
FIGURE 113 GCC COUNTRIES BILLIARDS AND SNOOKER EQUIPMENT CURRENT AND FUTURE END USER ANALYSIS, 2025–2034, (USD MILLION)
FIGURE 114 SAUDI ARABIA BILLIARDS AND SNOOKER EQUIPMENT CURRENT AND FUTURE TYPE ANALYSIS, 2025–2034, (USD MILLION)
FIGURE 115 SAUDI ARABIA BILLIARDS AND SNOOKER EQUIPMENT CURRENT AND FUTURE END USER ANALYSIS, 2025–2034, (USD MILLION)
FIGURE 116 UAE BILLIARDS AND SNOOKER EQUIPMENT CURRENT AND FUTURE TYPE ANALYSIS, 2025–2034, (USD MILLION)
FIGURE 117 UAE BILLIARDS AND SNOOKER EQUIPMENT CURRENT AND FUTURE END USER ANALYSIS, 2025–2034, (USD MILLION)
FIGURE 118 BAHRAIN BILLIARDS AND SNOOKER EQUIPMENT CURRENT AND FUTURE TYPE ANALYSIS, 2025–2034, (USD MILLION)
FIGURE 119 BAHRAIN BILLIARDS AND SNOOKER EQUIPMENT CURRENT AND FUTURE END USER ANALYSIS, 2025–2034, (USD MILLION)
FIGURE 120 KUWAIT BILLIARDS AND SNOOKER EQUIPMENT CURRENT AND FUTURE TYPE ANALYSIS, 2025–2034, (USD MILLION)
FIGURE 121 KUWAIT BILLIARDS AND SNOOKER EQUIPMENT CURRENT AND FUTURE END USER ANALYSIS, 2025–2034, (USD MILLION)
FIGURE 122 OMAN BILLIARDS AND SNOOKER EQUIPMENT CURRENT AND FUTURE TYPE ANALYSIS, 2025–2034, (USD MILLION)
FIGURE 123 OMAN BILLIARDS AND SNOOKER EQUIPMENT CURRENT AND FUTURE END USER ANALYSIS, 2025–2034, (USD MILLION)
FIGURE 124 QATAR BILLIARDS AND SNOOKER EQUIPMENT CURRENT AND FUTURE TYPE ANALYSIS, 2025–2034, (USD MILLION)
FIGURE 125 QATAR BILLIARDS AND SNOOKER EQUIPMENT CURRENT AND FUTURE END USER ANALYSIS, 2025–2034, (USD MILLION)
FIGURE 126 EGYPT BILLIARDS AND SNOOKER EQUIPMENT CURRENT AND FUTURE TYPE ANALYSIS, 2025–2034, (USD MILLION)
FIGURE 127 EGYPT BILLIARDS AND SNOOKER EQUIPMENT CURRENT AND FUTURE END USER ANALYSIS, 2025–2034, (USD MILLION)
FIGURE 128 NIGERIA BILLIARDS AND SNOOKER EQUIPMENT CURRENT AND FUTURE TYPE ANALYSIS, 2025–2034, (USD MILLION)
FIGURE 129 NIGERIA BILLIARDS AND SNOOKER EQUIPMENT CURRENT AND FUTURE END USER ANALYSIS, 2025–2034, (USD MILLION)
FIGURE 130 SOUTH AFRICA BILLIARDS AND SNOOKER EQUIPMENT CURRENT AND FUTURE TYPE ANALYSIS, 2025–2034, (USD MILLION)
FIGURE 131 SOUTH AFRICA BILLIARDS AND SNOOKER EQUIPMENT CURRENT AND FUTURE END USER ANALYSIS, 2025–2034, (USD MILLION)
FIGURE 132 ISRAEL BILLIARDS AND SNOOKER EQUIPMENT CURRENT AND FUTURE TYPE ANALYSIS, 2025–2034, (USD MILLION)
FIGURE 133 ISRAEL BILLIARDS AND SNOOKER EQUIPMENT CURRENT AND FUTURE END USER ANALYSIS, 2025–2034, (USD MILLION)
FIGURE 134 REST OF MEA BILLIARDS AND SNOOKER EQUIPMENT CURRENT AND FUTURE TYPE ANALYSIS, 2025–2034, (USD MILLION)
FIGURE 135 REST OF MEA BILLIARDS AND SNOOKER EQUIPMENT CURRENT AND FUTURE END USER ANALYSIS, 2025–2034, (USD MILLION)
FIGURE 136 U. S. MARKET SHARE ANALYSIS BY TYPE (2024)
FIGURE 137 U. S. MARKET SHARE ANALYSIS BY END USER (2024)
FIGURE 138 CANADA MARKET SHARE ANALYSIS BY TYPE (2024)
FIGURE 139 CANADA MARKET SHARE ANALYSIS BY END USER (2024)
FIGURE 140 MEXICO MARKET SHARE ANALYSIS BY TYPE (2024)
FIGURE 141 MEXICO MARKET SHARE ANALYSIS BY END USER (2024)
FIGURE 142 CHINA MARKET SHARE ANALYSIS BY TYPE (2024)
FIGURE 143 CHINA MARKET SHARE ANALYSIS BY END USER (2024)
FIGURE 144 JAPAN MARKET SHARE ANALYSIS BY TYPE (2024)
FIGURE 145 JAPAN MARKET SHARE ANALYSIS BY END USER (2024)
FIGURE 146 INDIA MARKET SHARE ANALYSIS BY TYPE (2024)
FIGURE 147 INDIA MARKET SHARE ANALYSIS BY END USER (2024)
FIGURE 148 SOUTH KOREA MARKET SHARE ANALYSIS BY TYPE (2024)
FIGURE 149 SOUTH KOREA MARKET SHARE ANALYSIS BY END USER (2024)
FIGURE 150 SAUDI ARABIA MARKET SHARE ANALYSIS BY TYPE (2024)
FIGURE 151 SAUDI ARABIA MARKET SHARE ANALYSIS BY END USER (2024)
FIGURE 152 UAE MARKET SHARE ANALYSIS BY TYPE (2024)
FIGURE 153 UAE MARKET SHARE ANALYSIS BY END USER (2024)
FIGURE 154 EGYPT MARKET SHARE ANALYSIS BY TYPE (2024)
FIGURE 155 EGYPT MARKET SHARE ANALYSIS BY END USER (2024)
FIGURE 156 NIGERIA MARKET SHARE ANALYSIS BY TYPE (2024)
FIGURE 157 NIGERIA MARKET SHARE ANALYSIS BY END USER (2024)
FIGURE 158 SOUTH AFRICA MARKET SHARE ANALYSIS BY TYPE (2024)
FIGURE 159 SOUTH AFRICA MARKET SHARE ANALYSIS BY END USER (2024)
FIGURE 160 GERMANY MARKET SHARE ANALYSIS BY TYPE (2024)
FIGURE 161 GERMANY MARKET SHARE ANALYSIS BY END USER (2024)
FIGURE 162 FRANCE MARKET SHARE ANALYSIS BY TYPE (2024)
FIGURE 163 FRANCE MARKET SHARE ANALYSIS BY END USER (2024)
FIGURE 164 UK MARKET SHARE ANALYSIS BY TYPE (2024)
FIGURE 165 UK MARKET SHARE ANALYSIS BY END USER (2024)
FIGURE 166 SPAIN MARKET SHARE ANALYSIS BY TYPE (2024)
FIGURE 167 SPAIN MARKET SHARE ANALYSIS BY END USER (2024)
FIGURE 168 ITALY MARKET SHARE ANALYSIS BY TYPE (2024)
FIGURE 169 ITALY MARKET SHARE ANALYSIS BY END USER (2024)
FIGURE 170 BRAZIL MARKET SHARE ANALYSIS BY TYPE (2024)
FIGURE 171 BRAZIL MARKET SHARE ANALYSIS BY END USER (2024)
FIGURE 172 ARGENTINA MARKET SHARE ANALYSIS BY TYPE (2024)
FIGURE 173 ARGENTINA MARKET SHARE ANALYSIS BY END USER (2024)
FIGURE 174 COLUMBIA MARKET SHARE ANALYSIS BY TYPE (2024)
FIGURE 175 COLUMBIA MARKET SHARE ANALYSIS BY END USER (2024)
FIGURE 176 GLOBAL BILLIARDS AND SNOOKER EQUIPMENT CURRENT AND FUTURE MARKET KEY COUNTRY LEVEL ANALYSIS, 2024–2034, (USD MILLION)
FIGURE 177 FINANCIAL OVERVIEW:
Key Player Analysis
Riley England: Riley England positions as a leader in premium snooker and pool tables with strong heritage in the UK and Europe. The company focuses on professional-grade snooker tables, tournament-spec cloth, and accessories aimed at clubs and elite players. In 2025, Riley is expanding export distribution in Asia and the Middle East, supported by dealer network consolidation and standardized installation services. It invests in precision engineering for slate bed tables, CNC machining for frame alignment, and sustainability initiatives using responsibly sourced hardwoods. Its differentiators include brand recognition in professional circuits, consistent compliance with World Snooker Federation specifications, and a robust after-sales program that improves lifetime value. You will see Riley’s strength in the club segment, where multi-table installations and maintenance contracts drive recurring revenue.
Peradon & Fletcher Ltd.: Peradon & Fletcher is a leader in cues and shafts, known for craftsmanship and consistency across mid to premium tiers. The portfolio spans ash and maple cues, extensions, cases, and accessories, serving both professionals and advanced amateurs. In 2025, Peradon is scaling customization, offering weight and balance tuning, tip selection, and engraved finishes through a streamlined online-to-shop workflow. The company’s initiatives include material diversification into hybrid and carbon composite shafts, tighter QC using digital tolerances, and partnerships with coaches for player fitting programs. Differentiation rests on performance consistency, deep brand loyalty among UK players, and reliable lead times. With cues accounting for a growing share of replacement demand, Peradon’s focus on personalized fit supports higher margins and repeat purchases.
Olhausen Billiard Manufacturing, Inc.: Olhausen positions as a leader in residential and premium home entertainment tables across North America. The company offers pool tables, shuffleboard, and furniture-grade accessories targeted at high-income households and specialty retailers. In 2025, Olhausen is advancing mass customization at scale, using configurable finishes, rail styles, and cushion systems, supported by digital sales tools and dealer installation standards. Strategic priorities include expanding U.S. manufacturing capacity, improving warranty performance, and promoting environmentally responsible materials. Its differentiators are American-made production, broad dealer coverage, and strong brand visibility in the home segment. With the market growing at a low single-digit CAGR, Olhausen benefits from stable replacement cycles and multi-product bundling in home game rooms.
Valley-Dynamo, Inc: Valley-Dynamo is a challenger in commercial and coin-operated tables, supplying bars, leagues, and amusement venues across the United States and select international markets. The portfolio includes coin-op pool tables, league-ready equipment, cues, and accessories designed for high-traffic settings. In 2025, Valley-Dynamo is prioritizing durability and operational efficiency, integrating cashless payment options, modular components for rapid maintenance, and standardized parts to reduce downtime. League partnerships and venue programs strengthen repeat sales and parts revenue. Differentiation stems from rugged build quality, strong presence in bar and coin-op channels, and predictable service models. As organized leagues expand and hospitality venues refresh equipment, you can expect Valley-Dynamo to capture steady growth in the commercial replacement cycle and ancillary parts sales.
Market Key Players
Predator Group
Olhausen Billiard Manufacturing, Inc.
Simonis Cloth
McDermott Cue Manufacturing LLC
Riley England
Brunswick Corporation
Aramith (Saluc S.A.)
Pechauer Custom Cues
Valley-Dynamo, Inc.
Peradon & Fletcher Ltd.
Diamond Billiard Products Inc.
Fury Cues
Balabushka Cue Company
Driver:
Rising Professional Visibility and Tournament-Led Demand
As of 2025, the global billiards and snooker equipment market is growing, driven by more people participating in both recreational and professional formats. The World Snooker Federation now represents over 90 member countries. Major tournaments like the World Snooker Championship and the BCA Pool League World Championships create ongoing demand for professional-grade tables, cues, and accessories. Increased broadcast coverage and larger prize pools enhance the appeal, especially in Asia and Europe, where cue sports have strong cultural support.
Grassroots Participation and Youth Engagement
Growth is also speeding up at the grassroots level. Schools, academies, and local clubs, especially in China, India, and Southeast Asia, are introducing cue sports programs. These efforts are increasing the number of young players and boosting sales of entry-level and mid-range equipment. This mix of high-level visibility and amateur participation supports ongoing demand for new equipment and provides a stable long-term growth outlook for manufacturers and distributors.
Restraint:
Limited Penetration in Non-Traditional Markets
Despite steady growth, market expansion is limited in areas where cue sports do not have mainstream recognition. Parts of Africa and Latin America show low participation rates because of limited infrastructure, fewer organized leagues, and minimal media coverage. In these regions, the lack of dedicated venues hampers player development and directly affects equipment sales.
Counterfeits, Seasonality, and Venue Constraints
Seasonal demand changes also put pressure on revenues, as outdoor sports often take precedence over indoor activities during the summer. Additionally, the presence of counterfeit cues and tables, especially in price-sensitive markets, undermines brand trust and squeezes profit margins for established manufacturers. Limited access to clubs in smaller cities and rural areas adds to these challenges, highlighting the need for better distribution, education, and brand protection strategies.
Opportunity:
Sustainability and Eco-Friendly Equipment
Sustainability is becoming an important growth factor in 2025. Consumers and clubs are increasingly choosing equipment made from responsibly sourced wood, low-emission finishes, and recyclable materials. Manufacturers that invest in certified materials and transparent sourcing practices can charge higher prices and meet the procurement standards of professional venues and hospitality chains.
Customization, Youth Programs, and Player Endorsements
Customization offers another valuable opportunity. Personalized cues, featuring custom weights, grips, engravings, and finishes, are gaining popularity among competitive and enthusiastic players. At the same time, youth leagues and school competitions are boosting demand for affordable, durable starter kits. Collaborations with professional players and federations for branded product lines enhance credibility and open up premium revenue streams.
Trend:
Advanced Materials and Smart Equipment Adoption
Technology is changing product innovation throughout the market. Carbon fiber cues, known for their consistency, durability, and reduced deflection, are becoming more popular among professionals and serious amateurs. Smart cues and training aids, which come with sensors that track stroke speed, angle, and accuracy, are also seeing wider use, supporting skill development and coaching.
Digital Engagement and Virtual Cue Sports Ecosystems
Digital platforms are expanding the reach of billiards and snooker beyond physical locations. Virtual billiards, online leagues, and esports-style tournaments are attracting younger audiences and global participants. Social media and influencer-driven content increase equipment visibility and technique education, boosting brand awareness. Together, these trends indicate a shift toward a more technology-driven and globally connected cue sports ecosystem that supports diverse revenue models and long-term market growth.
Recent Developments
Dec 2024 – World Confederation of Billiards Sports (WCBS): The WCBS announced partnerships with eight leading billiards brands to serve as official sponsors for the billiards program at The World Games 2025. This strategic collaboration enhances the global profile of cue sports by integrating top equipment manufacturers into a major international multi-sport event.
Jan 2025 – H. Betti Industries, Inc.: The company appointed Todd Cravens as Senior Vice President of its Gaming Division to guide its commercial strategy. This executive hire strengthens the leadership team to support the expansion of its product portfolio, including its Imperial billiards brand, across key markets.
Apr 2025 – Brunswick Billiards: The company expanded its professional roster by signing players Oscar Dominguez and Savannah Easton as official brand ambassadors. This initiative strengthens Brunswick's connection to the competitive circuit and increases its brand visibility among professional and aspiring players.
Oct 2025 – Yalin International Billiard Goods: In partnership with Predator Group, Yalin sponsored and hosted the 2025 WPA Men's 8-Ball World Championship in Bali, Indonesia. This high-profile event underscores Yalin's commitment to the professional circuit and solidifies its brand presence in the rapidly growing Asia-Pacific market.