Biodiversity Conservation Market to Hit $52.8B by 2034 | CAGR 9.4%
Global Biodiversity Conservation Market Size, Share, Analysis Report By Activity Type (Habitat Restoration, Species Protection, Ecosystem Management, Research and Monitoring), By End-Use Sector (Government Initiatives, Non-Governmental Organizations, Corporate Responsibility Initiatives, Community-Based Conservation), Region and Key Players - Industry Segment Overview, Market Dynamics, Competitive Strategies, Trends and Forecast 2025-2034
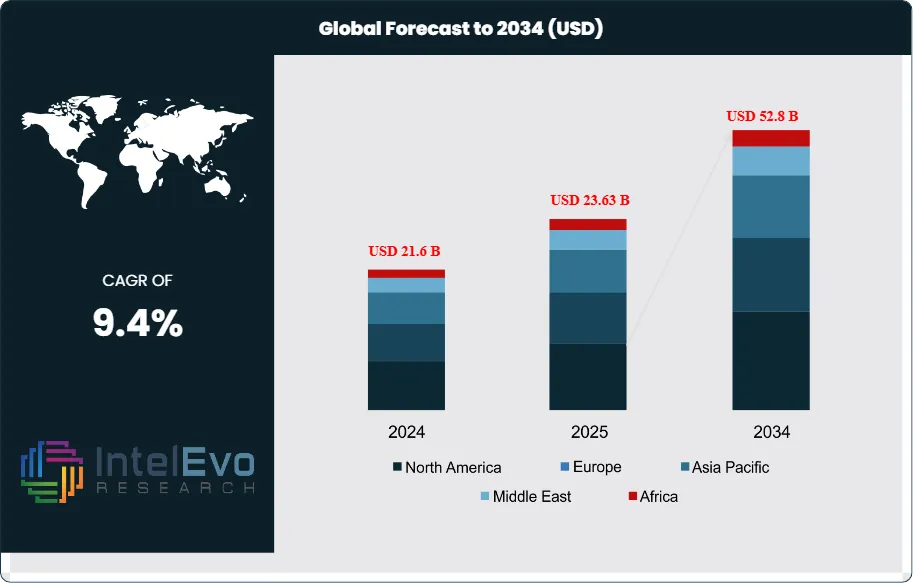
The Biodiversity Conservation Market size is expected to be worth around USD 52.8 billion by 2034, from USD 21.6 billion in 2024, growing at a CAGR of 9.4% during the forecast period from 2024 to 2034. This significant growth is driven by increasing public and corporate awareness of environmental issues and the urgent need to protect endangered species and ecosystems. Governments and non-profit organizations are also playing a crucial role by implementing new policies and funding initiatives to support conservation efforts.
The biodiversity conservation market encompasses a range of activities, services, and initiatives aimed at the protection, preservation, and sustainable management of biological diversity. This market includes efforts to conserve ecosystems, protect endangered species, restore habitats, and promote sustainable practices across various sectors. It is driven by the recognition of biodiversity's critical role in maintaining ecosystem health, supporting livelihoods, and mitigating climate change impacts.
Increasing regulations and international agreements aimed at biodiversity conservation are fostering investments in this sector. Governments are implementing policies that promote sustainable land use and protect endangered species. Businesses are increasingly recognizing the importance of biodiversity in their operations. Many companies are integrating sustainability into their corporate strategies, leading to greater funding for conservation efforts. Growing public concern regarding climate change and biodiversity loss is prompting more support for conservation initiatives. Educational campaigns and advocacy efforts are raising awareness about the importance of preserving natural ecosystems.
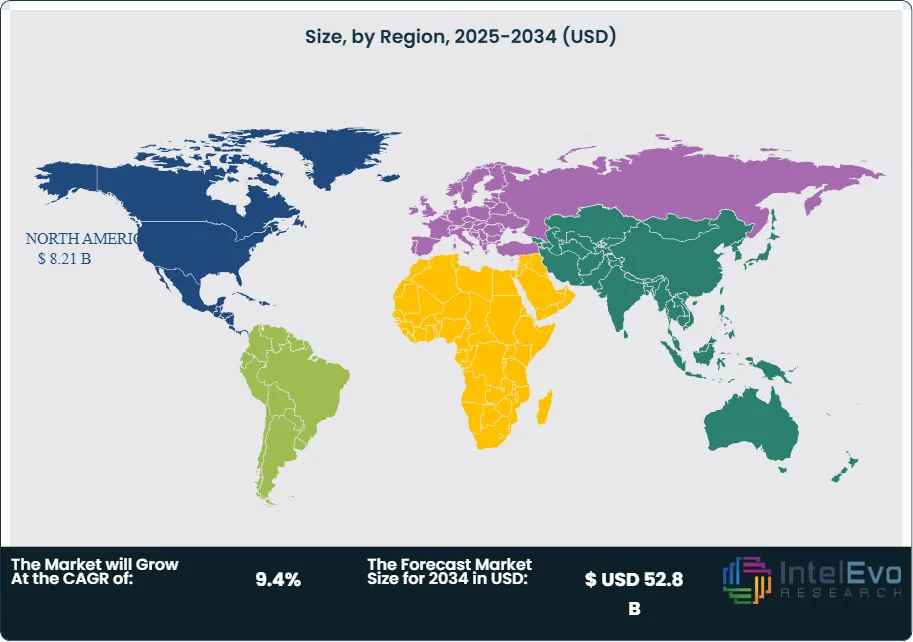
Geographically, the biodiversity conservation market is seeing varied growth patterns. North America and Europe are established markets with strong governmental support for conservation initiatives. In contrast, the Asia-Pacific region is expected to experience significant growth due to rapid industrialization and increasing environmental awareness among its growing population.
The COVID-19 pandemic has had a mixed impact on the biodiversity conservation market. On one hand, it temporarily disrupted funding and project implementation due to lockdowns and shifting priorities. On the other hand, the pandemic has heightened awareness about the interconnectedness of human health and environmental health, leading to renewed interest in biodiversity conservation efforts. As recovery progresses, there is potential for increased investment in sustainable practices as governments and organizations recognize the importance of resilient ecosystems in preventing future pandemics.
Key Takeaways
Market Growth: The biodiversity conservation market is projected to experience significant growth, with an expected value of approximately USD 52.8 billion by 2034, down from USD 21.6 billion in 2024, indicating a CAGR of 9.4% during the forecast period.
Activity Type Dominance: The market is primarily driven by activities such as habitat restoration, species protection, and ecosystem management. Habitat restoration is expected to dominate due to increasing efforts to rehabilitate degraded ecosystems.
End-Use Sector Preference: Government initiatives and non-governmental organizations (NGOs) are the leading end-use sectors, with significant contributions from corporate sustainability programs focused on biodiversity.
Driver: Key drivers include increasing government regulations aimed at biodiversity protection, growing public awareness of environmental issues, and corporate responsibility initiatives that incorporate sustainability practices.
Restraint: Major restraints include funding limitations for conservation projects and challenges related to climate change impacts on ecosystems, which complicate conservation efforts.
Opportunity: There is a significant opportunity for growth in developing regions, particularly in Asia-Pacific, where rapid industrialization and increasing environmental awareness present potential for investment in biodiversity conservation initiatives.
Trend: A notable trend is the integration of technology in monitoring and data analysis for biodiversity conservation, enhancing the effectiveness of conservation strategies and decision-making processes.
Regional Analysis: North America and Europe are currently leading regions in terms of market share due to strong governmental support for conservation initiatives. The Asia-Pacific region is expected to witness the highest growth due to rising investments in environmental sustainability and increasing public awareness of biodiversity issues.
Services Type Analysis:
The habitat restoration segment accounted for a revenue share of 43.6% in 2023 attributed to focuses on rehabilitating and restoring degraded ecosystems, which is essential for enhancing biodiversity. It involves reforestation, wetland restoration, and the reclamation of areas affected by industrial activities. The growing recognition of habitat loss as a significant threat to biodiversity drives this segment's dominance. Species Protection segment includes efforts aimed at safeguarding endangered and threatened species through breeding programs, habitat protection, and legal frameworks to prevent poaching. The increasing number of species facing extinction due to habitat destruction and climate change fuels demand for effective species protection initiatives.
End-Use Sector Analysis:
Governments held the largest market revenue share in 2024. Governments worldwide are key players in biodiversity conservation, implementing policies and funding projects aimed at protecting ecosystems and species. Public sector investments are critical for large-scale conservation initiatives. Non-Governmental Organizations (NGOs) segment play an instrumental role in advocating for biodiversity conservation, conducting research, and implementing projects on the ground. They often collaborate with governments and local communities to enhance conservation efforts.
Region Analysis:
North America Leads with 38% Market Share In Biodiversity Conservation Market. North America is a leading region in the biodiversity conservation market, accounting for approximately 38% of the global share. The United States and Canada have robust governmental policies that support conservation initiatives, with substantial funding directed toward habitat restoration and species protection. The presence of numerous non-governmental organizations (NGOs) further bolsters these efforts, focusing on advocacy and community engagement. However, challenges such as land-use conflicts and funding limitations can hinder progress. Europe follows closely, holding about 30% of the market share. The European Union's commitment to biodiversity through various directives and funding programs drives significant investment in conservation projects. Countries like Germany, France, and the UK are at the forefront, implementing effective strategies to protect ecosystems and promote sustainable practices. Nevertheless, regulatory complexities can sometimes slow down project implementation.
In the Asia-Pacific region, which is expected to witness the highest growth rate, the market share is projected at around 25%. Rapid industrialization in countries like China and India is driving demand for biodiversity conservation initiatives. Increased public awareness about environmental issues is prompting investments in sustainable practices. However, balancing economic development with conservation remains a critical challenge as urbanization often leads to habitat destruction.
By Service Type (Habitat Restoration, Species Protection, Pollution Control, Sustainable Forestry, Marine Conservation, Others), By End-user (Public Sector, Private Sector, Communities & Local Organizations), By Application (Government Initiatives, Non-Governmental Organizations (NGOs), Corporate Sustainability Programs, Research & Education, Community-Based Conservation)
Research Methodology
Primary Research- 100 Interviews of Stakeholders
Secondary Research
Desk Research
Regional scope
North America (United States, Canada, Mexico)
Latin America (Brazil, Argentina, Columbia)
East Asia And Pacific (China, Japan, South Korea, Australia, Cambodia, Fiji, Indonesia)
Sea And South Asia (India, Singapore, Thailand, Taiwan, Malaysia)
Eastern Europe (Poland, Russia, Czech Republic, Romania)
Western Europe (Germany, U.K., France, Spain, Itlay)
Middle East & Africa (GCC Countries, Egypt, Nigeria, South Africa, Israel)
Competitive Landscape
World Wildlife Fund (WWF), The Nature Conservancy (TNC), Conservation International, Wildlife Conservation Society (WCS), BirdLife International, International Union for Conservation of Nature (IUCN), Rainforest Alliance, Fauna & Flora International (FFI), Global Environment Facility (GEF), United Nations Environment Programme (UNEP), National Geographic Society, Air Liquide, Linde plc, Messer Group GmbH, Proton Gases (India) Pvt. Ltd., Air Products and Chemicals, Inc.
Customization Scope
Customization for segments, region/country-level will be provided. Moreover, additional customization can be done based on the requirements.
Pricing and Purchase Options
Avail customized purchase options to meet your exact research needs. We have three licenses to opt for: Single User License, Multi-User License (Up to 5 Users), Corporate Use License (Unlimited User and Printable PDF).
TABLE OF CONTENTS
1. EXECUTIVE SUMMARY
1.1. MARKET SNAPSHOT
1.2. KEY FINDINGS & INSIGHTS
1.3. ANALYST RECOMMENDATIONS
1.4. FUTURE OUTLOOK
2. RESEARCH METHODOLOGY
2.1. MARKET DEFINITION & SCOPE
2.2. RESEARCH OBJECTIVES: PRIMARY & SECONDARY DATA SOURCES
2.3. DATA COLLECTION SOURCES
2.3.1. COVERAGE OF 100+ PRIMARY RESEARCH/CONSULTATION CALLS WITH INDUSTRY STAKEHOLDERS
FIGURE 17 NORTH AMERICA BIODIVERSITY CONSERVATION CURRENT AND FUTURE TYPE ANALYSIS, 2025–2034, (USD MILLION)
FIGURE 18 NORTH AMERICA BIODIVERSITY CONSERVATION CURRENT AND FUTURE END USER ANALYSIS, 2025–2034, (USD MILLION)
FIGURE 19 MARKET SHARE BY COUNTRY
FIGURE 20 LATIN AMERICA BIODIVERSITY CONSERVATION CURRENT AND FUTURE TYPE ANALYSIS, 2025–2034, (USD MILLION)
FIGURE 21 LATIN AMERICA BIODIVERSITY CONSERVATION CURRENT AND FUTURE END USER ANALYSIS, 2025–2034, (USD MILLION)
FIGURE 22 MARKET SHARE BY COUNTRY
FIGURE 23 EASTERN EUROPE BIODIVERSITY CONSERVATION CURRENT AND FUTURE TYPE ANALYSIS, 2025–2034, (USD MILLION)
FIGURE 24 EASTERN EUROPE BIODIVERSITY CONSERVATION CURRENT AND FUTURE END USER ANALYSIS, 2025–2034, (USD MILLION)
FIGURE 25 MARKET SHARE BY COUNTRY
FIGURE 26 WESTERN EUROPE BIODIVERSITY CONSERVATION CURRENT AND FUTURE TYPE ANALYSIS, 2025–2034, (USD MILLION)
FIGURE 27 WESTERN EUROPE BIODIVERSITY CONSERVATION CURRENT AND FUTURE END USER ANALYSIS, 2025–2034, (USD MILLION)
FIGURE 28 MARKET SHARE BY COUNTRY
FIGURE 29 EAST ASIA AND PACIFIC BIODIVERSITY CONSERVATION CURRENT AND FUTURE TYPE ANALYSIS, 2025–2034, (USD MILLION)
FIGURE 30 EAST ASIA AND PACIFIC BIODIVERSITY CONSERVATION CURRENT AND FUTURE END USER ANALYSIS, 2025–2034, (USD MILLION)
FIGURE 31 MARKET SHARE BY COUNTRY
FIGURE 32 SEA AND SOUTH ASIA BIODIVERSITY CONSERVATION CURRENT AND FUTURE TYPE ANALYSIS, 2025–2034, (USD MILLION)
FIGURE 33 SEA AND SOUTH ASIA BIODIVERSITY CONSERVATION CURRENT AND FUTURE END USER ANALYSIS, 2025–2034, (USD MILLION)
FIGURE 34 MARKET SHARE BY COUNTRY
FIGURE 35 MIDDLE EAST AND AFRICA BIODIVERSITY CONSERVATION CURRENT AND FUTURE TYPE ANALYSIS, 2025–2034, (USD MILLION)
FIGURE 36 MIDDLE EAST AND AFRICA BIODIVERSITY CONSERVATION CURRENT AND FUTURE END USER ANALYSIS, 2025–2034, (USD MILLION)
FIGURE 37 NORTH AMERICA BIODIVERSITY CONSERVATION CURRENT AND FUTURE MARKET VOLUME SHARE REGIONAL ANALYSIS, 2025–2034, (USD MILLION)
FIGURE 38 U.S. BIODIVERSITY CONSERVATION CURRENT AND FUTURE TYPE ANALYSIS, 2025–2034, (USD MILLION)
FIGURE 39 U.S. BIODIVERSITY CONSERVATION CURRENT AND FUTURE END USER ANALYSIS, 2025–2034, (USD MILLION)
FIGURE 40 CANADA BIODIVERSITY CONSERVATION CURRENT AND FUTURE TYPE ANALYSIS, 2025–2034, (USD MILLION)
FIGURE 41 CANADA BIODIVERSITY CONSERVATION CURRENT AND FUTURE END USER ANALYSIS, 2025–2034, (USD MILLION)
FIGURE 42 LATIN AMERICA BIODIVERSITY CONSERVATION CURRENT AND FUTURE MARKET VOLUME SHARE REGIONAL ANALYSIS, 2025–2034, (USD MILLION)
FIGURE 43 MEXICO BIODIVERSITY CONSERVATION CURRENT AND FUTURE TYPE ANALYSIS, 2025–2034, (USD MILLION)
FIGURE 44 MEXICO BIODIVERSITY CONSERVATION CURRENT AND FUTURE END USER ANALYSIS, 2025–2034, (USD MILLION)
FIGURE 45 BRAZIL BIODIVERSITY CONSERVATION CURRENT AND FUTURE TYPE ANALYSIS, 2025–2034, (USD MILLION)
FIGURE 46 BRAZIL BIODIVERSITY CONSERVATION CURRENT AND FUTURE END USER ANALYSIS, 2025–2034, (USD MILLION)
FIGURE 47 ARGENTINA BIODIVERSITY CONSERVATION CURRENT AND FUTURE TYPE ANALYSIS, 2025–2034, (USD MILLION)
FIGURE 48 ARGENTINA BIODIVERSITY CONSERVATION CURRENT AND FUTURE END USER ANALYSIS, 2025–2034, (USD MILLION)
FIGURE 49 COLUMBIA BIODIVERSITY CONSERVATION CURRENT AND FUTURE TYPE ANALYSIS, 2025–2034, (USD MILLION)
FIGURE 50 COLUMBIA BIODIVERSITY CONSERVATION CURRENT AND FUTURE END USER ANALYSIS, 2025–2034, (USD MILLION)
FIGURE 51 REST OF LATIN AMERICA BIODIVERSITY CONSERVATION CURRENT AND FUTURE TYPE ANALYSIS, 2025–2034, (USD MILLION)
FIGURE 52 REST OF LATIN AMERICA BIODIVERSITY CONSERVATION CURRENT AND FUTURE END USER ANALYSIS, 2025–2034, (USD MILLION)
FIGURE 53 EASTERN EUROPE BIODIVERSITY CONSERVATION CURRENT AND FUTURE MARKET VOLUME SHARE REGIONAL ANALYSIS, 2025–2034, (USD MILLION)
FIGURE 54 POLAND BIODIVERSITY CONSERVATION CURRENT AND FUTURE TYPE ANALYSIS, 2025–2034, (USD MILLION)
FIGURE 55 POLAND BIODIVERSITY CONSERVATION CURRENT AND FUTURE END USER ANALYSIS, 2025–2034, (USD MILLION)
FIGURE 56 RUSSIA BIODIVERSITY CONSERVATION CURRENT AND FUTURE TYPE ANALYSIS, 2025–2034, (USD MILLION)
FIGURE 57 RUSSIA BIODIVERSITY CONSERVATION CURRENT AND FUTURE END USER ANALYSIS, 2025–2034, (USD MILLION)
FIGURE 58 CZECH REPUBLIC BIODIVERSITY CONSERVATION CURRENT AND FUTURE TYPE ANALYSIS, 2025–2034, (USD MILLION)
FIGURE 59 CZECH REPUBLIC BIODIVERSITY CONSERVATION CURRENT AND FUTURE END USER ANALYSIS, 2025–2034, (USD MILLION)
FIGURE 60 ROMANIA BIODIVERSITY CONSERVATION CURRENT AND FUTURE TYPE ANALYSIS, 2025–2034, (USD MILLION)
FIGURE 61 ROMANIA BIODIVERSITY CONSERVATION CURRENT AND FUTURE END USER ANALYSIS, 2025–2034, (USD MILLION)
FIGURE 62 REST OF EASTERN EUROPE BIODIVERSITY CONSERVATION CURRENT AND FUTURE TYPE ANALYSIS, 2025–2034, (USD MILLION)
FIGURE 63 REST OF EASTERN EUROPE BIODIVERSITY CONSERVATION CURRENT AND FUTURE END USER ANALYSIS, 2025–2034, (USD MILLION)
FIGURE 64 WESTERN EUROPE BIODIVERSITY CONSERVATION CURRENT AND FUTURE MARKET VOLUME SHARE REGIONAL ANALYSIS, 2025–2034, (USD MILLION)
FIGURE 65 GERMANY BIODIVERSITY CONSERVATION CURRENT AND FUTURE TYPE ANALYSIS, 2025–2034, (USD MILLION)
FIGURE 66 GERMANY BIODIVERSITY CONSERVATION CURRENT AND FUTURE END USER ANALYSIS, 2025–2034, (USD MILLION)
FIGURE 67 FRANCE BIODIVERSITY CONSERVATION CURRENT AND FUTURE TYPE ANALYSIS, 2025–2034, (USD MILLION)
FIGURE 68 FRANCE BIODIVERSITY CONSERVATION CURRENT AND FUTURE END USER ANALYSIS, 2025–2034, (USD MILLION)
FIGURE 69 UK BIODIVERSITY CONSERVATION CURRENT AND FUTURE TYPE ANALYSIS, 2025–2034, (USD MILLION)
FIGURE 70 UK BIODIVERSITY CONSERVATION CURRENT AND FUTURE END USER ANALYSIS, 2025–2034, (USD MILLION)
FIGURE 71 SPAIN BIODIVERSITY CONSERVATION CURRENT AND FUTURE TYPE ANALYSIS, 2025–2034, (USD MILLION)
FIGURE 72 SPAIN BIODIVERSITY CONSERVATION CURRENT AND FUTURE END USER ANALYSIS, 2025–2034, (USD MILLION)
FIGURE 73 ITALY BIODIVERSITY CONSERVATION CURRENT AND FUTURE TYPE ANALYSIS, 2025–2034, (USD MILLION)
FIGURE 74 ITALY BIODIVERSITY CONSERVATION CURRENT AND FUTURE END USER ANALYSIS, 2025–2034, (USD MILLION)
FIGURE 75 REST OF WESTERN EUROPE BIODIVERSITY CONSERVATION CURRENT AND FUTURE TYPE ANALYSIS, 2025–2034, (USD MILLION)
FIGURE 76 REST OF WESTERN EUROPE BIODIVERSITY CONSERVATION CURRENT AND FUTURE END USER ANALYSIS, 2025–2034, (USD MILLION)
FIGURE 77 EAST ASIA AND PACIFIC BIODIVERSITY CONSERVATION CURRENT AND FUTURE MARKET VOLUME SHARE REGIONAL ANALYSIS, 2025–2034, (USD MILLION)
FIGURE 78 CHINA BIODIVERSITY CONSERVATION CURRENT AND FUTURE TYPE ANALYSIS, 2025–2034, (USD MILLION)
FIGURE 79 CHINA BIODIVERSITY CONSERVATION CURRENT AND FUTURE END USER ANALYSIS, 2025–2034, (USD MILLION)
FIGURE 80 JAPAN BIODIVERSITY CONSERVATION CURRENT AND FUTURE TYPE ANALYSIS, 2025–2034, (USD MILLION)
FIGURE 81 JAPAN BIODIVERSITY CONSERVATION CURRENT AND FUTURE END USER ANALYSIS, 2025–2034, (USD MILLION)
FIGURE 82 AUSTRALIA BIODIVERSITY CONSERVATION CURRENT AND FUTURE TYPE ANALYSIS, 2025–2034, (USD MILLION)
FIGURE 83 AUSTRALIA BIODIVERSITY CONSERVATION CURRENT AND FUTURE END USER ANALYSIS, 2025–2034, (USD MILLION)
FIGURE 84 CAMBODIA BIODIVERSITY CONSERVATION CURRENT AND FUTURE TYPE ANALYSIS, 2025–2034, (USD MILLION)
FIGURE 85 CAMBODIA BIODIVERSITY CONSERVATION CURRENT AND FUTURE END USER ANALYSIS, 2025–2034, (USD MILLION)
FIGURE 86 FIJI BIODIVERSITY CONSERVATION CURRENT AND FUTURE TYPE ANALYSIS, 2025–2034, (USD MILLION)
FIGURE 87 FIJI BIODIVERSITY CONSERVATION CURRENT AND FUTURE END USER ANALYSIS, 2025–2034, (USD MILLION)
FIGURE 88 INDONESIA BIODIVERSITY CONSERVATION CURRENT AND FUTURE TYPE ANALYSIS, 2025–2034, (USD MILLION)
FIGURE 89 INDONESIA BIODIVERSITY CONSERVATION CURRENT AND FUTURE END USER ANALYSIS, 2025–2034, (USD MILLION)
FIGURE 90 SOUTH KOREA BIODIVERSITY CONSERVATION CURRENT AND FUTURE TYPE ANALYSIS, 2025–2034, (USD MILLION)
FIGURE 91 SOUTH KOREA BIODIVERSITY CONSERVATION CURRENT AND FUTURE END USER ANALYSIS, 2025–2034, (USD MILLION)
FIGURE 92 REST OF EAST ASIA AND PACIFIC BIODIVERSITY CONSERVATION CURRENT AND FUTURE TYPE ANALYSIS, 2025–2034, (USD MILLION)
FIGURE 93 REST OF EAST ASIA AND PACIFIC BIODIVERSITY CONSERVATION CURRENT AND FUTURE END USER ANALYSIS, 2025–2034, (USD MILLION)
FIGURE 94 SEA AND SOUTH ASIA BIODIVERSITY CONSERVATION CURRENT AND FUTURE MARKET VOLUME SHARE REGIONAL ANALYSIS, 2025–2034, (USD MILLION)
FIGURE 95 BANGLADESH BIODIVERSITY CONSERVATION CURRENT AND FUTURE TYPE ANALYSIS, 2025–2034, (USD MILLION)
FIGURE 96 BANGLADESH BIODIVERSITY CONSERVATION CURRENT AND FUTURE END USER ANALYSIS, 2025–2034, (USD MILLION)
FIGURE 97 NEW ZEALAND BIODIVERSITY CONSERVATION CURRENT AND FUTURE TYPE ANALYSIS, 2025–2034, (USD MILLION)
FIGURE 98 NEW ZEALAND BIODIVERSITY CONSERVATION CURRENT AND FUTURE END USER ANALYSIS, 2025–2034, (USD MILLION)
FIGURE 99 INDIA BIODIVERSITY CONSERVATION CURRENT AND FUTURE TYPE ANALYSIS, 2025–2034, (USD MILLION)
FIGURE 100 INDIA BIODIVERSITY CONSERVATION CURRENT AND FUTURE END USER ANALYSIS, 2025–2034, (USD MILLION)
FIGURE 101 SINGAPORE BIODIVERSITY CONSERVATION CURRENT AND FUTURE TYPE ANALYSIS, 2025–2034, (USD MILLION)
FIGURE 102 SINGAPORE BIODIVERSITY CONSERVATION CURRENT AND FUTURE END USER ANALYSIS, 2025–2034, (USD MILLION)
FIGURE 103 THAILAND BIODIVERSITY CONSERVATION CURRENT AND FUTURE TYPE ANALYSIS, 2025–2034, (USD MILLION)
FIGURE 104 THAILAND BIODIVERSITY CONSERVATION CURRENT AND FUTURE END USER ANALYSIS, 2025–2034, (USD MILLION)
FIGURE 105 TAIWAN BIODIVERSITY CONSERVATION CURRENT AND FUTURE TYPE ANALYSIS, 2025–2034, (USD MILLION)
FIGURE 106 TAIWAN BIODIVERSITY CONSERVATION CURRENT AND FUTURE END USER ANALYSIS, 2025–2034, (USD MILLION)
FIGURE 107 MALAYSIA BIODIVERSITY CONSERVATION CURRENT AND FUTURE TYPE ANALYSIS, 2025–2034, (USD MILLION)
FIGURE 108 MALAYSIA BIODIVERSITY CONSERVATION CURRENT AND FUTURE END USER ANALYSIS, 2025–2034, (USD MILLION)
FIGURE 109 REST OF SEA AND SOUTH ASIA BIODIVERSITY CONSERVATION CURRENT AND FUTURE TYPE ANALYSIS, 2025–2034, (USD MILLION)
FIGURE 110 REST OF SEA AND SOUTH ASIA BIODIVERSITY CONSERVATION CURRENT AND FUTURE END USER ANALYSIS, 2025–2034, (USD MILLION)
FIGURE 111 MIDDLE EAST AND AFRICA BIODIVERSITY CONSERVATION CURRENT AND FUTURE MARKET VOLUME SHARE REGIONAL ANALYSIS, 2025–2034, (USD MILLION)
FIGURE 112 GCC COUNTRIES BIODIVERSITY CONSERVATION CURRENT AND FUTURE TYPE ANALYSIS, 2025–2034, (USD MILLION)
FIGURE 113 GCC COUNTRIES BIODIVERSITY CONSERVATION CURRENT AND FUTURE END USER ANALYSIS, 2025–2034, (USD MILLION)
FIGURE 114 SAUDI ARABIA BIODIVERSITY CONSERVATION CURRENT AND FUTURE TYPE ANALYSIS, 2025–2034, (USD MILLION)
FIGURE 115 SAUDI ARABIA BIODIVERSITY CONSERVATION CURRENT AND FUTURE END USER ANALYSIS, 2025–2034, (USD MILLION)
FIGURE 116 UAE BIODIVERSITY CONSERVATION CURRENT AND FUTURE TYPE ANALYSIS, 2025–2034, (USD MILLION)
FIGURE 117 UAE BIODIVERSITY CONSERVATION CURRENT AND FUTURE END USER ANALYSIS, 2025–2034, (USD MILLION)
FIGURE 118 BAHRAIN BIODIVERSITY CONSERVATION CURRENT AND FUTURE TYPE ANALYSIS, 2025–2034, (USD MILLION)
FIGURE 119 BAHRAIN BIODIVERSITY CONSERVATION CURRENT AND FUTURE END USER ANALYSIS, 2025–2034, (USD MILLION)
FIGURE 120 KUWAIT BIODIVERSITY CONSERVATION CURRENT AND FUTURE TYPE ANALYSIS, 2025–2034, (USD MILLION)
FIGURE 121 KUWAIT BIODIVERSITY CONSERVATION CURRENT AND FUTURE END USER ANALYSIS, 2025–2034, (USD MILLION)
FIGURE 122 OMAN BIODIVERSITY CONSERVATION CURRENT AND FUTURE TYPE ANALYSIS, 2025–2034, (USD MILLION)
FIGURE 123 OMAN BIODIVERSITY CONSERVATION CURRENT AND FUTURE END USER ANALYSIS, 2025–2034, (USD MILLION)
FIGURE 124 QATAR BIODIVERSITY CONSERVATION CURRENT AND FUTURE TYPE ANALYSIS, 2025–2034, (USD MILLION)
FIGURE 125 QATAR BIODIVERSITY CONSERVATION CURRENT AND FUTURE END USER ANALYSIS, 2025–2034, (USD MILLION)
FIGURE 126 EGYPT BIODIVERSITY CONSERVATION CURRENT AND FUTURE TYPE ANALYSIS, 2025–2034, (USD MILLION)
FIGURE 127 EGYPT BIODIVERSITY CONSERVATION CURRENT AND FUTURE END USER ANALYSIS, 2025–2034, (USD MILLION)
FIGURE 128 NIGERIA BIODIVERSITY CONSERVATION CURRENT AND FUTURE TYPE ANALYSIS, 2025–2034, (USD MILLION)
FIGURE 129 NIGERIA BIODIVERSITY CONSERVATION CURRENT AND FUTURE END USER ANALYSIS, 2025–2034, (USD MILLION)
FIGURE 130 SOUTH AFRICA BIODIVERSITY CONSERVATION CURRENT AND FUTURE TYPE ANALYSIS, 2025–2034, (USD MILLION)
FIGURE 131 SOUTH AFRICA BIODIVERSITY CONSERVATION CURRENT AND FUTURE END USER ANALYSIS, 2025–2034, (USD MILLION)
FIGURE 132 ISRAEL BIODIVERSITY CONSERVATION CURRENT AND FUTURE TYPE ANALYSIS, 2025–2034, (USD MILLION)
FIGURE 133 ISRAEL BIODIVERSITY CONSERVATION CURRENT AND FUTURE END USER ANALYSIS, 2025–2034, (USD MILLION)
FIGURE 134 REST OF MEA BIODIVERSITY CONSERVATION CURRENT AND FUTURE TYPE ANALYSIS, 2025–2034, (USD MILLION)
FIGURE 135 REST OF MEA BIODIVERSITY CONSERVATION CURRENT AND FUTURE END USER ANALYSIS, 2025–2034, (USD MILLION)
FIGURE 136 U. S. MARKET SHARE ANALYSIS BY TYPE (2024)
FIGURE 137 U. S. MARKET SHARE ANALYSIS BY END USER (2024)
FIGURE 138 CANADA MARKET SHARE ANALYSIS BY TYPE (2024)
FIGURE 139 CANADA MARKET SHARE ANALYSIS BY END USER (2024)
FIGURE 140 MEXICO MARKET SHARE ANALYSIS BY TYPE (2024)
FIGURE 141 MEXICO MARKET SHARE ANALYSIS BY END USER (2024)
FIGURE 142 CHINA MARKET SHARE ANALYSIS BY TYPE (2024)
FIGURE 143 CHINA MARKET SHARE ANALYSIS BY END USER (2024)
FIGURE 144 JAPAN MARKET SHARE ANALYSIS BY TYPE (2024)
FIGURE 145 JAPAN MARKET SHARE ANALYSIS BY END USER (2024)
FIGURE 146 INDIA MARKET SHARE ANALYSIS BY TYPE (2024)
FIGURE 147 INDIA MARKET SHARE ANALYSIS BY END USER (2024)
FIGURE 148 SOUTH KOREA MARKET SHARE ANALYSIS BY TYPE (2024)
FIGURE 149 SOUTH KOREA MARKET SHARE ANALYSIS BY END USER (2024)
FIGURE 150 SAUDI ARABIA MARKET SHARE ANALYSIS BY TYPE (2024)
FIGURE 151 SAUDI ARABIA MARKET SHARE ANALYSIS BY END USER (2024)
FIGURE 152 UAE MARKET SHARE ANALYSIS BY TYPE (2024)
FIGURE 153 UAE MARKET SHARE ANALYSIS BY END USER (2024)
FIGURE 154 EGYPT MARKET SHARE ANALYSIS BY TYPE (2024)
FIGURE 155 EGYPT MARKET SHARE ANALYSIS BY END USER (2024)
FIGURE 156 NIGERIA MARKET SHARE ANALYSIS BY TYPE (2024)
FIGURE 157 NIGERIA MARKET SHARE ANALYSIS BY END USER (2024)
FIGURE 158 SOUTH AFRICA MARKET SHARE ANALYSIS BY TYPE (2024)
FIGURE 159 SOUTH AFRICA MARKET SHARE ANALYSIS BY END USER (2024)
FIGURE 160 GERMANY MARKET SHARE ANALYSIS BY TYPE (2024)
FIGURE 161 GERMANY MARKET SHARE ANALYSIS BY END USER (2024)
FIGURE 162 FRANCE MARKET SHARE ANALYSIS BY TYPE (2024)
FIGURE 163 FRANCE MARKET SHARE ANALYSIS BY END USER (2024)
FIGURE 164 UK MARKET SHARE ANALYSIS BY TYPE (2024)
FIGURE 165 UK MARKET SHARE ANALYSIS BY END USER (2024)
FIGURE 166 SPAIN MARKET SHARE ANALYSIS BY TYPE (2024)
FIGURE 167 SPAIN MARKET SHARE ANALYSIS BY END USER (2024)
FIGURE 168 ITALY MARKET SHARE ANALYSIS BY TYPE (2024)
FIGURE 169 ITALY MARKET SHARE ANALYSIS BY END USER (2024)
FIGURE 170 BRAZIL MARKET SHARE ANALYSIS BY TYPE (2024)
FIGURE 171 BRAZIL MARKET SHARE ANALYSIS BY END USER (2024)
FIGURE 172 ARGENTINA MARKET SHARE ANALYSIS BY TYPE (2024)
FIGURE 173 ARGENTINA MARKET SHARE ANALYSIS BY END USER (2024)
FIGURE 174 COLUMBIA MARKET SHARE ANALYSIS BY TYPE (2024)
FIGURE 175 COLUMBIA MARKET SHARE ANALYSIS BY END USER (2024)
FIGURE 176 GLOBAL BIODIVERSITY CONSERVATION CURRENT AND FUTURE MARKET KEY COUNTRY LEVEL ANALYSIS, 2024–2034, (USD MILLION)
FIGURE 177 FINANCIAL OVERVIEW:
Key Players Analysis:
World Wildlife Fund (WWF): As one of the most recognized NGOs globally, WWF focuses on wildlife conservation and reducing humanity's ecological footprint. The organization engages in numerous projects aimed at preserving habitats and protecting endangered species, leveraging its extensive network to mobilize resources and raise public awareness.
Conservation International: This NGO emphasizes the importance of biodiversity for human well-being and economic prosperity. Conservation International works globally to protect ecosystems and promote sustainable practices, often collaborating with local communities and governments to implement effective conservation strategies.
The Nature Conservancy: Known for its science-based approach, The Nature Conservancy operates in over 70 countries, focusing on land and water conservation. The organization engages in habitat restoration projects and advocates for sustainable land use policies, making it a significant player in the biodiversity conservation market.
International Union for Conservation of Nature (IUCN): IUCN is a global authority on the status of the natural world and the measures needed to safeguard it. It provides a platform for governments, NGOs, and businesses to collaborate on conservation initiatives and policy development.
National Geographic Society: While primarily known for its media presence, National Geographic also invests heavily in conservation projects worldwide. Its initiatives often focus on research, education, and advocacy to promote biodiversity protection.
Air Liquide: A major player in the industrial gases sector, Air Liquide is increasingly involved in sustainability initiatives related to biodiversity conservation. The company invests in technologies that minimize environmental impact and support ecological projects.
Linde plc: Another significant industrial gas company, Linde emphasizes sustainability in its operations and has been involved in various programs aimed at reducing carbon footprints and promoting environmental stewardship.
Messer Group GmbH: This company is committed to providing essential gases while supporting sustainability efforts through various environmental initiatives, including biodiversity conservation projects.
Market Key Players
World Wildlife Fund (WWF)
Conservation International
The Nature Conservancy
International Union for Conservation of Nature (IUCN)
National Geographic Society
Air Liquide
Linde plc
Messer Group GmbH
Proton Gases (India) Pvt. Ltd.
Air Products and Chemicals, Inc.
Driver:
Government Regulations
Increasing governmental policies and regulations aimed at protecting biodiversity are driving significant investments in conservation initiatives. These regulations often include funding for habitat restoration, species protection, and ecosystem management.
Public Awareness
Growing public awareness and concern regarding climate change and biodiversity loss are prompting more individuals and organizations to support conservation efforts. This heightened awareness leads to increased participation in conservation programs and donations to environmental organizations.
Corporate Sustainability Initiatives
Businesses are increasingly recognizing the importance of integrating sustainability into their operations, leading to greater funding for biodiversity conservation projects. Many corporations are adopting corporate social responsibility (CSR) strategies that include biodiversity conservation as a key focus area.
Restraints
Funding Limitations
Many conservation projects struggle with securing adequate funding, particularly in developing regions where financial resources are scarce. This limitation can hinder the implementation of effective conservation strategies.
Climate Change Challenges
Ongoing climate change impacts, such as habitat loss and altered ecosystems, complicate conservation efforts and can limit their effectiveness. These challenges make it difficult to maintain biodiversity in affected areas.
High Implementation Costs
The costs associated with implementing effective conservation strategies can deter investment from both public and private sectors. High expenses related to research, monitoring, and habitat restoration can restrict the scope of conservation initiatives.
Opportunities
Emerging Economies
Rapid industrialization in emerging economies presents significant opportunities for investment in biodiversity conservation initiatives. As these regions develop, there is a growing need for sustainable practices that protect natural resources.
Community-Based Conservation
There is a growing demand for community-based conservation projects that engage local populations in protecting their natural resources. Such initiatives often lead to more sustainable outcomes by incorporating local knowledge and priorities.
Technological Advancements
Innovations in monitoring and data analysis technologies offer new solutions for assessing biodiversity and enhancing conservation strategies. Tools like remote sensing and geographic information systems (GIS) can improve the effectiveness of conservation efforts.
Trends
Integration of Technology
The increasing use of technology in conservation efforts allows for more effective monitoring and management of ecosystems. Technologies such as drones, satellite imagery, and mobile applications are becoming commonplace in biodiversity assessments.
Collaborative Approaches
There is a notable trend toward collaboration among governments, NGOs, and private sectors to implement comprehensive conservation strategies. Partnerships enhance resource sharing and increase the effectiveness of initiatives.
Sustainable Practices
A growing emphasis on sustainable practices in agriculture and forestry is becoming more prominent as part of broader efforts to mitigate biodiversity loss. This includes promoting agroecology, reforestation, and sustainable land-use practices.
Recent Development
September 2025: On September 19, 2025, Morocco became the 60th country to ratify the High Seas Treaty. This agreement is the first legally binding international pact aimed at protecting marine biodiversity in international waters. The treaty creates a legal framework for establishing marine protected areas, regulating harmful activities, and promoting international scientific collaboration. It covers nearly two-thirds of the ocean and half of Earth's surface.
August 2025: A study led by researchers at the University of North Carolina at Chapel Hill found a 72% decline in flying insect populations in a remote subalpine meadow in Colorado from 2004 to 2024. This significant loss occurred despite the area being far from direct human activity. It highlights the widespread impact of climate change, especially rising summer temperatures, as a key factor in the decline.
July 2025: A controversy arose over the transfer of 26 rare Spix's macaws, declared extinct in the wild in 2019, to India’s Vantara zoo, run by the philanthropic arm of the Ambani family. While India’s Supreme Court found no legal wrongdoing by the zoo, the birds' journey from Germany, arranged through a deal with the Association for the Conservation of Threatened Parrots (ACTP), caused tension with Brazil. Brazil claims it never agreed to the birds' export.
June 2025: A debate began over using genetic engineering and synthetic biology in conservation. Supporters argue it can help protect endangered species, such as creating disease-resistant frogs or bacteria that can repair reefs. However, critics caution about unknown ecological risks and the irreversible effects of releasing engineered organisms into the wild.
Frequently Asked Questions
How big is the ?
The global biodiversity conservation market is projected to reach $52.8 billion by 2034, with a rapid 9.4% CAGR. Learn how public awareness, corporate ESG, and government initiatives are driving this significant growth.
Who are the major players in the ?
World Wildlife Fund (WWF), The Nature Conservancy (TNC), Conservation International, Wildlife Conservation Society (WCS), BirdLife International, International Union for Conservation of Nature (IUCN), Rainforest Alliance, Fauna & Flora International (FFI), Global Environment Facility (GEF), United Nations Environment Programme (UNEP), National Geographic Society, Air Liquide, Linde plc, Messer Group GmbH, Proton Gases (India) Pvt. Ltd., Air Products and Chemicals, Inc.
Which segments covered the ?
By Service Type (Habitat Restoration, Species Protection, Pollution Control, Sustainable Forestry, Marine Conservation, Others), By End-user (Public Sector, Private Sector, Communities & Local Organizations), By Application (Government Initiatives, Non-Governmental Organizations (NGOs), Corporate Sustainability Programs, Research & Education, Community-Based Conservation)
How can this market research report help my business make strategic decisions?
Our market research reports provide actionable intelligence, including verified market size data, CAGR projections, competitive benchmarking, and segment-level opportunity analysis. These insights support strategic planning, investment decisions, product development, and market entry strategies for enterprises and startups alike.
How frequently is the data updated?
We continuously monitor industry developments and update our reports to reflect regulatory changes, technological advancements, and macroeconomic shifts. Updated editions ensure you receive the latest market intelligence.

 Aerospace And Defence
 Agriculture
 Automotive And Transportation
 Banking And Finance
 Business
 Chemicals And Materials
 Consumer And Retail
 Electronics And Semiconductors
 Food And Beverages
 Machinery & Equipments
 Manufacturing And Construction
 Medical Devices
 Others
 Pharmaceuticals And Healthcare
 Power And Energy
 Sports
 Technology

, By End-Use Sector (Government Initiatives, Non-Governmental Organizations, Corporate Responsibility Initiatives, Community-Based Conservation), Region and Key Players - Industry Segment Overview, Market Dynamics, Competitive Strategies, Trends and Forecast 2025-2034")
, By End-Use Sector (Government Initiatives, Non-Governmental Organizations, Corporate Responsibility Initiatives, Community-Based Conservation), Region and Key Players - Industry Segment Overview, Market Dynamics, Competitive Strategies, Trends and Forecast 2025-2034")
, By End-Use Sector (Government Initiatives, Non-Governmental Organizations, Corporate Responsibility Initiatives, Community-Based Conservation), Region and Key Players - Industry Segment Overview, Market Dynamics, Competitive Strategies, Trends and Forecast 2025-2034")
, By End-Use Sector (Government Initiatives, Non-Governmental Organizations, Corporate Responsibility Initiatives, Community-Based Conservation), Region and Key Players - Industry Segment Overview, Market Dynamics, Competitive Strategies, Trends and Forecast 2025-2034")

