
- Home
- Industries
 Aerospace And Defence
 Agriculture
 Automotive And Transportation
 Banking And Finance
 Business
 Chemicals And Materials
 Consumer And Retail
 Electronics And Semiconductors
 Food And Beverages
 Machinery & Equipments
 Manufacturing And Construction
 Medical Devices
 Others
 Pharmaceuticals And Healthcare
 Power And Energy
 Sports
 Technology
- Services
- News Room
- About us
- Contact Us
-
Biologics Market Size, Share & Growth | 11.4% CAGR
Global Biologics Market Size, Share & Analysis By Product Type (Monoclonal Antibodies, (MABs by Application, MABs by Type), Vaccines, Recombinant Proteins, Antisense & RNAi Therapeutics, Others), By Manufacturing (Outsourced, In-house), By Application (Oncology, Immunology, Infectiuos Disease, Cardiovascular Disorders, Others), By Source (Microbial, Mammalian, Others), Regulatory Landscape, Pipeline Analysis & Forecast 2025–2034

Report Overview
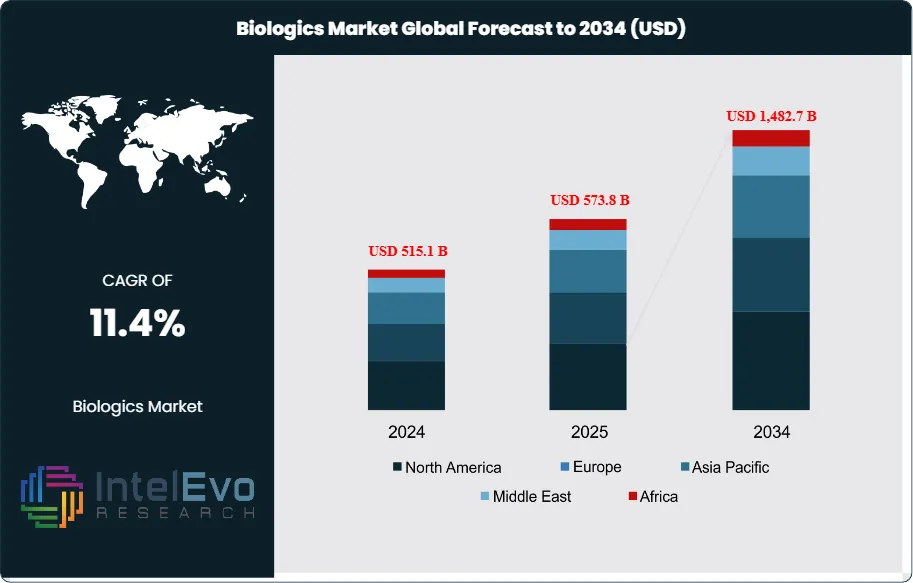
The Biologics market was estimated at USD 515.1 billion in 2024 and is expected to expand to roughly USD 1,482.7 billion by 2034, reflecting an annual growth rate of 11.4% over 2025–2034. This strong outlook reflects a shift in healthcare priorities, as biologics move from a niche category into a central component of treatment strategies. The expansion is being fueled by innovation in therapeutic platforms, supportive regulatory practices, and the pressing need for new options in chronic and complex diseases.
Get More Information about this report -
Request Free Sample ReportA major factor shaping demand is the rising burden of conditions such as cancer, autoimmune disorders, and neurodegenerative diseases. According to the American Cancer Society’s 2025 Cancer Facts & Figures report, the United States alone is projected to see more than 2 million new cancer cases in 2025. Likewise, the Alzheimer’s Association estimates that by 2025, about 7.2 million Americans aged 65 and older could be living with Alzheimer’s disease. These figures illustrate both the growing pressure on healthcare systems and the unique opportunity for biologics to address gaps where conventional drugs provide limited benefit.
The sector’s rapid growth is also tied to technological breakthroughs. The deployment of mRNA-based vaccines, exemplified by Pfizer’s Comirnaty during the COVID-19 pandemic, not only redefined vaccine development but also sparked renewed investment into programs targeting influenza, RSV, and other infectious diseases. Progress in monoclonal antibodies, advanced gene therapies, and companion diagnostics is pushing medicine toward highly tailored solutions that align with a patient’s genetic makeup. At the same time, AI-driven drug discovery and advanced analytics are helping shorten development timelines and improve success rates, reinforcing biologics as a preferred option for next-generation therapies.
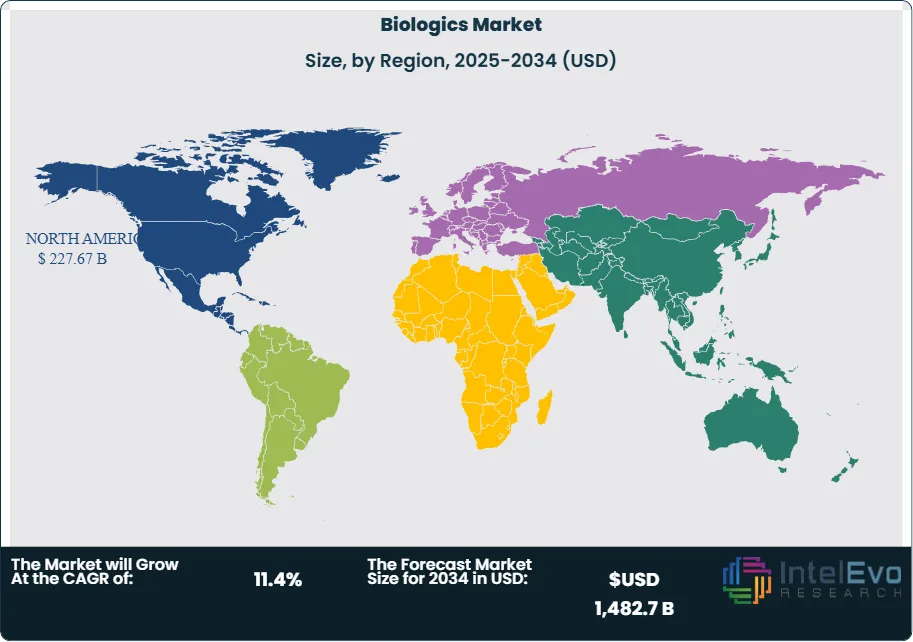
From a geographical perspective, North America retained its leadership position in 2024, generating around USD 225.2 billion and representing 43.8% of global sales. Its dominance is linked to established research ecosystems, extensive investment capacity, and an agile regulatory environment. The FDA’s Center for Biologics Evaluation and Research (CBER) has further accelerated access by offering priority pathways for promising biologics, particularly in the fields of cell and gene therapy.
Europe continues to advance steadily, supported by strong clinical infrastructure and well-defined policies that promote the responsible introduction of biologics and biosimilars. Unlike North America’s faster regulatory accelerators, Europe emphasizes rigorous evaluation while still facilitating adoption.
The Asia-Pacific region has emerged as the fastest-expanding market. Rising healthcare expenditures, a surge in domestic and international clinical trials, and large, diverse patient populations have created favorable conditions for biologics uptake. Governments in markets such as China, India, and South Korea are also implementing initiatives to strengthen biopharmaceutical R&D and manufacturing capacity, positioning the region as a critical hub for future growth.
Together, these developments demonstrate how biologics are reshaping global healthcare. They are redefining therapeutic standards, altering investment priorities, and influencing how regulators, providers, and manufacturers think about treatment delivery for the next decade.
, Vaccines, Recombinant Proteins, Antisense & RNAi Therapeutics, Others), By Manufacturing (Outsourced, In-house), By Application (Oncology, Immunology, Infectiuos Disease, Cardiovascular Disorders, Others), By Source (Microbial, Mammalian, Others), Regulatory Landscape, Pipeline Analysis & Forecast 2025–2034")
Key Takeaways
- Market Growth: The global biologics market was valued at USD 515.1 billion in 2024 and is projected to reach USD 1,482.7 billion by 2034, expanding at a CAGR of 11.4%. Growth is fueled by rising prevalence of chronic diseases, rapid innovation in targeted therapies, and accelerated regulatory approvals.
- Product Type: Monoclonal antibodies remain the leading product category, capturing 47.6% of the market share in 2023. Their dominance stems from widespread use in oncology and immunology, supported by a steady pipeline of FDA and EMA approvals.
- Manufacturing: Outsourced manufacturing accounted for 63.2% of market revenue in 2023, reflecting biopharma companies’ reliance on contract manufacturing organizations (CMOs) to reduce costs, scale production, and accelerate time-to-market.
- Application: Oncology leads the application segment with a 45.5% revenue share, driven by the rising global cancer burden and the success of biologics in immuno-oncology therapies, which are increasingly replacing conventional chemotherapy.
- Source: Microbial-derived biologics held a 38.4% share in 2023, benefiting from cost efficiency, scalability, and their critical role in vaccine and recombinant protein production.
- Driver: Increasing incidence of cancer, autoimmune, and neurological diseases is a primary growth driver; for example, over 2 million new cancer cases are projected in the U.S. in 2025, underscoring the urgent demand for advanced biologics.
- Restraint: High development costs and manufacturing complexities remain a key restraint, with average biologic R&D expenditures surpassing USD 2 billion per product and lengthy clinical timelines limiting smaller players’ entry.
- Opportunity: Asia-Pacific is emerging as the fastest-growing regional market, forecast to expand at a double-digit CAGR through 2034, supported by expanding healthcare infrastructure, clinical trials, and increasing patient access to biologics in China and India.
- Trend: mRNA platforms and gene therapies are reshaping the industry, with successful launches such as Pfizer-BioNTech’s Comirnaty and FDA fast-tracks for cell and gene therapies setting new benchmarks for biologics innovation.
- Regional Analysis: North America led the market with a 43.8% share in 2023, valued at USD 225.2 billion, supported by advanced healthcare infrastructure and strong regulatory frameworks. Europe follows with emphasis on biosimilars adoption, while Asia-Pacific represents the most attractive growth hotspot for future investments.
Type Analysis
High-performance concrete (HPC) continues to represent the most influential category within the global advanced concrete market as of 2025, driven by its superior strength, durability, and resilience under extreme environmental conditions. This type is extensively deployed in large-scale infrastructure projects, including high-rise buildings, bridges, and transportation networks, where long-term performance and reduced maintenance costs are critical. With governments worldwide investing heavily in resilient infrastructure—such as the U.S. Bipartisan Infrastructure Law, which allocates over USD 1 trillion for transportation and construction—demand for HPC is projected to accelerate at a CAGR exceeding 7% through 2032.
Self-consolidating concrete (SCC) is emerging as a high-growth subsegment, valued for its ease of placement, labor cost savings, and ability to reduce formwork defects. SCC adoption is particularly strong in urban construction, where time efficiency and structural precision are crucial. Industry estimates suggest SCC usage in residential and commercial construction projects has grown by more than 15% globally since 2020, and this trend is expected to intensify as contractors seek sustainable, cost-efficient materials. Other specialized concrete types, including fiber-reinforced and lightweight concrete, are gaining momentum in niche applications such as precast components and energy-efficient buildings, collectively broadening the segment’s market potential.
Application Analysis
Pavers dominate application areas, supported by expanding infrastructure development in both developed and emerging economies. With urbanization accelerating—particularly in Asia and Latin America—governments are prioritizing roads, sidewalks, and pedestrian zones, creating robust demand for advanced concrete pavers. For instance, India’s Smart Cities Mission, covering more than 100 cities, is heavily reliant on durable paver materials to modernize urban infrastructure, contributing significantly to market growth.
Retaining walls represent another critical application, particularly in regions prone to soil erosion, flooding, and urban land-use expansion. Rising climate resilience initiatives are encouraging the adoption of durable concrete solutions that ensure long-term stability. According to World Bank estimates, global infrastructure resilience investments need to rise by at least 3–4% annually through 2030, directly boosting demand for high-performance retaining wall materials. Other applications, such as precast blocks, landscaping elements, and modular systems, are also gaining traction, particularly in high-density urban areas seeking sustainable and aesthetic construction solutions.
End-Use Analysis
Residential construction remains a cornerstone of the advanced concrete market, supported by rising housing demand, rapid urbanization, and growing adoption of sustainable building materials. In 2025, global residential building activity accounts for the largest share of demand, particularly in Asia-Pacific and North America, where new housing starts and renovations are driving material adoption. The integration of energy-efficient concrete solutions in green housing projects is further strengthening growth prospects.
The commercial building segment—including office complexes, retail centers, and institutional facilities—is witnessing significant expansion, fueled by investments in smart cities, tourism infrastructure, and education hubs. This segment increasingly favors self-consolidating and fiber-reinforced concrete, owing to their adaptability for complex designs and faster project delivery. Industrial applications, while representing a smaller share, are gaining importance in logistics hubs, manufacturing plants, and renewable energy facilities, where durable and high-performance materials are required to withstand heavy loads and harsh conditions.
Regional Analysis
North America remains a leading market, supported by robust infrastructure investments, stringent building codes, and widespread adoption of advanced construction technologies. The U.S. continues to drive regional demand with large-scale transportation, energy, and urban development projects, while Canada’s infrastructure modernization programs are accelerating use of sustainable concrete materials.
Europe holds a significant share, with demand driven by stringent sustainability regulations and the European Green Deal, which mandates reduced carbon emissions in construction. Countries such as Germany, France, and the UK are adopting advanced concrete solutions for both retrofitting historic structures and building energy-efficient smart cities.
Asia-Pacific, however, represents the fastest-growing region, expected to record double-digit growth through 2032. Rapid urbanization, industrial expansion, and megaprojects in China, India, and Southeast Asia are fueling unprecedented demand for high-performance and self-consolidating concrete. For example, China’s Belt and Road Initiative continues to drive cross-border infrastructure projects requiring large volumes of durable materials.
Latin America and the Middle East & Africa are emerging as secondary growth hubs. In Latin America, urban renewal and affordable housing projects are stimulating adoption, while in the Middle East, large-scale projects such as Saudi Arabia’s NEOM are creating substantial opportunities for advanced concrete types tailored to extreme climatic conditions.
Get More Information about this report -
Request Free Sample ReportMarket Key Segments
By Product Type
- Monoclonal Antibodies
- MABs by Application
- Diagnostic
- Biochemical Analysis
- Diagnostic Imaging
- Therapeutic
- Direct MAB Agents
- Targeting MAB Agents
- Protein Purification
- Others
- MABs by Type
- Murine
- Chimeric
- Humanized
- Human
- Others
- MABs by Application
- Vaccines
- Recombinant Proteins
- Antisense & RNAi Therapeutics
- Others
By Manufacturing
- Outsourced
- In-house
By Application
- Oncology
- Immunology
- Infectiuos Disease
- Cardiovascular Disorders
- Others
By Source
- Microbial
- Mammalian
- Others
Regions
- North America
- Latin America
- East Asia And Pacific
- Sea And South Asia
- Eastern Europe
- Western Europe
- Middle East & Africa
| Report Attribute | Details |
| Market size (2024) | USD 515.1 B |
| Forecast Revenue (2034) | USD 1,482.7 B |
| CAGR (2024-2034) | 11.4% |
| Historical data | 2020-2023 |
| Base Year For Estimation | 2024 |
| Forecast Period | 2025-2034 |
| Report coverage | Revenue Forecast, Competitive Landscape, Market Dynamics, Growth Factors, Trends and Recent Developments |
| Segments covered | By Product Type (Monoclonal Antibodies, (MABs by Application, MABs by Type), Vaccines, Recombinant Proteins, Antisense & RNAi Therapeutics, Others), By Manufacturing (Outsourced, In-house), By Application (Oncology, Immunology, Infectiuos Disease, Cardiovascular Disorders, Others), By Source (Microbial, Mammalian, Others) |
| Research Methodology |
|
| Regional scope |
|
| Competitive Landscape | Amgen Inc, Hoffmann La-Roche Ltd, Eli Lilly and Company, Samsung Biologics, Johnson & Johnson Services, Inc, AbbVie Inc, Celltrion Healthcare Co., Ltd, Bristol-Myers Squibb Company, Sanofi, Novo Nordisk A/S |
| Customization Scope | Customization for segments, region/country-level will be provided. Moreover, additional customization can be done based on the requirements. |
| Pricing and Purchase Options | Avail customized purchase options to meet your exact research needs. We have three licenses to opt for: Single User License, Multi-User License (Up to 5 Users), Corporate Use License (Unlimited User and Printable PDF). |
, Vaccines, Recombinant Proteins, Antisense & RNAi Therapeutics, Others), By Manufacturing (Outsourced, In-house), By Application (Oncology, Immunology, Infectiuos Disease, Cardiovascular Disorders, Others), By Source (Microbial, Mammalian, Others), Regulatory Landscape, Pipeline Analysis & Forecast 2025–2034")
, Vaccines, Recombinant Proteins, Antisense & RNAi Therapeutics, Others), By Manufacturing (Outsourced, In-house), By Application (Oncology, Immunology, Infectiuos Disease, Cardiovascular Disorders, Others), By Source (Microbial, Mammalian, Others), Regulatory Landscape, Pipeline Analysis & Forecast 2025–2034")
, Vaccines, Recombinant Proteins, Antisense & RNAi Therapeutics, Others), By Manufacturing (Outsourced, In-house), By Application (Oncology, Immunology, Infectiuos Disease, Cardiovascular Disorders, Others), By Source (Microbial, Mammalian, Others), Regulatory Landscape, Pipeline Analysis & Forecast 2025–2034")
Frequently Asked Questions
How big is the Biologics Market?
The Biologics Market is projected to grow from USD 515.1 Billion in 2024 to USD 1,482.7 Billion by 2034, registering an 11.4% CAGR. Rising demand for advanced therapies, regulatory support, and breakthroughs in biologic platforms are driving rapid adoption across chronic and complex disease treatment.
Who are the major players in the Biologics Market?
Amgen Inc, Hoffmann La-Roche Ltd, Eli Lilly and Company, Samsung Biologics, Johnson & Johnson Services, Inc, AbbVie Inc, Celltrion Healthcare Co., Ltd, Bristol-Myers Squibb Company, Sanofi, Novo Nordisk A/S
Which segments covered the Biologics Market?
By Product Type (Monoclonal Antibodies, (MABs by Application, MABs by Type), Vaccines, Recombinant Proteins, Antisense & RNAi Therapeutics, Others), By Manufacturing (Outsourced, In-house), By Application (Oncology, Immunology, Infectiuos Disease, Cardiovascular Disorders, Others), By Source (Microbial, Mammalian, Others)
How can this market research report help my business make strategic decisions?
Our market research reports provide actionable intelligence, including verified market size data, CAGR projections, competitive benchmarking, and segment-level opportunity analysis. These insights support strategic planning, investment decisions, product development, and market entry strategies for enterprises and startups alike.
How frequently is the data updated?
We continuously monitor industry developments and update our reports to reflect regulatory changes, technological advancements, and macroeconomic shifts. Updated editions ensure you receive the latest market intelligence.

Select Licence Type
Connect with our sales team
Why IntelEvoResearch
100%
Customer
Satisfaction
24x7+
Availability - we are always
there when you need us
200+
Fortune 50 Companies trust
IntelEvoResearch
80%
of our reports are exclusive
and first in the industry
100%
more data
and analysis
1000+
reports published
till date