The Blended Cement Market size is projected to reach approximately USD 549.82 Billion by 2034, up from USD 356.45 Billion in 2024, growing at a CAGR of 4.5% during the forecast period from 2025 to 2034. This growth is driven by the increasing focus on sustainable construction materials, the rise of green building initiatives, and the widespread use of supplementary cementitious materials (SCMs) like fly ash, slag, and silica fume to reduce carbon emissions. The ongoing urbanization, coupled with strong infrastructure investments in emerging economies and the global push toward low-carbon cement technologies, is expected to reshape the cement industry landscape. The adoption of blended cement is becoming central to environmentally responsible and cost-efficient construction practices worldwide.
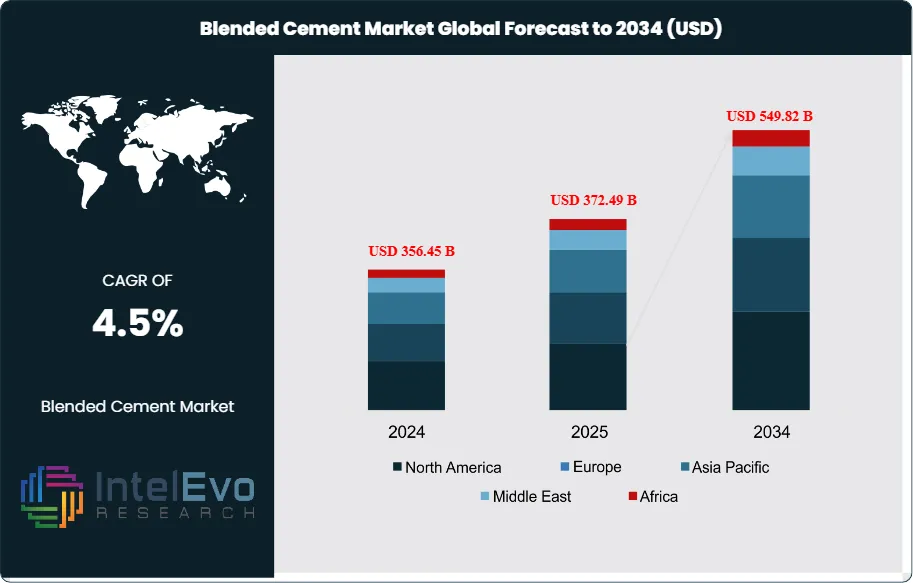
The blended cement market encompasses a variety of cement types mixed with supplementary materials such as fly ash, slag, or pozzolanic materials. This composition enhances performance characteristics such as workability, strength, and environmental sustainability. Blended cements are increasingly being adopted for their durability and low carbon footprint, making them a preferred option for sustainable construction. Rising urbanization, infrastructure projects, and increased demand for energy-efficient building materials are driving the market forward.
Several factors affect the growth of the blended cement market. Environmental regulations encouraging the reduction of carbon emissions and energy consumption in the construction sector have made blended cements more favorable compared to traditional cement. Additionally, growing investments in infrastructure and smart city developments further propel demand. However, market growth is also influenced by fluctuations in raw material availability and supply chain disruptions.
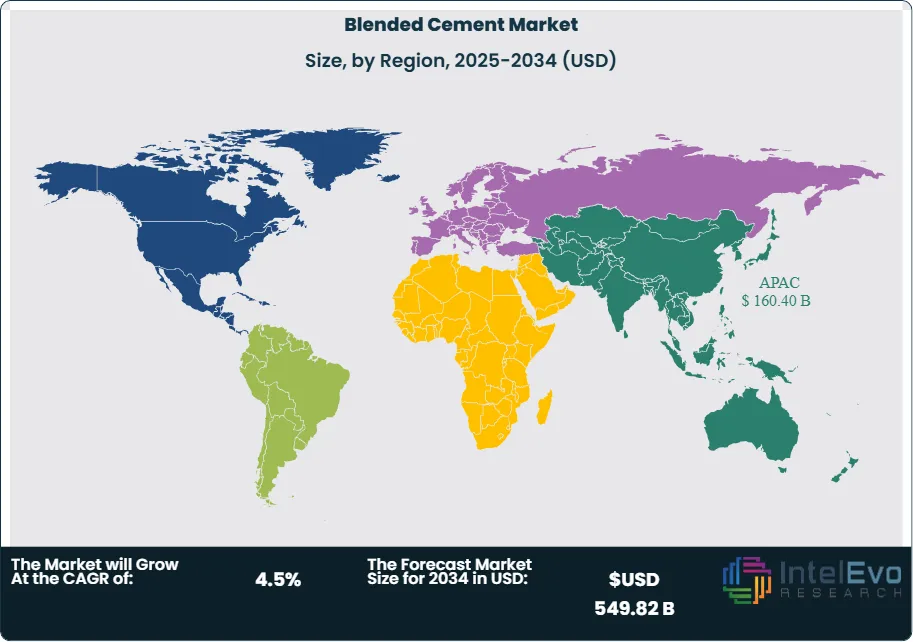
Asia-Pacific holds the largest share of the blended cement market, driven by rapid urban development, government investments in infrastructure, and the growing construction industry in countries such as India and China. Europe and North America are also witnessing significant adoption due to stringent environmental regulations and sustainable building initiatives.
The COVID-19 pandemic caused short-term disruptions in the blended cement market due to halted construction projects, labor shortages, and supply chain interruptions. However, recovery has been swift, supported by resumed infrastructure projects and increased focus on green construction post-pandemic.
Key Takeaways:
Market Growth: The Blended Cement Market is expected to reach USD 549.82 Billion by 2034, driven by sustainability demands and infrastructure development across emerging economies.
Type Dominance: Portland Pozzolana Cement (PPC) leads the type segment due to its high durability, cost-efficiency, and environmental friendliness.
Application Dominance: Cast-in-place construction dominates the application segment, as it allows for flexible on-site concrete work, suitable for large infrastructure projects.
End-User Dominance: Building construction remains the leading end-user industry due to ongoing urbanization and residential projects.
Driver: Growing demand for sustainable construction materials and increased infrastructure spending are key market drivers.
Restraint: Inconsistent availability of raw materials and high initial costs may hinder market growth.
Opportunity: Expansion into emerging economies and innovations in eco-friendly materials present significant opportunities.
Trend: Increased adoption of green building codes and technological advancements in cement manufacturing are key market trends.
Regional Analysis: Asia-Pacific leads due to population growth, urban expansion, and supportive regulations. The PPC segment is expected to see continued growth.
Type Analysis:
Portland Pozzolana Cement (PPC) stands as the dominant type in the blended cement market. Its superiority stems from its excellent resistance to chemical attacks and reduced permeability, making it ideal for hydraulic and marine constructions. PPC also generates less heat during hydration, reducing the risk of thermal cracking. Its eco-friendly composition using fly ash as a key component aligns with global sustainability goals. Composite cement and Portland Slag Cement (PSC) also have significant market shares, but PPC’s cost-effectiveness and compatibility with modern construction techniques place it ahead.
Application Analysis:
Cast-in-place Construction Leads With over 60% Market Share In Blended Cement Market. Cast-in-place construction leads the application segment due to its adaptability and cost-efficiency in large-scale projects. This method enables construction teams to mold cement directly on-site, ensuring greater structural integrity and flexibility. With the rise in infrastructure projects like bridges, highways, and dams, cast-in-place concrete has become essential. Precast construction, while beneficial for rapid development, often lacks the customized fit and durability of cast-in-place methods, giving the latter a competitive edge.
End-User Analysis:
Building construction is the primary consumer of blended cement, driven by urbanization, rising residential needs, and government-backed affordable housing initiatives. Developers are increasingly shifting to blended cement for its durability, thermal insulation, and sustainability, making it an ideal choice for modern buildings. Infrastructure development is also a significant contributor, but it trails building construction in sheer volume and frequency of usage.
Region Analysis:
Asia-Pacific Leads With approximately 45% Market Share In Blended Cement Market, Asia-Pacific is the leading region in the global blended cement market. The dominance is underpinned by large-scale urban infrastructure development in India, China, and Southeast Asia. Governments in the region are investing heavily in highways, smart cities, and housing schemes. Additionally, rising environmental awareness and supportive legislation are fostering the adoption of eco-friendly construction materials, including blended cement. Among the various cement types, Portland Pozzolana Cement (PPC) has gained substantial traction in this region due to its performance in tropical and humid conditions. Building construction is expected to continue its lead in demand, supported by population growth, urban migration, and real estate development. Europe and North America follow Asia-Pacific, driven by green building codes and innovations in cement technology.
By Type (Portland Pozzolana Cement (PPC), Portland Slag Cement (PSC), Fly Ash Blended Cement, Silica Fume Blended Cement, Limestone Blended Cement, Composite cement, Others (Natural Pozzolana, Metakaolin Blends)), By Material Type (Fly Ash, Slag, Silica Fume, Limestone, Others), By Application (Residential Construction, Commercial Construction, Industrial Construction, Infrastructure (Bridges, Roads, Dams), Others (Marine, Tunnel Projects)), By End User (Construction Companies, Ready-Mix Concrete Manufacturers, Infrastructure Developers, Government and Public Works Departments, Real Estate and Contractors)
Research Methodology
Primary Research- 100 Interviews of Stakeholders
Secondary Research
Desk Research
Regional scope
North America (United States, Canada, Mexico)
Latin America (Brazil, Argentina, Columbia)
East Asia And Pacific (China, Japan, South Korea, Australia, Cambodia, Fiji, Indonesia)
Sea And South Asia (India, Singapore, Thailand, Taiwan, Malaysia)
Eastern Europe (Poland, Russia, Czech Republic, Romania)
Western Europe (Germany, U.K., France, Spain, Itlay)
Middle East & Africa (GCC Countries, Egypt, Nigeria, South Africa, Israel)
Competitive Landscape
Ambuja Cements Ltd, Buzzi Unicem SpA, Cement Australia, CEMEX S.A.B DE C.V., Birla Corporation, CRH Plc, Dalmia Bharat Limited, Dyckerhoff, Heidelberg, Holcim, China National Building Material Company Limited, RMC, St. Marys Cement, Anhui Conch Cement Company Limited, UltraTech Cement Limited, Zuari Cements, Adani Group
Customization Scope
Customization for segments, region/country-level will be provided. Moreover, additional customization can be done based on the requirements.
Pricing and Purchase Options
Avail customized purchase options to meet your exact research needs. We have three licenses to opt for: Single User License, Multi-User License (Up to 5 Users), Corporate Use License (Unlimited User and Printable PDF).
TABLE OF CONTENTS
1. EXECUTIVE SUMMARY
1.1. MARKET SNAPSHOT
1.2. KEY FINDINGS & INSIGHTS
1.3. ANALYST RECOMMENDATIONS
1.4. FUTURE OUTLOOK
2. RESEARCH METHODOLOGY
2.1. MARKET DEFINITION & SCOPE
2.2. RESEARCH OBJECTIVES: PRIMARY & SECONDARY DATA SOURCES
2.3. DATA COLLECTION SOURCES
2.3.1. COVERAGE OF 100+ PRIMARY RESEARCH/CONSULTATION CALLS WITH INDUSTRY STAKEHOLDERS
FIGURE 17 NORTH AMERICA BLENDED CEMENT CURRENT AND FUTURE TYPE ANALYSIS, 2025–2034, (USD MILLION)
FIGURE 18 NORTH AMERICA BLENDED CEMENT CURRENT AND FUTURE END USER ANALYSIS, 2025–2034, (USD MILLION)
FIGURE 19 MARKET SHARE BY COUNTRY
FIGURE 20 LATIN AMERICA BLENDED CEMENT CURRENT AND FUTURE TYPE ANALYSIS, 2025–2034, (USD MILLION)
FIGURE 21 LATIN AMERICA BLENDED CEMENT CURRENT AND FUTURE END USER ANALYSIS, 2025–2034, (USD MILLION)
FIGURE 22 MARKET SHARE BY COUNTRY
FIGURE 23 EASTERN EUROPE BLENDED CEMENT CURRENT AND FUTURE TYPE ANALYSIS, 2025–2034, (USD MILLION)
FIGURE 24 EASTERN EUROPE BLENDED CEMENT CURRENT AND FUTURE END USER ANALYSIS, 2025–2034, (USD MILLION)
FIGURE 25 MARKET SHARE BY COUNTRY
FIGURE 26 WESTERN EUROPE BLENDED CEMENT CURRENT AND FUTURE TYPE ANALYSIS, 2025–2034, (USD MILLION)
FIGURE 27 WESTERN EUROPE BLENDED CEMENT CURRENT AND FUTURE END USER ANALYSIS, 2025–2034, (USD MILLION)
FIGURE 28 MARKET SHARE BY COUNTRY
FIGURE 29 EAST ASIA AND PACIFIC BLENDED CEMENT CURRENT AND FUTURE TYPE ANALYSIS, 2025–2034, (USD MILLION)
FIGURE 30 EAST ASIA AND PACIFIC BLENDED CEMENT CURRENT AND FUTURE END USER ANALYSIS, 2025–2034, (USD MILLION)
FIGURE 31 MARKET SHARE BY COUNTRY
FIGURE 32 SEA AND SOUTH ASIA BLENDED CEMENT CURRENT AND FUTURE TYPE ANALYSIS, 2025–2034, (USD MILLION)
FIGURE 33 SEA AND SOUTH ASIA BLENDED CEMENT CURRENT AND FUTURE END USER ANALYSIS, 2025–2034, (USD MILLION)
FIGURE 34 MARKET SHARE BY COUNTRY
FIGURE 35 MIDDLE EAST AND AFRICA BLENDED CEMENT CURRENT AND FUTURE TYPE ANALYSIS, 2025–2034, (USD MILLION)
FIGURE 36 MIDDLE EAST AND AFRICA BLENDED CEMENT CURRENT AND FUTURE END USER ANALYSIS, 2025–2034, (USD MILLION)
FIGURE 37 NORTH AMERICA BLENDED CEMENT CURRENT AND FUTURE MARKET VOLUME SHARE REGIONAL ANALYSIS, 2025–2034, (USD MILLION)
FIGURE 38 U.S. BLENDED CEMENT CURRENT AND FUTURE TYPE ANALYSIS, 2025–2034, (USD MILLION)
FIGURE 39 U.S. BLENDED CEMENT CURRENT AND FUTURE END USER ANALYSIS, 2025–2034, (USD MILLION)
FIGURE 40 CANADA BLENDED CEMENT CURRENT AND FUTURE TYPE ANALYSIS, 2025–2034, (USD MILLION)
FIGURE 41 CANADA BLENDED CEMENT CURRENT AND FUTURE END USER ANALYSIS, 2025–2034, (USD MILLION)
FIGURE 42 LATIN AMERICA BLENDED CEMENT CURRENT AND FUTURE MARKET VOLUME SHARE REGIONAL ANALYSIS, 2025–2034, (USD MILLION)
FIGURE 43 MEXICO BLENDED CEMENT CURRENT AND FUTURE TYPE ANALYSIS, 2025–2034, (USD MILLION)
FIGURE 44 MEXICO BLENDED CEMENT CURRENT AND FUTURE END USER ANALYSIS, 2025–2034, (USD MILLION)
FIGURE 45 BRAZIL BLENDED CEMENT CURRENT AND FUTURE TYPE ANALYSIS, 2025–2034, (USD MILLION)
FIGURE 46 BRAZIL BLENDED CEMENT CURRENT AND FUTURE END USER ANALYSIS, 2025–2034, (USD MILLION)
FIGURE 47 ARGENTINA BLENDED CEMENT CURRENT AND FUTURE TYPE ANALYSIS, 2025–2034, (USD MILLION)
FIGURE 48 ARGENTINA BLENDED CEMENT CURRENT AND FUTURE END USER ANALYSIS, 2025–2034, (USD MILLION)
FIGURE 49 COLUMBIA BLENDED CEMENT CURRENT AND FUTURE TYPE ANALYSIS, 2025–2034, (USD MILLION)
FIGURE 50 COLUMBIA BLENDED CEMENT CURRENT AND FUTURE END USER ANALYSIS, 2025–2034, (USD MILLION)
FIGURE 51 REST OF LATIN AMERICA BLENDED CEMENT CURRENT AND FUTURE TYPE ANALYSIS, 2025–2034, (USD MILLION)
FIGURE 52 REST OF LATIN AMERICA BLENDED CEMENT CURRENT AND FUTURE END USER ANALYSIS, 2025–2034, (USD MILLION)
FIGURE 53 EASTERN EUROPE BLENDED CEMENT CURRENT AND FUTURE MARKET VOLUME SHARE REGIONAL ANALYSIS, 2025–2034, (USD MILLION)
FIGURE 54 POLAND BLENDED CEMENT CURRENT AND FUTURE TYPE ANALYSIS, 2025–2034, (USD MILLION)
FIGURE 55 POLAND BLENDED CEMENT CURRENT AND FUTURE END USER ANALYSIS, 2025–2034, (USD MILLION)
FIGURE 56 RUSSIA BLENDED CEMENT CURRENT AND FUTURE TYPE ANALYSIS, 2025–2034, (USD MILLION)
FIGURE 57 RUSSIA BLENDED CEMENT CURRENT AND FUTURE END USER ANALYSIS, 2025–2034, (USD MILLION)
FIGURE 58 CZECH REPUBLIC BLENDED CEMENT CURRENT AND FUTURE TYPE ANALYSIS, 2025–2034, (USD MILLION)
FIGURE 59 CZECH REPUBLIC BLENDED CEMENT CURRENT AND FUTURE END USER ANALYSIS, 2025–2034, (USD MILLION)
FIGURE 60 ROMANIA BLENDED CEMENT CURRENT AND FUTURE TYPE ANALYSIS, 2025–2034, (USD MILLION)
FIGURE 61 ROMANIA BLENDED CEMENT CURRENT AND FUTURE END USER ANALYSIS, 2025–2034, (USD MILLION)
FIGURE 62 REST OF EASTERN EUROPE BLENDED CEMENT CURRENT AND FUTURE TYPE ANALYSIS, 2025–2034, (USD MILLION)
FIGURE 63 REST OF EASTERN EUROPE BLENDED CEMENT CURRENT AND FUTURE END USER ANALYSIS, 2025–2034, (USD MILLION)
FIGURE 64 WESTERN EUROPE BLENDED CEMENT CURRENT AND FUTURE MARKET VOLUME SHARE REGIONAL ANALYSIS, 2025–2034, (USD MILLION)
FIGURE 65 GERMANY BLENDED CEMENT CURRENT AND FUTURE TYPE ANALYSIS, 2025–2034, (USD MILLION)
FIGURE 66 GERMANY BLENDED CEMENT CURRENT AND FUTURE END USER ANALYSIS, 2025–2034, (USD MILLION)
FIGURE 67 FRANCE BLENDED CEMENT CURRENT AND FUTURE TYPE ANALYSIS, 2025–2034, (USD MILLION)
FIGURE 68 FRANCE BLENDED CEMENT CURRENT AND FUTURE END USER ANALYSIS, 2025–2034, (USD MILLION)
FIGURE 69 UK BLENDED CEMENT CURRENT AND FUTURE TYPE ANALYSIS, 2025–2034, (USD MILLION)
FIGURE 70 UK BLENDED CEMENT CURRENT AND FUTURE END USER ANALYSIS, 2025–2034, (USD MILLION)
FIGURE 71 SPAIN BLENDED CEMENT CURRENT AND FUTURE TYPE ANALYSIS, 2025–2034, (USD MILLION)
FIGURE 72 SPAIN BLENDED CEMENT CURRENT AND FUTURE END USER ANALYSIS, 2025–2034, (USD MILLION)
FIGURE 73 ITALY BLENDED CEMENT CURRENT AND FUTURE TYPE ANALYSIS, 2025–2034, (USD MILLION)
FIGURE 74 ITALY BLENDED CEMENT CURRENT AND FUTURE END USER ANALYSIS, 2025–2034, (USD MILLION)
FIGURE 75 REST OF WESTERN EUROPE BLENDED CEMENT CURRENT AND FUTURE TYPE ANALYSIS, 2025–2034, (USD MILLION)
FIGURE 76 REST OF WESTERN EUROPE BLENDED CEMENT CURRENT AND FUTURE END USER ANALYSIS, 2025–2034, (USD MILLION)
FIGURE 77 EAST ASIA AND PACIFIC BLENDED CEMENT CURRENT AND FUTURE MARKET VOLUME SHARE REGIONAL ANALYSIS, 2025–2034, (USD MILLION)
FIGURE 78 CHINA BLENDED CEMENT CURRENT AND FUTURE TYPE ANALYSIS, 2025–2034, (USD MILLION)
FIGURE 79 CHINA BLENDED CEMENT CURRENT AND FUTURE END USER ANALYSIS, 2025–2034, (USD MILLION)
FIGURE 80 JAPAN BLENDED CEMENT CURRENT AND FUTURE TYPE ANALYSIS, 2025–2034, (USD MILLION)
FIGURE 81 JAPAN BLENDED CEMENT CURRENT AND FUTURE END USER ANALYSIS, 2025–2034, (USD MILLION)
FIGURE 82 AUSTRALIA BLENDED CEMENT CURRENT AND FUTURE TYPE ANALYSIS, 2025–2034, (USD MILLION)
FIGURE 83 AUSTRALIA BLENDED CEMENT CURRENT AND FUTURE END USER ANALYSIS, 2025–2034, (USD MILLION)
FIGURE 84 CAMBODIA BLENDED CEMENT CURRENT AND FUTURE TYPE ANALYSIS, 2025–2034, (USD MILLION)
FIGURE 85 CAMBODIA BLENDED CEMENT CURRENT AND FUTURE END USER ANALYSIS, 2025–2034, (USD MILLION)
FIGURE 86 FIJI BLENDED CEMENT CURRENT AND FUTURE TYPE ANALYSIS, 2025–2034, (USD MILLION)
FIGURE 87 FIJI BLENDED CEMENT CURRENT AND FUTURE END USER ANALYSIS, 2025–2034, (USD MILLION)
FIGURE 88 INDONESIA BLENDED CEMENT CURRENT AND FUTURE TYPE ANALYSIS, 2025–2034, (USD MILLION)
FIGURE 89 INDONESIA BLENDED CEMENT CURRENT AND FUTURE END USER ANALYSIS, 2025–2034, (USD MILLION)
FIGURE 90 SOUTH KOREA BLENDED CEMENT CURRENT AND FUTURE TYPE ANALYSIS, 2025–2034, (USD MILLION)
FIGURE 91 SOUTH KOREA BLENDED CEMENT CURRENT AND FUTURE END USER ANALYSIS, 2025–2034, (USD MILLION)
FIGURE 92 REST OF EAST ASIA AND PACIFIC BLENDED CEMENT CURRENT AND FUTURE TYPE ANALYSIS, 2025–2034, (USD MILLION)
FIGURE 93 REST OF EAST ASIA AND PACIFIC BLENDED CEMENT CURRENT AND FUTURE END USER ANALYSIS, 2025–2034, (USD MILLION)
FIGURE 94 SEA AND SOUTH ASIA BLENDED CEMENT CURRENT AND FUTURE MARKET VOLUME SHARE REGIONAL ANALYSIS, 2025–2034, (USD MILLION)
FIGURE 95 BANGLADESH BLENDED CEMENT CURRENT AND FUTURE TYPE ANALYSIS, 2025–2034, (USD MILLION)
FIGURE 96 BANGLADESH BLENDED CEMENT CURRENT AND FUTURE END USER ANALYSIS, 2025–2034, (USD MILLION)
FIGURE 97 NEW ZEALAND BLENDED CEMENT CURRENT AND FUTURE TYPE ANALYSIS, 2025–2034, (USD MILLION)
FIGURE 98 NEW ZEALAND BLENDED CEMENT CURRENT AND FUTURE END USER ANALYSIS, 2025–2034, (USD MILLION)
FIGURE 99 INDIA BLENDED CEMENT CURRENT AND FUTURE TYPE ANALYSIS, 2025–2034, (USD MILLION)
FIGURE 100 INDIA BLENDED CEMENT CURRENT AND FUTURE END USER ANALYSIS, 2025–2034, (USD MILLION)
FIGURE 101 SINGAPORE BLENDED CEMENT CURRENT AND FUTURE TYPE ANALYSIS, 2025–2034, (USD MILLION)
FIGURE 102 SINGAPORE BLENDED CEMENT CURRENT AND FUTURE END USER ANALYSIS, 2025–2034, (USD MILLION)
FIGURE 103 THAILAND BLENDED CEMENT CURRENT AND FUTURE TYPE ANALYSIS, 2025–2034, (USD MILLION)
FIGURE 104 THAILAND BLENDED CEMENT CURRENT AND FUTURE END USER ANALYSIS, 2025–2034, (USD MILLION)
FIGURE 105 TAIWAN BLENDED CEMENT CURRENT AND FUTURE TYPE ANALYSIS, 2025–2034, (USD MILLION)
FIGURE 106 TAIWAN BLENDED CEMENT CURRENT AND FUTURE END USER ANALYSIS, 2025–2034, (USD MILLION)
FIGURE 107 MALAYSIA BLENDED CEMENT CURRENT AND FUTURE TYPE ANALYSIS, 2025–2034, (USD MILLION)
FIGURE 108 MALAYSIA BLENDED CEMENT CURRENT AND FUTURE END USER ANALYSIS, 2025–2034, (USD MILLION)
FIGURE 109 REST OF SEA AND SOUTH ASIA BLENDED CEMENT CURRENT AND FUTURE TYPE ANALYSIS, 2025–2034, (USD MILLION)
FIGURE 110 REST OF SEA AND SOUTH ASIA BLENDED CEMENT CURRENT AND FUTURE END USER ANALYSIS, 2025–2034, (USD MILLION)
FIGURE 111 MIDDLE EAST AND AFRICA BLENDED CEMENT CURRENT AND FUTURE MARKET VOLUME SHARE REGIONAL ANALYSIS, 2025–2034, (USD MILLION)
FIGURE 112 GCC COUNTRIES BLENDED CEMENT CURRENT AND FUTURE TYPE ANALYSIS, 2025–2034, (USD MILLION)
FIGURE 113 GCC COUNTRIES BLENDED CEMENT CURRENT AND FUTURE END USER ANALYSIS, 2025–2034, (USD MILLION)
FIGURE 114 SAUDI ARABIA BLENDED CEMENT CURRENT AND FUTURE TYPE ANALYSIS, 2025–2034, (USD MILLION)
FIGURE 115 SAUDI ARABIA BLENDED CEMENT CURRENT AND FUTURE END USER ANALYSIS, 2025–2034, (USD MILLION)
FIGURE 116 UAE BLENDED CEMENT CURRENT AND FUTURE TYPE ANALYSIS, 2025–2034, (USD MILLION)
FIGURE 117 UAE BLENDED CEMENT CURRENT AND FUTURE END USER ANALYSIS, 2025–2034, (USD MILLION)
FIGURE 118 BAHRAIN BLENDED CEMENT CURRENT AND FUTURE TYPE ANALYSIS, 2025–2034, (USD MILLION)
FIGURE 119 BAHRAIN BLENDED CEMENT CURRENT AND FUTURE END USER ANALYSIS, 2025–2034, (USD MILLION)
FIGURE 120 KUWAIT BLENDED CEMENT CURRENT AND FUTURE TYPE ANALYSIS, 2025–2034, (USD MILLION)
FIGURE 121 KUWAIT BLENDED CEMENT CURRENT AND FUTURE END USER ANALYSIS, 2025–2034, (USD MILLION)
FIGURE 122 OMAN BLENDED CEMENT CURRENT AND FUTURE TYPE ANALYSIS, 2025–2034, (USD MILLION)
FIGURE 123 OMAN BLENDED CEMENT CURRENT AND FUTURE END USER ANALYSIS, 2025–2034, (USD MILLION)
FIGURE 124 QATAR BLENDED CEMENT CURRENT AND FUTURE TYPE ANALYSIS, 2025–2034, (USD MILLION)
FIGURE 125 QATAR BLENDED CEMENT CURRENT AND FUTURE END USER ANALYSIS, 2025–2034, (USD MILLION)
FIGURE 126 EGYPT BLENDED CEMENT CURRENT AND FUTURE TYPE ANALYSIS, 2025–2034, (USD MILLION)
FIGURE 127 EGYPT BLENDED CEMENT CURRENT AND FUTURE END USER ANALYSIS, 2025–2034, (USD MILLION)
FIGURE 128 NIGERIA BLENDED CEMENT CURRENT AND FUTURE TYPE ANALYSIS, 2025–2034, (USD MILLION)
FIGURE 129 NIGERIA BLENDED CEMENT CURRENT AND FUTURE END USER ANALYSIS, 2025–2034, (USD MILLION)
FIGURE 130 SOUTH AFRICA BLENDED CEMENT CURRENT AND FUTURE TYPE ANALYSIS, 2025–2034, (USD MILLION)
FIGURE 131 SOUTH AFRICA BLENDED CEMENT CURRENT AND FUTURE END USER ANALYSIS, 2025–2034, (USD MILLION)
FIGURE 132 ISRAEL BLENDED CEMENT CURRENT AND FUTURE TYPE ANALYSIS, 2025–2034, (USD MILLION)
FIGURE 133 ISRAEL BLENDED CEMENT CURRENT AND FUTURE END USER ANALYSIS, 2025–2034, (USD MILLION)
FIGURE 134 REST OF MEA BLENDED CEMENT CURRENT AND FUTURE TYPE ANALYSIS, 2025–2034, (USD MILLION)
FIGURE 135 REST OF MEA BLENDED CEMENT CURRENT AND FUTURE END USER ANALYSIS, 2025–2034, (USD MILLION)
FIGURE 136 U. S. MARKET SHARE ANALYSIS BY TYPE (2024)
FIGURE 137 U. S. MARKET SHARE ANALYSIS BY END USER (2024)
FIGURE 138 CANADA MARKET SHARE ANALYSIS BY TYPE (2024)
FIGURE 139 CANADA MARKET SHARE ANALYSIS BY END USER (2024)
FIGURE 140 MEXICO MARKET SHARE ANALYSIS BY TYPE (2024)
FIGURE 141 MEXICO MARKET SHARE ANALYSIS BY END USER (2024)
FIGURE 142 CHINA MARKET SHARE ANALYSIS BY TYPE (2024)
FIGURE 143 CHINA MARKET SHARE ANALYSIS BY END USER (2024)
FIGURE 144 JAPAN MARKET SHARE ANALYSIS BY TYPE (2024)
FIGURE 145 JAPAN MARKET SHARE ANALYSIS BY END USER (2024)
FIGURE 146 INDIA MARKET SHARE ANALYSIS BY TYPE (2024)
FIGURE 147 INDIA MARKET SHARE ANALYSIS BY END USER (2024)
FIGURE 148 SOUTH KOREA MARKET SHARE ANALYSIS BY TYPE (2024)
FIGURE 149 SOUTH KOREA MARKET SHARE ANALYSIS BY END USER (2024)
FIGURE 150 SAUDI ARABIA MARKET SHARE ANALYSIS BY TYPE (2024)
FIGURE 151 SAUDI ARABIA MARKET SHARE ANALYSIS BY END USER (2024)
FIGURE 152 UAE MARKET SHARE ANALYSIS BY TYPE (2024)
FIGURE 153 UAE MARKET SHARE ANALYSIS BY END USER (2024)
FIGURE 154 EGYPT MARKET SHARE ANALYSIS BY TYPE (2024)
FIGURE 155 EGYPT MARKET SHARE ANALYSIS BY END USER (2024)
FIGURE 156 NIGERIA MARKET SHARE ANALYSIS BY TYPE (2024)
FIGURE 157 NIGERIA MARKET SHARE ANALYSIS BY END USER (2024)
FIGURE 158 SOUTH AFRICA MARKET SHARE ANALYSIS BY TYPE (2024)
FIGURE 159 SOUTH AFRICA MARKET SHARE ANALYSIS BY END USER (2024)
FIGURE 160 GERMANY MARKET SHARE ANALYSIS BY TYPE (2024)
FIGURE 161 GERMANY MARKET SHARE ANALYSIS BY END USER (2024)
FIGURE 162 FRANCE MARKET SHARE ANALYSIS BY TYPE (2024)
FIGURE 163 FRANCE MARKET SHARE ANALYSIS BY END USER (2024)
FIGURE 164 UK MARKET SHARE ANALYSIS BY TYPE (2024)
FIGURE 165 UK MARKET SHARE ANALYSIS BY END USER (2024)
FIGURE 166 SPAIN MARKET SHARE ANALYSIS BY TYPE (2024)
FIGURE 167 SPAIN MARKET SHARE ANALYSIS BY END USER (2024)
FIGURE 168 ITALY MARKET SHARE ANALYSIS BY TYPE (2024)
FIGURE 169 ITALY MARKET SHARE ANALYSIS BY END USER (2024)
FIGURE 170 BRAZIL MARKET SHARE ANALYSIS BY TYPE (2024)
FIGURE 171 BRAZIL MARKET SHARE ANALYSIS BY END USER (2024)
FIGURE 172 ARGENTINA MARKET SHARE ANALYSIS BY TYPE (2024)
FIGURE 173 ARGENTINA MARKET SHARE ANALYSIS BY END USER (2024)
FIGURE 174 COLUMBIA MARKET SHARE ANALYSIS BY TYPE (2024)
FIGURE 175 COLUMBIA MARKET SHARE ANALYSIS BY END USER (2024)
FIGURE 176 GLOBAL BLENDED CEMENT CURRENT AND FUTURE MARKET KEY COUNTRY LEVEL ANALYSIS, 2024–2034, (USD MILLION)
FIGURE 177 FINANCIAL OVERVIEW:
Key Players Analysis:
UltraTech Cement Limited
UltraTech is a leading player in the blended cement market, with a strong presence in India and growing international influence. The company has heavily invested in sustainability, with significant portions of its product portfolio composed of PPC and PSC. Its vast manufacturing network and technological innovations enable it to meet high-volume demands efficiently. UltraTech’s initiatives towards carbon neutrality and green construction enhance its leadership position in the market.
Holcim: Holcim is a global cement giant with operations spanning across continents. The company has positioned itself as a leader in sustainable construction, emphasizing innovation in blended cement technologies. Holcim’s products are widely used in both infrastructure and residential sectors. Through strategic acquisitions and R&D investment, Holcim continues to expand its influence in emerging and developed markets alike.
CEMEX S.A.B. de C.V.: CEMEX is another major player known for its extensive product range and commitment to environmental stewardship. The company has developed advanced blended cement formulations tailored for various climatic and structural conditions. CEMEX's strong global distribution network, combined with its innovation-driven approach, makes it a key influencer in the market.
Heidelberg Materials: Heidelberg is a prominent European player with a growing footprint in Asia and Africa. The company leverages advanced manufacturing technologies and sustainability-focused R&D to enhance its blended cement offerings. With a strong presence in infrastructure and commercial construction, Heidelberg continues to expand its market share through strategic partnerships and acquisitions.
Ambuja Cements Ltd: A subsidiary of Holcim, Ambuja Cements is a significant player in the Indian market. The company emphasizes green practices and has a wide array of blended cement products, particularly PPC. Ambuja’s focus on energy efficiency and water conservation in manufacturing processes strengthens its brand image and market leadership.
Market Key Players
Ambuja Cements Ltd
Buzzi Unicem SpA
Cement Australia
CEMEX S.A.B DE C.V.
Birla Corporation
CRH Plc
Dalmia Bharat Limited
Dyckerhoff
Heidelberg
Holcim
China National Building Material Company Limited
RMC
St. Marys Cement
Anhui Conch Cement Company Limited
UltraTech Cement Limited
Zuari Cements
Adani Group
Driver:
Demand for Sustainable Construction Materials:
Environmental sustainability is increasingly influencing the materials used in construction. Governments and builders alike are seeking solutions that reduce carbon footprints without compromising on strength and durability. Blended cement fits this need perfectly. By incorporating supplementary materials like fly ash, slag, and natural pozzolana, blended cement reduces the reliance on clinker, thereby significantly cutting down CO2 emissions. This not only aligns with global environmental goals but also results in cost savings during production. Moreover, the use of waste byproducts promotes circular economy principles, which are being strongly endorsed worldwide. As green building certifications become mandatory in many jurisdictions, the shift towards blended cement is expected to accelerate.
Increased Infrastructure Investments:
Massive investments in infrastructure—especially in developing economies—are acting as a catalyst for blended cement adoption. Governments are prioritizing public projects such as bridges, airports, and transportation networks, all of which require high-performance concrete. Blended cements, known for their enhanced durability and resistance to aggressive environmental conditions, are ideal for such uses. These long-term infrastructure projects also benefit from the cost-effectiveness of blended cement. With international funding agencies now requiring sustainability metrics for project approval, the relevance of blended cement continues to grow. As a result, demand from this sector is projected to rise steadily.
Restrain:
Inconsistent Raw Material Supply:
The production of blended cement relies heavily on supplementary materials like fly ash and slag, which are byproducts of thermal power plants and steel manufacturing. Fluctuations in the availability of these materials due to reduced industrial activity or regulatory restrictions can disrupt production schedules. In regions where such byproducts are scarce or inconsistent in quality, cement manufacturers face challenges maintaining consistent product standards. This uncertainty impacts both pricing and supply reliability, making it difficult for suppliers to fulfill large-scale project requirements on time.
Higher Initial Costs:
Although blended cement offers long-term savings through durability and lower maintenance, the initial cost can be higher due to processing and blending requirements. Advanced manufacturing facilities are often needed to ensure uniform mixing and quality control, which adds to capital investment. Small- and medium-scale builders in developing regions might find the cost difference significant, leading them to choose traditional Ordinary Portland Cement (OPC) over blended alternatives. Educating stakeholders about the life-cycle cost benefits is essential to overcoming this barrier.
Opportunities:
Expansion into Emerging Economies:
Emerging markets in Africa, Latin America, and Southeast Asia present untapped opportunities for blended cement manufacturers. These regions are undergoing urbanization and industrialization, creating a fertile ground for construction-related products. Governments are actively promoting sustainable development, providing incentives for environmentally friendly construction materials. Establishing local manufacturing units in these regions can significantly reduce logistics costs and improve market penetration. Companies investing early in these regions will benefit from first-mover advantages and long-term growth potential.
Innovation in Eco-Friendly Cement Solutions:
Research and development in low-carbon cement alternatives present a significant growth avenue. New compositions utilizing industrial and agricultural waste such as rice husk ash and silica fume are being developed to enhance the performance and sustainability of blended cement. Additionally, integration with technologies like carbon capture and storage (CCS) is being explored to further minimize emissions. Innovators who succeed in commercializing such advanced cement formulations will have a competitive edge in a market increasingly governed by environmental standards.
Trends:
Rise in Green Building Certifications:
Global building standards are evolving to prioritize sustainability, with green certifications like LEED, BREEAM, and IGBC becoming essential for both residential and commercial construction. These certifications incentivize the use of materials that contribute to lower energy consumption, waste reduction, and environmental impact. Blended cement, due to its lower clinker content and improved life cycle performance, is becoming a favored choice. As green buildings shift from niche to mainstream, the market for blended cement is expected to grow proportionally.
Technological Advancements in Manufacturing:
The blended cement industry is experiencing technological advancements aimed at improving quality control, efficiency, and environmental compliance. Automation in mixing and packaging, real-time monitoring of cement properties, and energy-efficient kilns are some innovations transforming production. These advancements not only ensure product consistency but also help in minimizing waste and emissions. Manufacturers adopting smart technologies are better positioned to meet regulatory demands and customer expectations, thereby gaining a competitive advantage.
Recent Development:
In January 2025: Unique Cement Industries Ltd (UCIL), based in Bangladesh, has introduced a new blended product called Dhalai Special Cement to the local market. According to the company, this cement provides 25% greater strength than traditional PCC cements, making it especially well-suited for use in casting roofs, floors, columns, and beams.
In December 2024: India’s Ambuja Cements (ABUJ.NS) announced on Tuesday that it will merge two of its recently acquired subsidiaries into the main company. This move is aimed at streamlining the Adani Group’s cement operations and reducing compliance complexities. Ambuja completed the acquisition of Penna Cement for $1.25 billion in June and had earlier secured a majority stake in Sanghi Industries (SNGI.NS) last year.