Global Blockchain in Supply Chain and Logistics Market Size, Share, Analysis Report By Application (Smart Contracts, Supply Chain Management, Inventory Management, Payment Processing), Component (Platform, Services, Hardware), End-Use Industry (Retail, Manufacturing, Food and Beverage, Pharmaceuticals, Logistics Service Providers), Region and Key Players - Industry Segment Overview, Market Dynamics, Competitive Strategies, Trends and Forecast 2025-2034
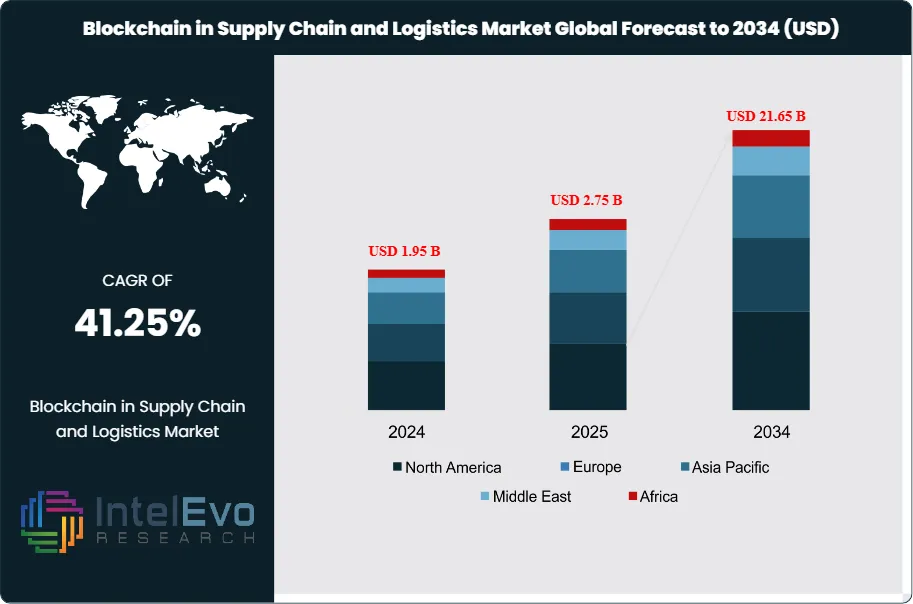
The Blockchain in Supply Chain and Logistics Market size is expected to be worth around USD 21.65 billion by 2034, up from USD 1.95 billion in 2024, growing at a CAGR of 41.25% during the forecast period from 2024 to 2034. This robust growth is primarily fueled by the increasing demand for greater transparency and security in supply chain operations. The distributed ledger technology offered by blockchain enables all participants to have a single, immutable source of truth for transactions, which significantly reduces fraud and enhances accountability. Additionally, the automation of processes through smart contracts is streamlining logistics, lowering costs, and accelerating delivery times.
Blockchain technology enables real-time tracking of goods, automates processes through smart contracts, and enhances collaboration among supply chain participants. This increased visibility helps mitigate risks such as fraud, counterfeiting, and inefficiencies caused by lack of information sharing. Key sectors driving the adoption of blockchain in supply chains include retail, manufacturing, food and beverage, pharmaceuticals, and logistics service providers. As companies increasingly recognize the benefits of blockchain—such as improved security, reduced operational costs, and enhanced compliance with regulations—the technology is being integrated into various aspects of supply chain management. However, challenges such as regulatory uncertainties, high implementation costs, and a shortage of skilled professionals remain hurdles to widespread adoption.
The Blockchain in Supply Chain and Logistics Market is experiencing rapid growth, driven by several key factors. Increasing demand for transparency in supply chains is a primary driver, as businesses seek to enhance trust among stakeholders through secure and immutable record-keeping provided by blockchain technology. Additionally, the need for operational efficiency is pushing organizations to adopt blockchain solutions that automate processes via smart contracts, reducing the need for intermediaries and minimizing errors. Regulatory compliance is another significant driver, as stricter government regulations regarding traceability and sustainability compel companies to implement reliable tracking systems.
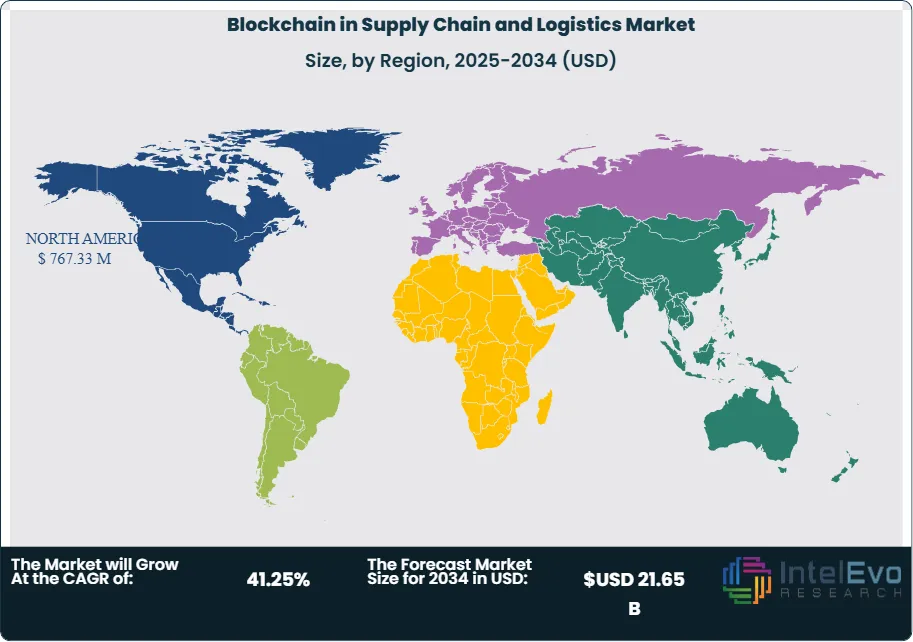
Geographically, North America is expected to dominate the market due to early adoption of blockchain technologies and substantial investments in logistics and supply chain management. Europe follows closely, with significant growth driven by EU initiatives promoting supply chain transparency. The Asia-Pacific region is projected to witness the highest growth rate, fueled by rapid industrialization and increasing investments in technology.
The COVID-19 pandemic has had a profound impact on the market, initially disrupting global supply chains and highlighting their vulnerabilities. However, this disruption has accelerated interest in blockchain solutions that enhance visibility and traceability. As companies aim to recover from pandemic-related challenges, there has been an uptick in investments toward digital transformation initiatives, including blockchain technology.
Key Takeaways
Market Growth: The Blockchain in Supply Chain and Logistics Market is projected to experience substantial growth, with an estimated market size of approximately USD 21.65 billion by 2034, up from USD 1.95 billion in 2024, reflecting a remarkable CAGR of 41.25% during the forecast period. This growth is driven by the increasing demand for transparency and efficiency in supply chain operations.
Application Dominance: Supply chain management applications are expected to dominate the market, as organizations increasingly seek to leverage blockchain technology for real-time tracking, enhanced transparency, and improved inventory management. Smart contracts are also gaining traction as a means to automate transactions and agreements between parties.
Component Dominance: The platform component is anticipated to hold the largest share of the market, driven by the need for robust blockchain solutions that facilitate secure transactions and data sharing among supply chain participants. Services related to integration and maintenance are also critical for supporting blockchain implementation.
End-Use Sector Preference: The retail and manufacturing sectors are likely to be the primary adopters of blockchain technology, utilizing it to enhance operational efficiency, streamline processes, and improve traceability throughout their supply chains. The food and beverage industry is also increasingly adopting blockchain for tracking product provenance and ensuring safety.
Driver: Key drivers of this market include heightened demand for transparency in supply chains, operational efficiency through automation, and regulatory compliance requirements that necessitate reliable tracking systems. The need to combat counterfeiting and fraud is also pushing organizations toward adopting blockchain solutions.
Restraint: Despite its potential, the market faces several restraints, including high implementation costs associated with deploying blockchain technology, regulatory uncertainties that can complicate adoption, and a shortage of skilled professionals who can effectively manage these systems.
Opportunity: Significant opportunities exist in emerging markets, particularly in Asia-Pacific, where rapid industrialization and increasing investments in technology present growth potential. Additionally, the integration of blockchain with other technologies such as IoT and AI offers new avenues for enhancing supply chain efficiency.
Trend: A notable trend is the growing emphasis on sustainability within supply chains. Companies are increasingly looking to blockchain not only for operational improvements but also for enhancing their sustainability practices by providing transparent tracking of sustainable sourcing.
Regional Analysis: North America is expected to lead the market due to early adoption of blockchain technologies and substantial investments in logistics and supply chain management. However, the Asia-Pacific region is projected to witness the highest growth rate as businesses recognize the benefits of blockchain for optimizing supply chain operations amidst rapid industrialization.
Application Analysis:
Supply Chain Management application is expected to dominate the market, with a projected CAGR of 45.21%. The increasing demand for transparency and efficiency drives organizations to adopt blockchain solutions for real-time tracking and enhanced inventory management. Smart Contracts anticipated to grow at a CAGR of 32%, smart contracts automate agreements between parties, reducing transaction times and costs. This application is gaining traction as businesses recognize the benefits of automation in supply chain processes.
Component Analysis:
Platform is expected to hold the largest share of the market, this component is projected to grow at a CAGR of 32.45%, driven by demand for robust blockchain solutions that facilitate secure transactions and data sharing. Consulting and integration services are crucial for supporting blockchain implementation, with a CAGR of approximately 41%, reflecting the growing need for expertise in deploying blockchain solutions effectively.
End-Use Industry Analysis:
Retail sector is likely to be a significant adopter of blockchain technology, focusing on enhancing supply chain transparency and customer trust, with a projected CAGR of 35.23%. The manufacturing industry will also see substantial adoption due to the need for efficient operations and quality control, with a projected CAGR of 23%.
Regional Analysis:
North America Leads with 39.35% Market Share In Blockchain in Supply Chain and Logistics Market: North America is expected to lead the blockchain market, driven by early adoption of blockchain technologies and substantial investments in logistics and supply chain management. The region's robust healthcare sector, coupled with advancements in aerospace technologies, positions it as a significant consumer of blockchain solutions. The projected CAGR for North America is around 39.35%, reflecting strong demand for enhanced transparency and efficiency in supply chains.
The Asia-Pacific region is anticipated to witness the highest growth rate, estimated at 27.5% CAGR, due to rapid industrialization and increasing investments in technology. Countries like China and India are significant contributors, with rising demand for blockchain applications in various sectors, including retail, manufacturing, and logistics. The growing emphasis on improving supply chain resilience amid evolving market conditions further fuels this growth. Europe holds a substantial share of the market, characterized by advanced manufacturing capabilities and a strong healthcare infrastructure. The region is expected to grow at a CAGR of approximately 31.43%, driven by regulatory initiatives promoting transparency in supply chains. Key players in countries like Germany, France, and the UK are increasingly adopting blockchain solutions to enhance operational efficiency and compliance.
By Component (Platform, Services, Hardware), By Deployment Type (Public Blockchain, Private Blockchain, Consortium/Hybrid Blockchain), By End-Use Industry (Retail & E-commerce, Food & Beverages, Pharmaceuticals & Healthcare, Manufacturing, Transportation & Logistics, Others), By Application (Smart Contracts, Supply Chain Management, Inventory Management, Product Tracking & Tracing, Payment & Settlement)
Research Methodology
Primary Research- 100 Interviews of Stakeholders
Secondary Research
Desk Research
Regional scope
North America (United States, Canada, Mexico)
Latin America (Brazil, Argentina, Columbia)
East Asia And Pacific (China, Japan, South Korea, Australia, Cambodia, Fiji, Indonesia)
Sea And South Asia (India, Singapore, Thailand, Taiwan, Malaysia)
Eastern Europe (Poland, Russia, Czech Republic, Romania)
Western Europe (Germany, U.K., France, Spain, Itlay)
Middle East & Africa (GCC Countries, Egypt, Nigeria, South Africa, Israel)
Competitive Landscape
IBM Corporation, Oracle Corporation, Microsoft Corporation, SAP SE, Accenture plc, Amazon Web Services (AWS), Infosys Limited, TIBCO Software Inc., Capgemini SE, DHL International GmbH, FedEx Corporation, Maersk (TradeLens Platform), Huawei Technologies Co., Ltd., BlockApps Inc., VeChain Foundation, OpenText Corporation, Wipro Limited, Insolar Technologies, Chronicled Inc., Skuchain Inc., R3 Corda, Hyperledger, Waltonchain, Modum
Customization Scope
Customization for segments, region/country-level will be provided. Moreover, additional customization can be done based on the requirements.
Pricing and Purchase Options
Avail customized purchase options to meet your exact research needs. We have three licenses to opt for: Single User License, Multi-User License (Up to 5 Users), Corporate Use License (Unlimited User and Printable PDF).
TABLE OF CONTENTS
1. EXECUTIVE SUMMARY
1.1. MARKET SNAPSHOT
1.2. KEY FINDINGS & INSIGHTS
1.3. ANALYST RECOMMENDATIONS
1.4. FUTURE OUTLOOK
2. RESEARCH METHODOLOGY
2.1. MARKET DEFINITION & SCOPE
2.2. RESEARCH OBJECTIVES: PRIMARY & SECONDARY DATA SOURCES
2.3. DATA COLLECTION SOURCES
2.3.1. COVERAGE OF 100+ PRIMARY RESEARCH/CONSULTATION CALLS WITH INDUSTRY STAKEHOLDERS
FIGURE 17 NORTH AMERICA BLOCKCHAIN IN SUPPLY CHAIN AND LOGISTICS CURRENT AND FUTURE TYPE ANALYSIS, 2025–2034, (USD MILLION)
FIGURE 18 NORTH AMERICA BLOCKCHAIN IN SUPPLY CHAIN AND LOGISTICS CURRENT AND FUTURE END USER ANALYSIS, 2025–2034, (USD MILLION)
FIGURE 19 MARKET SHARE BY COUNTRY
FIGURE 20 LATIN AMERICA BLOCKCHAIN IN SUPPLY CHAIN AND LOGISTICS CURRENT AND FUTURE TYPE ANALYSIS, 2025–2034, (USD MILLION)
FIGURE 21 LATIN AMERICA BLOCKCHAIN IN SUPPLY CHAIN AND LOGISTICS CURRENT AND FUTURE END USER ANALYSIS, 2025–2034, (USD MILLION)
FIGURE 22 MARKET SHARE BY COUNTRY
FIGURE 23 EASTERN EUROPE BLOCKCHAIN IN SUPPLY CHAIN AND LOGISTICS CURRENT AND FUTURE TYPE ANALYSIS, 2025–2034, (USD MILLION)
FIGURE 24 EASTERN EUROPE BLOCKCHAIN IN SUPPLY CHAIN AND LOGISTICS CURRENT AND FUTURE END USER ANALYSIS, 2025–2034, (USD MILLION)
FIGURE 25 MARKET SHARE BY COUNTRY
FIGURE 26 WESTERN EUROPE BLOCKCHAIN IN SUPPLY CHAIN AND LOGISTICS CURRENT AND FUTURE TYPE ANALYSIS, 2025–2034, (USD MILLION)
FIGURE 27 WESTERN EUROPE BLOCKCHAIN IN SUPPLY CHAIN AND LOGISTICS CURRENT AND FUTURE END USER ANALYSIS, 2025–2034, (USD MILLION)
FIGURE 28 MARKET SHARE BY COUNTRY
FIGURE 29 EAST ASIA AND PACIFIC BLOCKCHAIN IN SUPPLY CHAIN AND LOGISTICS CURRENT AND FUTURE TYPE ANALYSIS, 2025–2034, (USD MILLION)
FIGURE 30 EAST ASIA AND PACIFIC BLOCKCHAIN IN SUPPLY CHAIN AND LOGISTICS CURRENT AND FUTURE END USER ANALYSIS, 2025–2034, (USD MILLION)
FIGURE 31 MARKET SHARE BY COUNTRY
FIGURE 32 SEA AND SOUTH ASIA BLOCKCHAIN IN SUPPLY CHAIN AND LOGISTICS CURRENT AND FUTURE TYPE ANALYSIS, 2025–2034, (USD MILLION)
FIGURE 33 SEA AND SOUTH ASIA BLOCKCHAIN IN SUPPLY CHAIN AND LOGISTICS CURRENT AND FUTURE END USER ANALYSIS, 2025–2034, (USD MILLION)
FIGURE 34 MARKET SHARE BY COUNTRY
FIGURE 35 MIDDLE EAST AND AFRICA BLOCKCHAIN IN SUPPLY CHAIN AND LOGISTICS CURRENT AND FUTURE TYPE ANALYSIS, 2025–2034, (USD MILLION)
FIGURE 36 MIDDLE EAST AND AFRICA BLOCKCHAIN IN SUPPLY CHAIN AND LOGISTICS CURRENT AND FUTURE END USER ANALYSIS, 2025–2034, (USD MILLION)
FIGURE 37 NORTH AMERICA BLOCKCHAIN IN SUPPLY CHAIN AND LOGISTICS CURRENT AND FUTURE MARKET VOLUME SHARE REGIONAL ANALYSIS, 2025–2034, (USD MILLION)
FIGURE 38 U.S. BLOCKCHAIN IN SUPPLY CHAIN AND LOGISTICS CURRENT AND FUTURE TYPE ANALYSIS, 2025–2034, (USD MILLION)
FIGURE 39 U.S. BLOCKCHAIN IN SUPPLY CHAIN AND LOGISTICS CURRENT AND FUTURE END USER ANALYSIS, 2025–2034, (USD MILLION)
FIGURE 40 CANADA BLOCKCHAIN IN SUPPLY CHAIN AND LOGISTICS CURRENT AND FUTURE TYPE ANALYSIS, 2025–2034, (USD MILLION)
FIGURE 41 CANADA BLOCKCHAIN IN SUPPLY CHAIN AND LOGISTICS CURRENT AND FUTURE END USER ANALYSIS, 2025–2034, (USD MILLION)
FIGURE 42 LATIN AMERICA BLOCKCHAIN IN SUPPLY CHAIN AND LOGISTICS CURRENT AND FUTURE MARKET VOLUME SHARE REGIONAL ANALYSIS, 2025–2034, (USD MILLION)
FIGURE 43 MEXICO BLOCKCHAIN IN SUPPLY CHAIN AND LOGISTICS CURRENT AND FUTURE TYPE ANALYSIS, 2025–2034, (USD MILLION)
FIGURE 44 MEXICO BLOCKCHAIN IN SUPPLY CHAIN AND LOGISTICS CURRENT AND FUTURE END USER ANALYSIS, 2025–2034, (USD MILLION)
FIGURE 45 BRAZIL BLOCKCHAIN IN SUPPLY CHAIN AND LOGISTICS CURRENT AND FUTURE TYPE ANALYSIS, 2025–2034, (USD MILLION)
FIGURE 46 BRAZIL BLOCKCHAIN IN SUPPLY CHAIN AND LOGISTICS CURRENT AND FUTURE END USER ANALYSIS, 2025–2034, (USD MILLION)
FIGURE 47 ARGENTINA BLOCKCHAIN IN SUPPLY CHAIN AND LOGISTICS CURRENT AND FUTURE TYPE ANALYSIS, 2025–2034, (USD MILLION)
FIGURE 48 ARGENTINA BLOCKCHAIN IN SUPPLY CHAIN AND LOGISTICS CURRENT AND FUTURE END USER ANALYSIS, 2025–2034, (USD MILLION)
FIGURE 49 COLUMBIA BLOCKCHAIN IN SUPPLY CHAIN AND LOGISTICS CURRENT AND FUTURE TYPE ANALYSIS, 2025–2034, (USD MILLION)
FIGURE 50 COLUMBIA BLOCKCHAIN IN SUPPLY CHAIN AND LOGISTICS CURRENT AND FUTURE END USER ANALYSIS, 2025–2034, (USD MILLION)
FIGURE 51 REST OF LATIN AMERICA BLOCKCHAIN IN SUPPLY CHAIN AND LOGISTICS CURRENT AND FUTURE TYPE ANALYSIS, 2025–2034, (USD MILLION)
FIGURE 52 REST OF LATIN AMERICA BLOCKCHAIN IN SUPPLY CHAIN AND LOGISTICS CURRENT AND FUTURE END USER ANALYSIS, 2025–2034, (USD MILLION)
FIGURE 53 EASTERN EUROPE BLOCKCHAIN IN SUPPLY CHAIN AND LOGISTICS CURRENT AND FUTURE MARKET VOLUME SHARE REGIONAL ANALYSIS, 2025–2034, (USD MILLION)
FIGURE 54 POLAND BLOCKCHAIN IN SUPPLY CHAIN AND LOGISTICS CURRENT AND FUTURE TYPE ANALYSIS, 2025–2034, (USD MILLION)
FIGURE 55 POLAND BLOCKCHAIN IN SUPPLY CHAIN AND LOGISTICS CURRENT AND FUTURE END USER ANALYSIS, 2025–2034, (USD MILLION)
FIGURE 56 RUSSIA BLOCKCHAIN IN SUPPLY CHAIN AND LOGISTICS CURRENT AND FUTURE TYPE ANALYSIS, 2025–2034, (USD MILLION)
FIGURE 57 RUSSIA BLOCKCHAIN IN SUPPLY CHAIN AND LOGISTICS CURRENT AND FUTURE END USER ANALYSIS, 2025–2034, (USD MILLION)
FIGURE 58 CZECH REPUBLIC BLOCKCHAIN IN SUPPLY CHAIN AND LOGISTICS CURRENT AND FUTURE TYPE ANALYSIS, 2025–2034, (USD MILLION)
FIGURE 59 CZECH REPUBLIC BLOCKCHAIN IN SUPPLY CHAIN AND LOGISTICS CURRENT AND FUTURE END USER ANALYSIS, 2025–2034, (USD MILLION)
FIGURE 60 ROMANIA BLOCKCHAIN IN SUPPLY CHAIN AND LOGISTICS CURRENT AND FUTURE TYPE ANALYSIS, 2025–2034, (USD MILLION)
FIGURE 61 ROMANIA BLOCKCHAIN IN SUPPLY CHAIN AND LOGISTICS CURRENT AND FUTURE END USER ANALYSIS, 2025–2034, (USD MILLION)
FIGURE 62 REST OF EASTERN EUROPE BLOCKCHAIN IN SUPPLY CHAIN AND LOGISTICS CURRENT AND FUTURE TYPE ANALYSIS, 2025–2034, (USD MILLION)
FIGURE 63 REST OF EASTERN EUROPE BLOCKCHAIN IN SUPPLY CHAIN AND LOGISTICS CURRENT AND FUTURE END USER ANALYSIS, 2025–2034, (USD MILLION)
FIGURE 64 WESTERN EUROPE BLOCKCHAIN IN SUPPLY CHAIN AND LOGISTICS CURRENT AND FUTURE MARKET VOLUME SHARE REGIONAL ANALYSIS, 2025–2034, (USD MILLION)
FIGURE 65 GERMANY BLOCKCHAIN IN SUPPLY CHAIN AND LOGISTICS CURRENT AND FUTURE TYPE ANALYSIS, 2025–2034, (USD MILLION)
FIGURE 66 GERMANY BLOCKCHAIN IN SUPPLY CHAIN AND LOGISTICS CURRENT AND FUTURE END USER ANALYSIS, 2025–2034, (USD MILLION)
FIGURE 67 FRANCE BLOCKCHAIN IN SUPPLY CHAIN AND LOGISTICS CURRENT AND FUTURE TYPE ANALYSIS, 2025–2034, (USD MILLION)
FIGURE 68 FRANCE BLOCKCHAIN IN SUPPLY CHAIN AND LOGISTICS CURRENT AND FUTURE END USER ANALYSIS, 2025–2034, (USD MILLION)
FIGURE 69 UK BLOCKCHAIN IN SUPPLY CHAIN AND LOGISTICS CURRENT AND FUTURE TYPE ANALYSIS, 2025–2034, (USD MILLION)
FIGURE 70 UK BLOCKCHAIN IN SUPPLY CHAIN AND LOGISTICS CURRENT AND FUTURE END USER ANALYSIS, 2025–2034, (USD MILLION)
FIGURE 71 SPAIN BLOCKCHAIN IN SUPPLY CHAIN AND LOGISTICS CURRENT AND FUTURE TYPE ANALYSIS, 2025–2034, (USD MILLION)
FIGURE 72 SPAIN BLOCKCHAIN IN SUPPLY CHAIN AND LOGISTICS CURRENT AND FUTURE END USER ANALYSIS, 2025–2034, (USD MILLION)
FIGURE 73 ITALY BLOCKCHAIN IN SUPPLY CHAIN AND LOGISTICS CURRENT AND FUTURE TYPE ANALYSIS, 2025–2034, (USD MILLION)
FIGURE 74 ITALY BLOCKCHAIN IN SUPPLY CHAIN AND LOGISTICS CURRENT AND FUTURE END USER ANALYSIS, 2025–2034, (USD MILLION)
FIGURE 75 REST OF WESTERN EUROPE BLOCKCHAIN IN SUPPLY CHAIN AND LOGISTICS CURRENT AND FUTURE TYPE ANALYSIS, 2025–2034, (USD MILLION)
FIGURE 76 REST OF WESTERN EUROPE BLOCKCHAIN IN SUPPLY CHAIN AND LOGISTICS CURRENT AND FUTURE END USER ANALYSIS, 2025–2034, (USD MILLION)
FIGURE 77 EAST ASIA AND PACIFIC BLOCKCHAIN IN SUPPLY CHAIN AND LOGISTICS CURRENT AND FUTURE MARKET VOLUME SHARE REGIONAL ANALYSIS, 2025–2034, (USD MILLION)
FIGURE 78 CHINA BLOCKCHAIN IN SUPPLY CHAIN AND LOGISTICS CURRENT AND FUTURE TYPE ANALYSIS, 2025–2034, (USD MILLION)
FIGURE 79 CHINA BLOCKCHAIN IN SUPPLY CHAIN AND LOGISTICS CURRENT AND FUTURE END USER ANALYSIS, 2025–2034, (USD MILLION)
FIGURE 80 JAPAN BLOCKCHAIN IN SUPPLY CHAIN AND LOGISTICS CURRENT AND FUTURE TYPE ANALYSIS, 2025–2034, (USD MILLION)
FIGURE 81 JAPAN BLOCKCHAIN IN SUPPLY CHAIN AND LOGISTICS CURRENT AND FUTURE END USER ANALYSIS, 2025–2034, (USD MILLION)
FIGURE 82 AUSTRALIA BLOCKCHAIN IN SUPPLY CHAIN AND LOGISTICS CURRENT AND FUTURE TYPE ANALYSIS, 2025–2034, (USD MILLION)
FIGURE 83 AUSTRALIA BLOCKCHAIN IN SUPPLY CHAIN AND LOGISTICS CURRENT AND FUTURE END USER ANALYSIS, 2025–2034, (USD MILLION)
FIGURE 84 CAMBODIA BLOCKCHAIN IN SUPPLY CHAIN AND LOGISTICS CURRENT AND FUTURE TYPE ANALYSIS, 2025–2034, (USD MILLION)
FIGURE 85 CAMBODIA BLOCKCHAIN IN SUPPLY CHAIN AND LOGISTICS CURRENT AND FUTURE END USER ANALYSIS, 2025–2034, (USD MILLION)
FIGURE 86 FIJI BLOCKCHAIN IN SUPPLY CHAIN AND LOGISTICS CURRENT AND FUTURE TYPE ANALYSIS, 2025–2034, (USD MILLION)
FIGURE 87 FIJI BLOCKCHAIN IN SUPPLY CHAIN AND LOGISTICS CURRENT AND FUTURE END USER ANALYSIS, 2025–2034, (USD MILLION)
FIGURE 88 INDONESIA BLOCKCHAIN IN SUPPLY CHAIN AND LOGISTICS CURRENT AND FUTURE TYPE ANALYSIS, 2025–2034, (USD MILLION)
FIGURE 89 INDONESIA BLOCKCHAIN IN SUPPLY CHAIN AND LOGISTICS CURRENT AND FUTURE END USER ANALYSIS, 2025–2034, (USD MILLION)
FIGURE 90 SOUTH KOREA BLOCKCHAIN IN SUPPLY CHAIN AND LOGISTICS CURRENT AND FUTURE TYPE ANALYSIS, 2025–2034, (USD MILLION)
FIGURE 91 SOUTH KOREA BLOCKCHAIN IN SUPPLY CHAIN AND LOGISTICS CURRENT AND FUTURE END USER ANALYSIS, 2025–2034, (USD MILLION)
FIGURE 92 REST OF EAST ASIA AND PACIFIC BLOCKCHAIN IN SUPPLY CHAIN AND LOGISTICS CURRENT AND FUTURE TYPE ANALYSIS, 2025–2034, (USD MILLION)
FIGURE 93 REST OF EAST ASIA AND PACIFIC BLOCKCHAIN IN SUPPLY CHAIN AND LOGISTICS CURRENT AND FUTURE END USER ANALYSIS, 2025–2034, (USD MILLION)
FIGURE 94 SEA AND SOUTH ASIA BLOCKCHAIN IN SUPPLY CHAIN AND LOGISTICS CURRENT AND FUTURE MARKET VOLUME SHARE REGIONAL ANALYSIS, 2025–2034, (USD MILLION)
FIGURE 95 BANGLADESH BLOCKCHAIN IN SUPPLY CHAIN AND LOGISTICS CURRENT AND FUTURE TYPE ANALYSIS, 2025–2034, (USD MILLION)
FIGURE 96 BANGLADESH BLOCKCHAIN IN SUPPLY CHAIN AND LOGISTICS CURRENT AND FUTURE END USER ANALYSIS, 2025–2034, (USD MILLION)
FIGURE 97 NEW ZEALAND BLOCKCHAIN IN SUPPLY CHAIN AND LOGISTICS CURRENT AND FUTURE TYPE ANALYSIS, 2025–2034, (USD MILLION)
FIGURE 98 NEW ZEALAND BLOCKCHAIN IN SUPPLY CHAIN AND LOGISTICS CURRENT AND FUTURE END USER ANALYSIS, 2025–2034, (USD MILLION)
FIGURE 99 INDIA BLOCKCHAIN IN SUPPLY CHAIN AND LOGISTICS CURRENT AND FUTURE TYPE ANALYSIS, 2025–2034, (USD MILLION)
FIGURE 100 INDIA BLOCKCHAIN IN SUPPLY CHAIN AND LOGISTICS CURRENT AND FUTURE END USER ANALYSIS, 2025–2034, (USD MILLION)
FIGURE 101 SINGAPORE BLOCKCHAIN IN SUPPLY CHAIN AND LOGISTICS CURRENT AND FUTURE TYPE ANALYSIS, 2025–2034, (USD MILLION)
FIGURE 102 SINGAPORE BLOCKCHAIN IN SUPPLY CHAIN AND LOGISTICS CURRENT AND FUTURE END USER ANALYSIS, 2025–2034, (USD MILLION)
FIGURE 103 THAILAND BLOCKCHAIN IN SUPPLY CHAIN AND LOGISTICS CURRENT AND FUTURE TYPE ANALYSIS, 2025–2034, (USD MILLION)
FIGURE 104 THAILAND BLOCKCHAIN IN SUPPLY CHAIN AND LOGISTICS CURRENT AND FUTURE END USER ANALYSIS, 2025–2034, (USD MILLION)
FIGURE 105 TAIWAN BLOCKCHAIN IN SUPPLY CHAIN AND LOGISTICS CURRENT AND FUTURE TYPE ANALYSIS, 2025–2034, (USD MILLION)
FIGURE 106 TAIWAN BLOCKCHAIN IN SUPPLY CHAIN AND LOGISTICS CURRENT AND FUTURE END USER ANALYSIS, 2025–2034, (USD MILLION)
FIGURE 107 MALAYSIA BLOCKCHAIN IN SUPPLY CHAIN AND LOGISTICS CURRENT AND FUTURE TYPE ANALYSIS, 2025–2034, (USD MILLION)
FIGURE 108 MALAYSIA BLOCKCHAIN IN SUPPLY CHAIN AND LOGISTICS CURRENT AND FUTURE END USER ANALYSIS, 2025–2034, (USD MILLION)
FIGURE 109 REST OF SEA AND SOUTH ASIA BLOCKCHAIN IN SUPPLY CHAIN AND LOGISTICS CURRENT AND FUTURE TYPE ANALYSIS, 2025–2034, (USD MILLION)
FIGURE 110 REST OF SEA AND SOUTH ASIA BLOCKCHAIN IN SUPPLY CHAIN AND LOGISTICS CURRENT AND FUTURE END USER ANALYSIS, 2025–2034, (USD MILLION)
FIGURE 111 MIDDLE EAST AND AFRICA BLOCKCHAIN IN SUPPLY CHAIN AND LOGISTICS CURRENT AND FUTURE MARKET VOLUME SHARE REGIONAL ANALYSIS, 2025–2034, (USD MILLION)
FIGURE 112 GCC COUNTRIES BLOCKCHAIN IN SUPPLY CHAIN AND LOGISTICS CURRENT AND FUTURE TYPE ANALYSIS, 2025–2034, (USD MILLION)
FIGURE 113 GCC COUNTRIES BLOCKCHAIN IN SUPPLY CHAIN AND LOGISTICS CURRENT AND FUTURE END USER ANALYSIS, 2025–2034, (USD MILLION)
FIGURE 114 SAUDI ARABIA BLOCKCHAIN IN SUPPLY CHAIN AND LOGISTICS CURRENT AND FUTURE TYPE ANALYSIS, 2025–2034, (USD MILLION)
FIGURE 115 SAUDI ARABIA BLOCKCHAIN IN SUPPLY CHAIN AND LOGISTICS CURRENT AND FUTURE END USER ANALYSIS, 2025–2034, (USD MILLION)
FIGURE 116 UAE BLOCKCHAIN IN SUPPLY CHAIN AND LOGISTICS CURRENT AND FUTURE TYPE ANALYSIS, 2025–2034, (USD MILLION)
FIGURE 117 UAE BLOCKCHAIN IN SUPPLY CHAIN AND LOGISTICS CURRENT AND FUTURE END USER ANALYSIS, 2025–2034, (USD MILLION)
FIGURE 118 BAHRAIN BLOCKCHAIN IN SUPPLY CHAIN AND LOGISTICS CURRENT AND FUTURE TYPE ANALYSIS, 2025–2034, (USD MILLION)
FIGURE 119 BAHRAIN BLOCKCHAIN IN SUPPLY CHAIN AND LOGISTICS CURRENT AND FUTURE END USER ANALYSIS, 2025–2034, (USD MILLION)
FIGURE 120 KUWAIT BLOCKCHAIN IN SUPPLY CHAIN AND LOGISTICS CURRENT AND FUTURE TYPE ANALYSIS, 2025–2034, (USD MILLION)
FIGURE 121 KUWAIT BLOCKCHAIN IN SUPPLY CHAIN AND LOGISTICS CURRENT AND FUTURE END USER ANALYSIS, 2025–2034, (USD MILLION)
FIGURE 122 OMAN BLOCKCHAIN IN SUPPLY CHAIN AND LOGISTICS CURRENT AND FUTURE TYPE ANALYSIS, 2025–2034, (USD MILLION)
FIGURE 123 OMAN BLOCKCHAIN IN SUPPLY CHAIN AND LOGISTICS CURRENT AND FUTURE END USER ANALYSIS, 2025–2034, (USD MILLION)
FIGURE 124 QATAR BLOCKCHAIN IN SUPPLY CHAIN AND LOGISTICS CURRENT AND FUTURE TYPE ANALYSIS, 2025–2034, (USD MILLION)
FIGURE 125 QATAR BLOCKCHAIN IN SUPPLY CHAIN AND LOGISTICS CURRENT AND FUTURE END USER ANALYSIS, 2025–2034, (USD MILLION)
FIGURE 126 EGYPT BLOCKCHAIN IN SUPPLY CHAIN AND LOGISTICS CURRENT AND FUTURE TYPE ANALYSIS, 2025–2034, (USD MILLION)
FIGURE 127 EGYPT BLOCKCHAIN IN SUPPLY CHAIN AND LOGISTICS CURRENT AND FUTURE END USER ANALYSIS, 2025–2034, (USD MILLION)
FIGURE 128 NIGERIA BLOCKCHAIN IN SUPPLY CHAIN AND LOGISTICS CURRENT AND FUTURE TYPE ANALYSIS, 2025–2034, (USD MILLION)
FIGURE 129 NIGERIA BLOCKCHAIN IN SUPPLY CHAIN AND LOGISTICS CURRENT AND FUTURE END USER ANALYSIS, 2025–2034, (USD MILLION)
FIGURE 130 SOUTH AFRICA BLOCKCHAIN IN SUPPLY CHAIN AND LOGISTICS CURRENT AND FUTURE TYPE ANALYSIS, 2025–2034, (USD MILLION)
FIGURE 131 SOUTH AFRICA BLOCKCHAIN IN SUPPLY CHAIN AND LOGISTICS CURRENT AND FUTURE END USER ANALYSIS, 2025–2034, (USD MILLION)
FIGURE 132 ISRAEL BLOCKCHAIN IN SUPPLY CHAIN AND LOGISTICS CURRENT AND FUTURE TYPE ANALYSIS, 2025–2034, (USD MILLION)
FIGURE 133 ISRAEL BLOCKCHAIN IN SUPPLY CHAIN AND LOGISTICS CURRENT AND FUTURE END USER ANALYSIS, 2025–2034, (USD MILLION)
FIGURE 134 REST OF MEA BLOCKCHAIN IN SUPPLY CHAIN AND LOGISTICS CURRENT AND FUTURE TYPE ANALYSIS, 2025–2034, (USD MILLION)
FIGURE 135 REST OF MEA BLOCKCHAIN IN SUPPLY CHAIN AND LOGISTICS CURRENT AND FUTURE END USER ANALYSIS, 2025–2034, (USD MILLION)
FIGURE 136 U. S. MARKET SHARE ANALYSIS BY TYPE (2024)
FIGURE 137 U. S. MARKET SHARE ANALYSIS BY END USER (2024)
FIGURE 138 CANADA MARKET SHARE ANALYSIS BY TYPE (2024)
FIGURE 139 CANADA MARKET SHARE ANALYSIS BY END USER (2024)
FIGURE 140 MEXICO MARKET SHARE ANALYSIS BY TYPE (2024)
FIGURE 141 MEXICO MARKET SHARE ANALYSIS BY END USER (2024)
FIGURE 142 CHINA MARKET SHARE ANALYSIS BY TYPE (2024)
FIGURE 143 CHINA MARKET SHARE ANALYSIS BY END USER (2024)
FIGURE 144 JAPAN MARKET SHARE ANALYSIS BY TYPE (2024)
FIGURE 145 JAPAN MARKET SHARE ANALYSIS BY END USER (2024)
FIGURE 146 INDIA MARKET SHARE ANALYSIS BY TYPE (2024)
FIGURE 147 INDIA MARKET SHARE ANALYSIS BY END USER (2024)
FIGURE 148 SOUTH KOREA MARKET SHARE ANALYSIS BY TYPE (2024)
FIGURE 149 SOUTH KOREA MARKET SHARE ANALYSIS BY END USER (2024)
FIGURE 150 SAUDI ARABIA MARKET SHARE ANALYSIS BY TYPE (2024)
FIGURE 151 SAUDI ARABIA MARKET SHARE ANALYSIS BY END USER (2024)
FIGURE 152 UAE MARKET SHARE ANALYSIS BY TYPE (2024)
FIGURE 153 UAE MARKET SHARE ANALYSIS BY END USER (2024)
FIGURE 154 EGYPT MARKET SHARE ANALYSIS BY TYPE (2024)
FIGURE 155 EGYPT MARKET SHARE ANALYSIS BY END USER (2024)
FIGURE 156 NIGERIA MARKET SHARE ANALYSIS BY TYPE (2024)
FIGURE 157 NIGERIA MARKET SHARE ANALYSIS BY END USER (2024)
FIGURE 158 SOUTH AFRICA MARKET SHARE ANALYSIS BY TYPE (2024)
FIGURE 159 SOUTH AFRICA MARKET SHARE ANALYSIS BY END USER (2024)
FIGURE 160 GERMANY MARKET SHARE ANALYSIS BY TYPE (2024)
FIGURE 161 GERMANY MARKET SHARE ANALYSIS BY END USER (2024)
FIGURE 162 FRANCE MARKET SHARE ANALYSIS BY TYPE (2024)
FIGURE 163 FRANCE MARKET SHARE ANALYSIS BY END USER (2024)
FIGURE 164 UK MARKET SHARE ANALYSIS BY TYPE (2024)
FIGURE 165 UK MARKET SHARE ANALYSIS BY END USER (2024)
FIGURE 166 SPAIN MARKET SHARE ANALYSIS BY TYPE (2024)
FIGURE 167 SPAIN MARKET SHARE ANALYSIS BY END USER (2024)
FIGURE 168 ITALY MARKET SHARE ANALYSIS BY TYPE (2024)
FIGURE 169 ITALY MARKET SHARE ANALYSIS BY END USER (2024)
FIGURE 170 BRAZIL MARKET SHARE ANALYSIS BY TYPE (2024)
FIGURE 171 BRAZIL MARKET SHARE ANALYSIS BY END USER (2024)
FIGURE 172 ARGENTINA MARKET SHARE ANALYSIS BY TYPE (2024)
FIGURE 173 ARGENTINA MARKET SHARE ANALYSIS BY END USER (2024)
FIGURE 174 COLUMBIA MARKET SHARE ANALYSIS BY TYPE (2024)
FIGURE 175 COLUMBIA MARKET SHARE ANALYSIS BY END USER (2024)
FIGURE 176 GLOBAL BLOCKCHAIN IN SUPPLY CHAIN AND LOGISTICS CURRENT AND FUTURE MARKET KEY COUNTRY LEVEL ANALYSIS, 2024–2034, (USD MILLION)
FIGURE 177 FINANCIAL OVERVIEW:
Key Players Analysis:
IBM: A pioneer in blockchain technology, IBM offers its IBM Blockchain Platform, which provides tools and services for building and managing blockchain networks. The company has established partnerships with various organizations to enhance supply chain transparency and efficiency.
Microsoft: Through its Azure Blockchain Service, Microsoft enables businesses to create and manage blockchain networks with ease. The company focuses on integrating blockchain with IoT and AI to optimize supply chain operations.
SAP: SAP offers blockchain solutions that integrate with its enterprise resource planning (ERP) software, allowing businesses to enhance visibility and traceability in their supply chains. SAP's solutions are tailored for various industries, including manufacturing and retail.
Oracle: Oracle provides a comprehensive suite of blockchain applications designed to improve supply chain processes. Their solutions focus on enhancing data sharing, compliance, and overall operational efficiency.
Amazon Web Services (AWS): AWS offers managed blockchain services that allow organizations to set up scalable blockchain networks quickly. The platform supports various frameworks, enabling companies to customize their blockchain applications according to specific needs.
VeChain: Specializing in supply chain solutions, VeChain utilizes blockchain technology to enhance product traceability and authenticity. The company has established partnerships with several major brands to improve supply chain transparency.
R3 Corda: R3 is known for its Corda platform, which is designed specifically for business use cases, including supply chain management. Corda allows organizations to transact directly with one another while maintaining privacy and security.
Hyperledger: An open-source collaborative effort hosted by the Linux Foundation, Hyperledger provides frameworks for building blockchain solutions tailored for various industries, including supply chain management.
Market Key Players
IBM Corporation
Oracle Corporation
Microsoft Corporation
SAP SE
Accenture plc
Amazon Web Services (AWS)
Infosys Limited
TIBCO Software Inc.
Capgemini SE
DHL International GmbH
FedEx Corporation
Maersk (TradeLens Platform)
Huawei Technologies Co., Ltd.
BlockApps Inc.
VeChain Foundation
OpenText Corporation
Wipro Limited
Insolar Technologies
Chronicled Inc.
Skuchain Inc.
R3 Corda
Hyperledger
Waltonchain
Modum
Driver:
Increasing Demand for Transparency and Security
The primary driver for the blockchain in supply chain and logistics market is the growing need for enhanced transparency and security. Blockchain's decentralized and immutable ledger provides a tamper-proof record of every transaction, from the origin of goods to their final destination. This single source of truth builds trust among all stakeholders, including suppliers, manufacturers, distributors, and consumers. It also helps to combat counterfeit products and provides a reliable way to verify the authenticity of goods.
Operational Efficiency
The ability to automate processes through smart contracts significantly improves operational efficiency, reducing transaction times and costs while minimizing errors.
Regulatory Compliance
Stricter regulations regarding traceability and sustainability compel companies to adopt blockchain solutions, ensuring compliance and facilitating easier reporting.
Restraints:
Scalability and Integration Challenges
Despite its benefits, the market faces significant restraints related to scalability and integration. Current blockchain platforms can struggle with the high volume of transactions required for large-scale supply chains, which can lead to slow processing speeds and high transaction costs. Furthermore, integrating new blockchain systems with existing, often complex, legacy enterprise systems (ERP, WMS) is a major technical and financial hurdle. The lack of standardized protocols also complicates interoperability between different blockchain networks.
Regulatory Uncertainties
The evolving regulatory landscape around blockchain can create uncertainty, complicating implementation efforts for businesses.
Skill Shortages
There is a lack of skilled professionals who can effectively manage and implement blockchain technologies, which can hinder widespread adoption.
Opportunities:
Rise of Smart Contracts and IoT Integration
The market is presented with major opportunities through the integration of smart contracts and the Internet of Things (IoT). Smart contracts, which are self-executing agreements with the terms written directly into code, automate supply chain processes such as payments and inventory management. When combined with IoT devices—like sensors on a shipment—smart contracts can automatically trigger actions based on real-time data, for instance, releasing payment when a package arrives at a specific location, further improving efficiency and reducing manual intervention.
Integration with Other Technologies
The growing trend of integrating blockchain with IoT and AI can lead to more efficient supply chain operations and improved data accuracy.
Sustainability Initiatives
Increasing emphasis on sustainable practices opens avenues for blockchain applications in tracking ethical sourcing and reducing carbon footprints.
Trends
Focus on Sustainability and Traceability
A key trend shaping the market is the increasing focus on sustainability and ethical sourcing. Blockchain technology allows companies to meticulously track the journey of products, providing consumers with verifiable proof of a product's origin, the conditions under which it was produced, and its environmental impact. This traceability empowers consumers to make more informed purchasing decisions and helps companies demonstrate their commitment to ethical practices, creating a more sustainable and transparent global supply chain.
Collaboration Among Stakeholders
There is a notable trend toward collaboration among governments, NGOs, and private sectors to implement comprehensive blockchain strategies in supply chains.
Technological Advancements
Continuous innovations in blockchain technology are improving its scalability and usability, making it more accessible for various industries.
Recent Development
In July 2023, Hyundai and Kia introduced a blockchain-based Supplier CO2 Emission Monitoring System (SCEMS). This innovative system utilizes artificial intelligence (AI) and blockchain technology to monitor and track the carbon emissions of their suppliers, enabling them to reduce their environmental impact and improve sustainability efforts.
BASF Agricultural Solutions:In October 2022, BASF launched a blockchain platform named "Seed 2 Sew" to trace sustainably produced FiberMax cotton from seed to sew. This initiative enhances transparency and traceability for fashion brands, addressing the complexities of the cotton supply chain and enabling brands to source sustainable cotton confidently.
OrionOne and VeChain:In August 2022, OrionOne integrated its logistics platform with VeChain’s blockchain platform, allowing logistics companies to adopt blockchain technology easily. This integration aims to accelerate blockchain adoption in the logistics industry by providing a cost-effective solution for companies looking to enhance their operations without significant investments in infrastructure.
Mediaocean and IBM iX:In May 2020, Mediaocean collaborated with IBM iX to launch a blockchain consortium aimed at increasing transparency in the digital media supply chain. This consortium focuses on tracking ad spend and verifying advertising inventory, addressing issues such as brand safety and fraudulent activity.
Air Liquide:In April 2024, Air Liquide began constructing a state-of-the-art krypton and xenon purification facility in Cheonan, South Korea. This facility will utilize advanced cryogenic technologies for high-purity gas production tailored for semiconductor and space industries, demonstrating Air Liquide’s commitment to innovation in supply chain solutions.
Messer Group GmbH:In February 2024, Messer emerged as the leading bidder for the Federal Helium Assets auction conducted by the GSA. This acquisition reinforces Messer's commitment to providing essential resources across multiple sectors, including its operation of the Cliffside Gas Plant in Amarillo, Texas.
Frequently Asked Questions
How big is the Blockchain in Supply Chain and Logistics Market?
The Blockchain in Supply Chain & Logistics Market is set to reach USD 21.65B by 2034, driven by transparency, security, and smart contract automation.
Who are the major players in the Blockchain in Supply Chain and Logistics Market?
IBM Corporation, Oracle Corporation, Microsoft Corporation, SAP SE, Accenture plc, Amazon Web Services (AWS), Infosys Limited, TIBCO Software Inc., Capgemini SE, DHL International GmbH, FedEx Corporation, Maersk (TradeLens Platform), Huawei Technologies Co., Ltd., BlockApps Inc., VeChain Foundation, OpenText Corporation, Wipro Limited, Insolar Technologies, Chronicled Inc., Skuchain Inc., R3 Corda, Hyperledger, Waltonchain, Modum
Which segments covered the Blockchain in Supply Chain and Logistics Market?
By Component (Platform, Services, Hardware), By Deployment Type (Public Blockchain, Private Blockchain, Consortium/Hybrid Blockchain), By End-Use Industry (Retail & E-commerce, Food & Beverages, Pharmaceuticals & Healthcare, Manufacturing, Transportation & Logistics, Others), By Application (Smart Contracts, Supply Chain Management, Inventory Management, Product Tracking & Tracing, Payment & Settlement)
How can this market research report help my business make strategic decisions?
Our market research reports provide actionable intelligence, including verified market size data, CAGR projections, competitive benchmarking, and segment-level opportunity analysis. These insights support strategic planning, investment decisions, product development, and market entry strategies for enterprises and startups alike.
How frequently is the data updated?
We continuously monitor industry developments and update our reports to reflect regulatory changes, technological advancements, and macroeconomic shifts. Updated editions ensure you receive the latest market intelligence.

 Aerospace And Defence
 Agriculture
 Automotive And Transportation
 Banking And Finance
 Business
 Chemicals And Materials
 Consumer And Retail
 Electronics And Semiconductors
 Food And Beverages
 Machinery & Equipments
 Manufacturing And Construction
 Medical Devices
 Others
 Pharmaceuticals And Healthcare
 Power And Energy
 Sports
 Technology

, Component (Platform, Services, Hardware), End-Use Industry (Retail, Manufacturing, Food and Beverage, Pharmaceuticals, Logistics Service Providers), Region and Key Players - Industry Segment Overview, Market Dynamics, Competitive Strategies, Trends and Forecast 2025-2034")
, Component (Platform, Services, Hardware), End-Use Industry (Retail, Manufacturing, Food and Beverage, Pharmaceuticals, Logistics Service Providers), Region and Key Players - Industry Segment Overview, Market Dynamics, Competitive Strategies, Trends and Forecast 2025-2034")
, Component (Platform, Services, Hardware), End-Use Industry (Retail, Manufacturing, Food and Beverage, Pharmaceuticals, Logistics Service Providers), Region and Key Players - Industry Segment Overview, Market Dynamics, Competitive Strategies, Trends and Forecast 2025-2034")
, Component (Platform, Services, Hardware), End-Use Industry (Retail, Manufacturing, Food and Beverage, Pharmaceuticals, Logistics Service Providers), Region and Key Players - Industry Segment Overview, Market Dynamics, Competitive Strategies, Trends and Forecast 2025-2034")

