Botulinum Toxin-A in Urology Market Size, Share & Forecast 2024–2034
Global Botulinum Toxin-A in Urology Market Size, Share, and Growth Analysis by Indication (Overactive Bladder, Neurogenic Detrusor Overactivity, Urinary Incontinence), by End User (Hospitals, Specialty Clinics, Ambulatory Surgical Centers), by Patient Demographics, by Distribution Channel, Region & Key Players – Industry Trends, Clinical Adoption, Competitive Landscape, Regulatory Insights, and Forecast 2024–2034
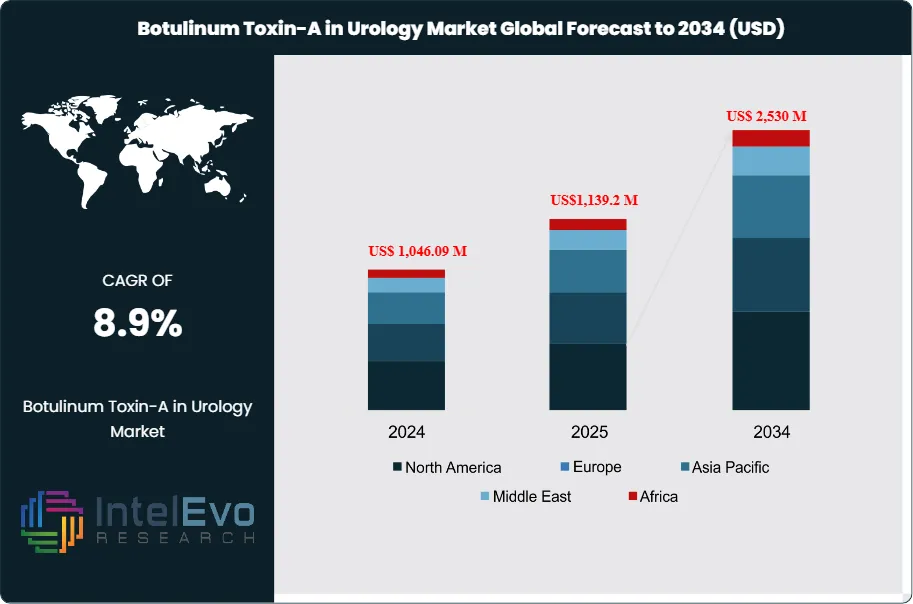
The Botulinum Toxin-A in Urology market is estimated at US$ 1,046.09 million in 2024 and is on track to reach roughly US$ 2,530 million by 2034, implying a compound annual growth rate (CAGR) of 8.9% over 2024–2034. This growth is driven by the rising prevalence of overactive bladder (OAB), neurogenic detrusor overactivity, and other lower urinary tract disorders, particularly among aging populations. Increasing clinical acceptance of minimally invasive treatments, expanding regulatory approvals, and growing patient preference for long-acting therapeutic options are further strengthening adoption across hospital and specialty urology settings.
The market has expanded steadily over the past five years, rising from US$ 820.1 million in 2020 to over US$ 1.0 billion in 2024. This trajectory reflects both rising prevalence of urological disorders and the growing acceptance of minimally invasive interventions among patients and healthcare providers.
Botulinum Toxin-A (BoNT-A) has become a preferred treatment for conditions such as overactive bladder, neurogenic detrusor overactivity, and interstitial cystitis. Its ability to reduce muscle overactivity by temporarily inhibiting nerve signaling provides longer-lasting relief compared with conventional anticholinergic drugs, which are often associated with side effects such as dry mouth, constipation, and cognitive impairment. This therapeutic advantage is particularly relevant for elderly patients, a demographic that is expanding rapidly. According to the World Health Organization, the global population aged 60 years and older will rise from 1 billion in 2020 to 2.1 billion by 2050, with those aged 80 years and above tripling to 426 million. In India alone, the elderly population is projected to account for 20% of the total by mid-century. These demographic shifts are expected to sustain long-term demand for BoNT-A therapies.
Market expansion is further supported by favorable reimbursement frameworks in developed economies. In the United States, Canada, Germany, and the United Kingdom, insurance coverage for BoNT-A procedures reduces patient out-of-pocket costs and accelerates adoption. At the same time, ongoing clinical research is broadening the scope of BoNT-A applications. Trials are investigating new indications, refined dosing strategies, and combination therapies that could extend treatment duration and improve outcomes.
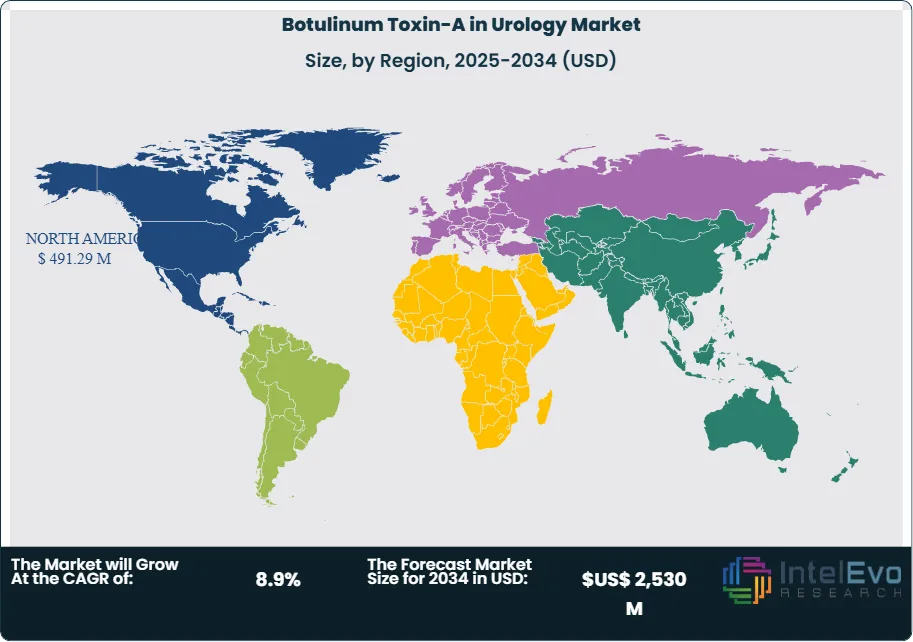
Regional performance highlights North America as the current leader, accounting for 47% of global revenue in 2024, or US$ 491.29 million. Europe follows with strong uptake driven by aging populations and supportive healthcare systems. Asia-Pacific is emerging as the fastest-growing region, supported by rising awareness, expanding healthcare infrastructure, and a rapidly aging demographic base. For investors, Asia-Pacific represents a key growth frontier, while North America and Europe remain stable revenue anchors.
Overall, the market outlook is defined by demographic pressures, clinical advantages over traditional therapies, and expanding research pipelines. These factors position Botulinum Toxin-A as a central component of urological care over the next decade.
Key Takeaways
Market Growth: The global Botulinum Toxin-A in Urology market was valued at US$ 1,046.09 million in 2024 and is projected to reach US$ 2,490.34 million by 2034, expanding at a CAGR of 8.9%. Growth is driven by rising prevalence of overactive bladder and neurogenic detrusor overactivity, coupled with increasing adoption of minimally invasive therapies.
Product Type: Botox-branded formulations accounted for 77.2% of total revenue in 2024, reflecting strong physician preference and established clinical efficacy compared with competing brands.
Indication: Overactive Bladder (OAB) represented the largest application segment with 83.5% market share in 2024, supported by high patient volumes and limited long-term effectiveness of oral anticholinergic drugs.
End User: Hospitals generated 67.4% of global revenue in 2024, underscoring their role as primary centers for BoNT-A procedures due to specialist availability and reimbursement coverage.
Driver: The expanding elderly population is a key demand driver. According to WHO, the number of people aged 60 years and older will double from 1 billion in 2020 to 2.1 billion by 2050, significantly increasing the incidence of urological disorders.
Restraint: High treatment costs remain a barrier in low- and middle-income countries, where limited insurance coverage restricts access and slows adoption despite clinical benefits.
Opportunity: Asia-Pacific presents the strongest growth potential, with double-digit CAGR expected through 2034. Rising healthcare expenditure, expanding insurance penetration, and a rapidly aging population position the region as a future investment hotspot.
Trend: Clinical research is expanding BoNT-A applications beyond OAB and NDO. Trials are exploring optimized dosing and combination therapies, which could extend treatment duration and improve patient outcomes, creating new revenue streams for manufacturers.
Regional Analysis: North America led the market with 47.0% share in 2024, equivalent to US$ 491.29 million, supported by favorable reimbursement and high awareness. Europe followed with strong adoption in Germany and the UK. Asia-Pacific is emerging as the fastest-growing region, while Latin America and the Middle East show gradual uptake tied to healthcare infrastructure improvements.
Type Analysis
The global Botulinum Toxin-A in Urology market remains highly concentrated by product type, with Botox continuing to dominate. In 2024, Botox accounted for 77.2% of total revenue, equivalent to US$ 807.9 million, supported by its established clinical record and broad regulatory approvals for urological conditions such as overactive bladder (OAB) and neurogenic detrusor overactivity (NDO). Its strong brand recognition, extensive clinical validation, and Allergan’s global distribution network have reinforced its leadership position.
Dysport and Xeomin collectively represent a smaller share, with revenues of US$ 163.3 million and US$ 47.7 million respectively in 2024. Both products are gaining traction in select markets due to competitive pricing and expanding clinical evidence, but they remain secondary choices compared with Botox. Other formulations, while present, account for less than 3% of global sales. Looking ahead to 2030, Botox is expected to retain its leadership, though incremental gains by Dysport and Xeomin are anticipated as healthcare systems diversify procurement and as clinical trials expand their approved indications.
The competitive landscape is shaped by product differentiation, safety profiles, and physician familiarity. Botox’s long-standing dominance is unlikely to be challenged in the near term, but regional adoption of alternatives may increase as cost pressures and local manufacturing initiatives influence purchasing decisions.
Application Analysis
Overactive Bladder (OAB) is the largest application segment, representing 83.5% of global revenue in 2024, or US$ 873.4 million. The high prevalence of OAB, particularly among aging populations, underpins this dominance. According to the World Health Organization, the global population aged 60 years and older will reach 2.1 billion by 2050, significantly expanding the patient pool. BoNT-A injections provide symptom relief lasting six to nine months, making them a preferred alternative to oral anticholinergics, which often cause side effects such as dry mouth and cognitive impairment.
Neurogenic Detrusor Overactivity (NDO) accounted for US$ 172.7 million in 2024 and is expected to grow steadily as awareness increases among patients with spinal cord injuries and multiple sclerosis. Clinical research is expanding the use of BoNT-A in NDO, with ongoing trials exploring optimized dosing and combination therapies. This segment, while smaller, represents a critical area of unmet need and is projected to deliver above-average growth rates through 2030.
The application mix highlights the importance of OAB as the primary revenue driver, while NDO offers long-term growth potential as clinical adoption broadens and reimbursement frameworks expand.
End-Use Analysis
Hospitals remain the leading end-user, generating 67.4% of global revenue in 2024, or US$ 705 million. Their dominance is attributed to the availability of specialized urology departments, skilled practitioners, and reimbursement coverage that supports BoNT-A procedures. Hospitals also manage complex cases requiring advanced diagnostic and post-treatment care, reinforcing their central role in the market.
Urology clinics accounted for US$ 282 million in 2024 and are gaining importance as outpatient centers for minimally invasive procedures. Their growth is supported by rising patient preference for shorter treatment times and lower costs compared with hospital-based care. Research institutes, though the smallest segment at US$ 59.1 million in 2024, play a strategic role in advancing clinical trials and expanding therapeutic applications.
By 2030, hospitals will continue to dominate, but urology clinics are expected to capture a larger share as healthcare systems shift toward outpatient models and as insurers expand coverage for clinic-based procedures.
Regional Analysis
North America leads the global market, accounting for 47% of revenue in 2024, or US$ 491.29 million. The United States drives this dominance, with an estimated 33 million individuals affected by OAB, according to the National Institutes of Health. Strong reimbursement policies, FDA approvals, and widespread physician adoption ensure continued growth. Canada also contributes meaningfully, supported by universal healthcare coverage for BoNT-A procedures.
Europe follows as the second-largest market, with Germany, the UK, and France leading adoption. Favorable reimbursement frameworks and an aging population underpin demand. Asia Pacific, while smaller at US$ 423.9 million in 2024, is the fastest-growing region. Rising healthcare expenditure, expanding insurance penetration, and a rapidly aging demographic base in China, Japan, and India are expected to drive double-digit CAGR through 2030.
Latin America and the Middle East & Africa represent smaller but expanding markets. Brazil and Mexico are leading adopters in Latin America, while Gulf states are investing in advanced urology care. These regions face challenges such as limited reimbursement and uneven healthcare infrastructure, but gradual improvements are expected to support steady growth.
By Product Type, (Botox, Dysport, Xeomin, Other Product Types), By Indication, (Overactive Bladder (OAB), Neurogenic Detrusor Overactivity (NDO)), By End-User, (Hospitals, Urology Clinics, Research Institutes)
Research Methodology
Primary Research- 100 Interviews of Stakeholders
Secondary Research
Desk Research
Regional scope
North America (United States, Canada, Mexico)
Latin America (Brazil, Argentina, Columbia)
East Asia And Pacific (China, Japan, South Korea, Australia, Cambodia, Fiji, Indonesia)
Sea And South Asia (India, Singapore, Thailand, Taiwan, Malaysia)
Eastern Europe (Poland, Russia, Czech Republic, Romania)
Western Europe (Germany, U.K., France, Spain, Itlay)
Middle East & Africa (GCC Countries, Egypt, Nigeria, South Africa, Israel)
Customization for segments, region/country-level will be provided. Moreover, additional customization can be done based on the requirements.
Pricing and Purchase Options
Avail customized purchase options to meet your exact research needs. We have three licenses to opt for: Single User License, Multi-User License (Up to 5 Users), Corporate Use License (Unlimited User and Printable PDF).
TABLE OF CONTENTS
1. EXECUTIVE SUMMARY
1.1. MARKET SNAPSHOT
1.2. KEY FINDINGS & INSIGHTS
1.3. ANALYST RECOMMENDATIONS
1.4. FUTURE OUTLOOK
2. RESEARCH METHODOLOGY
2.1. MARKET DEFINITION & SCOPE
2.2. RESEARCH OBJECTIVES: PRIMARY & SECONDARY DATA SOURCES
2.3. DATA COLLECTION SOURCES
2.3.1. COVERAGE OF 100+ PRIMARY RESEARCH/CONSULTATION CALLS WITH INDUSTRY STAKEHOLDERS
FIGURE 17 NORTH AMERICA BOTULINUM TOXIN-A IN UROLOGY CURRENT AND FUTURE TYPE ANALYSIS, 2025–2034, (USD MILLION)
FIGURE 18 NORTH AMERICA BOTULINUM TOXIN-A IN UROLOGY CURRENT AND FUTURE END USER ANALYSIS, 2025–2034, (USD MILLION)
FIGURE 19 MARKET SHARE BY COUNTRY
FIGURE 20 LATIN AMERICA BOTULINUM TOXIN-A IN UROLOGY CURRENT AND FUTURE TYPE ANALYSIS, 2025–2034, (USD MILLION)
FIGURE 21 LATIN AMERICA BOTULINUM TOXIN-A IN UROLOGY CURRENT AND FUTURE END USER ANALYSIS, 2025–2034, (USD MILLION)
FIGURE 22 MARKET SHARE BY COUNTRY
FIGURE 23 EASTERN EUROPE BOTULINUM TOXIN-A IN UROLOGY CURRENT AND FUTURE TYPE ANALYSIS, 2025–2034, (USD MILLION)
FIGURE 24 EASTERN EUROPE BOTULINUM TOXIN-A IN UROLOGY CURRENT AND FUTURE END USER ANALYSIS, 2025–2034, (USD MILLION)
FIGURE 25 MARKET SHARE BY COUNTRY
FIGURE 26 WESTERN EUROPE BOTULINUM TOXIN-A IN UROLOGY CURRENT AND FUTURE TYPE ANALYSIS, 2025–2034, (USD MILLION)
FIGURE 27 WESTERN EUROPE BOTULINUM TOXIN-A IN UROLOGY CURRENT AND FUTURE END USER ANALYSIS, 2025–2034, (USD MILLION)
FIGURE 28 MARKET SHARE BY COUNTRY
FIGURE 29 EAST ASIA AND PACIFIC BOTULINUM TOXIN-A IN UROLOGY CURRENT AND FUTURE TYPE ANALYSIS, 2025–2034, (USD MILLION)
FIGURE 30 EAST ASIA AND PACIFIC BOTULINUM TOXIN-A IN UROLOGY CURRENT AND FUTURE END USER ANALYSIS, 2025–2034, (USD MILLION)
FIGURE 31 MARKET SHARE BY COUNTRY
FIGURE 32 SEA AND SOUTH ASIA BOTULINUM TOXIN-A IN UROLOGY CURRENT AND FUTURE TYPE ANALYSIS, 2025–2034, (USD MILLION)
FIGURE 33 SEA AND SOUTH ASIA BOTULINUM TOXIN-A IN UROLOGY CURRENT AND FUTURE END USER ANALYSIS, 2025–2034, (USD MILLION)
FIGURE 34 MARKET SHARE BY COUNTRY
FIGURE 35 MIDDLE EAST AND AFRICA BOTULINUM TOXIN-A IN UROLOGY CURRENT AND FUTURE TYPE ANALYSIS, 2025–2034, (USD MILLION)
FIGURE 36 MIDDLE EAST AND AFRICA BOTULINUM TOXIN-A IN UROLOGY CURRENT AND FUTURE END USER ANALYSIS, 2025–2034, (USD MILLION)
FIGURE 37 NORTH AMERICA BOTULINUM TOXIN-A IN UROLOGY CURRENT AND FUTURE MARKET VOLUME SHARE REGIONAL ANALYSIS, 2025–2034, (USD MILLION)
FIGURE 38 U.S. BOTULINUM TOXIN-A IN UROLOGY CURRENT AND FUTURE TYPE ANALYSIS, 2025–2034, (USD MILLION)
FIGURE 39 U.S. BOTULINUM TOXIN-A IN UROLOGY CURRENT AND FUTURE END USER ANALYSIS, 2025–2034, (USD MILLION)
FIGURE 40 CANADA BOTULINUM TOXIN-A IN UROLOGY CURRENT AND FUTURE TYPE ANALYSIS, 2025–2034, (USD MILLION)
FIGURE 41 CANADA BOTULINUM TOXIN-A IN UROLOGY CURRENT AND FUTURE END USER ANALYSIS, 2025–2034, (USD MILLION)
FIGURE 42 LATIN AMERICA BOTULINUM TOXIN-A IN UROLOGY CURRENT AND FUTURE MARKET VOLUME SHARE REGIONAL ANALYSIS, 2025–2034, (USD MILLION)
FIGURE 43 MEXICO BOTULINUM TOXIN-A IN UROLOGY CURRENT AND FUTURE TYPE ANALYSIS, 2025–2034, (USD MILLION)
FIGURE 44 MEXICO BOTULINUM TOXIN-A IN UROLOGY CURRENT AND FUTURE END USER ANALYSIS, 2025–2034, (USD MILLION)
FIGURE 45 BRAZIL BOTULINUM TOXIN-A IN UROLOGY CURRENT AND FUTURE TYPE ANALYSIS, 2025–2034, (USD MILLION)
FIGURE 46 BRAZIL BOTULINUM TOXIN-A IN UROLOGY CURRENT AND FUTURE END USER ANALYSIS, 2025–2034, (USD MILLION)
FIGURE 47 ARGENTINA BOTULINUM TOXIN-A IN UROLOGY CURRENT AND FUTURE TYPE ANALYSIS, 2025–2034, (USD MILLION)
FIGURE 48 ARGENTINA BOTULINUM TOXIN-A IN UROLOGY CURRENT AND FUTURE END USER ANALYSIS, 2025–2034, (USD MILLION)
FIGURE 49 COLUMBIA BOTULINUM TOXIN-A IN UROLOGY CURRENT AND FUTURE TYPE ANALYSIS, 2025–2034, (USD MILLION)
FIGURE 50 COLUMBIA BOTULINUM TOXIN-A IN UROLOGY CURRENT AND FUTURE END USER ANALYSIS, 2025–2034, (USD MILLION)
FIGURE 51 REST OF LATIN AMERICA BOTULINUM TOXIN-A IN UROLOGY CURRENT AND FUTURE TYPE ANALYSIS, 2025–2034, (USD MILLION)
FIGURE 52 REST OF LATIN AMERICA BOTULINUM TOXIN-A IN UROLOGY CURRENT AND FUTURE END USER ANALYSIS, 2025–2034, (USD MILLION)
FIGURE 53 EASTERN EUROPE BOTULINUM TOXIN-A IN UROLOGY CURRENT AND FUTURE MARKET VOLUME SHARE REGIONAL ANALYSIS, 2025–2034, (USD MILLION)
FIGURE 54 POLAND BOTULINUM TOXIN-A IN UROLOGY CURRENT AND FUTURE TYPE ANALYSIS, 2025–2034, (USD MILLION)
FIGURE 55 POLAND BOTULINUM TOXIN-A IN UROLOGY CURRENT AND FUTURE END USER ANALYSIS, 2025–2034, (USD MILLION)
FIGURE 56 RUSSIA BOTULINUM TOXIN-A IN UROLOGY CURRENT AND FUTURE TYPE ANALYSIS, 2025–2034, (USD MILLION)
FIGURE 57 RUSSIA BOTULINUM TOXIN-A IN UROLOGY CURRENT AND FUTURE END USER ANALYSIS, 2025–2034, (USD MILLION)
FIGURE 58 CZECH REPUBLIC BOTULINUM TOXIN-A IN UROLOGY CURRENT AND FUTURE TYPE ANALYSIS, 2025–2034, (USD MILLION)
FIGURE 59 CZECH REPUBLIC BOTULINUM TOXIN-A IN UROLOGY CURRENT AND FUTURE END USER ANALYSIS, 2025–2034, (USD MILLION)
FIGURE 60 ROMANIA BOTULINUM TOXIN-A IN UROLOGY CURRENT AND FUTURE TYPE ANALYSIS, 2025–2034, (USD MILLION)
FIGURE 61 ROMANIA BOTULINUM TOXIN-A IN UROLOGY CURRENT AND FUTURE END USER ANALYSIS, 2025–2034, (USD MILLION)
FIGURE 62 REST OF EASTERN EUROPE BOTULINUM TOXIN-A IN UROLOGY CURRENT AND FUTURE TYPE ANALYSIS, 2025–2034, (USD MILLION)
FIGURE 63 REST OF EASTERN EUROPE BOTULINUM TOXIN-A IN UROLOGY CURRENT AND FUTURE END USER ANALYSIS, 2025–2034, (USD MILLION)
FIGURE 64 WESTERN EUROPE BOTULINUM TOXIN-A IN UROLOGY CURRENT AND FUTURE MARKET VOLUME SHARE REGIONAL ANALYSIS, 2025–2034, (USD MILLION)
FIGURE 65 GERMANY BOTULINUM TOXIN-A IN UROLOGY CURRENT AND FUTURE TYPE ANALYSIS, 2025–2034, (USD MILLION)
FIGURE 66 GERMANY BOTULINUM TOXIN-A IN UROLOGY CURRENT AND FUTURE END USER ANALYSIS, 2025–2034, (USD MILLION)
FIGURE 67 FRANCE BOTULINUM TOXIN-A IN UROLOGY CURRENT AND FUTURE TYPE ANALYSIS, 2025–2034, (USD MILLION)
FIGURE 68 FRANCE BOTULINUM TOXIN-A IN UROLOGY CURRENT AND FUTURE END USER ANALYSIS, 2025–2034, (USD MILLION)
FIGURE 69 UK BOTULINUM TOXIN-A IN UROLOGY CURRENT AND FUTURE TYPE ANALYSIS, 2025–2034, (USD MILLION)
FIGURE 70 UK BOTULINUM TOXIN-A IN UROLOGY CURRENT AND FUTURE END USER ANALYSIS, 2025–2034, (USD MILLION)
FIGURE 71 SPAIN BOTULINUM TOXIN-A IN UROLOGY CURRENT AND FUTURE TYPE ANALYSIS, 2025–2034, (USD MILLION)
FIGURE 72 SPAIN BOTULINUM TOXIN-A IN UROLOGY CURRENT AND FUTURE END USER ANALYSIS, 2025–2034, (USD MILLION)
FIGURE 73 ITALY BOTULINUM TOXIN-A IN UROLOGY CURRENT AND FUTURE TYPE ANALYSIS, 2025–2034, (USD MILLION)
FIGURE 74 ITALY BOTULINUM TOXIN-A IN UROLOGY CURRENT AND FUTURE END USER ANALYSIS, 2025–2034, (USD MILLION)
FIGURE 75 REST OF WESTERN EUROPE BOTULINUM TOXIN-A IN UROLOGY CURRENT AND FUTURE TYPE ANALYSIS, 2025–2034, (USD MILLION)
FIGURE 76 REST OF WESTERN EUROPE BOTULINUM TOXIN-A IN UROLOGY CURRENT AND FUTURE END USER ANALYSIS, 2025–2034, (USD MILLION)
FIGURE 77 EAST ASIA AND PACIFIC BOTULINUM TOXIN-A IN UROLOGY CURRENT AND FUTURE MARKET VOLUME SHARE REGIONAL ANALYSIS, 2025–2034, (USD MILLION)
FIGURE 78 CHINA BOTULINUM TOXIN-A IN UROLOGY CURRENT AND FUTURE TYPE ANALYSIS, 2025–2034, (USD MILLION)
FIGURE 79 CHINA BOTULINUM TOXIN-A IN UROLOGY CURRENT AND FUTURE END USER ANALYSIS, 2025–2034, (USD MILLION)
FIGURE 80 JAPAN BOTULINUM TOXIN-A IN UROLOGY CURRENT AND FUTURE TYPE ANALYSIS, 2025–2034, (USD MILLION)
FIGURE 81 JAPAN BOTULINUM TOXIN-A IN UROLOGY CURRENT AND FUTURE END USER ANALYSIS, 2025–2034, (USD MILLION)
FIGURE 82 AUSTRALIA BOTULINUM TOXIN-A IN UROLOGY CURRENT AND FUTURE TYPE ANALYSIS, 2025–2034, (USD MILLION)
FIGURE 83 AUSTRALIA BOTULINUM TOXIN-A IN UROLOGY CURRENT AND FUTURE END USER ANALYSIS, 2025–2034, (USD MILLION)
FIGURE 84 CAMBODIA BOTULINUM TOXIN-A IN UROLOGY CURRENT AND FUTURE TYPE ANALYSIS, 2025–2034, (USD MILLION)
FIGURE 85 CAMBODIA BOTULINUM TOXIN-A IN UROLOGY CURRENT AND FUTURE END USER ANALYSIS, 2025–2034, (USD MILLION)
FIGURE 86 FIJI BOTULINUM TOXIN-A IN UROLOGY CURRENT AND FUTURE TYPE ANALYSIS, 2025–2034, (USD MILLION)
FIGURE 87 FIJI BOTULINUM TOXIN-A IN UROLOGY CURRENT AND FUTURE END USER ANALYSIS, 2025–2034, (USD MILLION)
FIGURE 88 INDONESIA BOTULINUM TOXIN-A IN UROLOGY CURRENT AND FUTURE TYPE ANALYSIS, 2025–2034, (USD MILLION)
FIGURE 89 INDONESIA BOTULINUM TOXIN-A IN UROLOGY CURRENT AND FUTURE END USER ANALYSIS, 2025–2034, (USD MILLION)
FIGURE 90 SOUTH KOREA BOTULINUM TOXIN-A IN UROLOGY CURRENT AND FUTURE TYPE ANALYSIS, 2025–2034, (USD MILLION)
FIGURE 91 SOUTH KOREA BOTULINUM TOXIN-A IN UROLOGY CURRENT AND FUTURE END USER ANALYSIS, 2025–2034, (USD MILLION)
FIGURE 92 REST OF EAST ASIA AND PACIFIC BOTULINUM TOXIN-A IN UROLOGY CURRENT AND FUTURE TYPE ANALYSIS, 2025–2034, (USD MILLION)
FIGURE 93 REST OF EAST ASIA AND PACIFIC BOTULINUM TOXIN-A IN UROLOGY CURRENT AND FUTURE END USER ANALYSIS, 2025–2034, (USD MILLION)
FIGURE 94 SEA AND SOUTH ASIA BOTULINUM TOXIN-A IN UROLOGY CURRENT AND FUTURE MARKET VOLUME SHARE REGIONAL ANALYSIS, 2025–2034, (USD MILLION)
FIGURE 95 BANGLADESH BOTULINUM TOXIN-A IN UROLOGY CURRENT AND FUTURE TYPE ANALYSIS, 2025–2034, (USD MILLION)
FIGURE 96 BANGLADESH BOTULINUM TOXIN-A IN UROLOGY CURRENT AND FUTURE END USER ANALYSIS, 2025–2034, (USD MILLION)
FIGURE 97 NEW ZEALAND BOTULINUM TOXIN-A IN UROLOGY CURRENT AND FUTURE TYPE ANALYSIS, 2025–2034, (USD MILLION)
FIGURE 98 NEW ZEALAND BOTULINUM TOXIN-A IN UROLOGY CURRENT AND FUTURE END USER ANALYSIS, 2025–2034, (USD MILLION)
FIGURE 99 INDIA BOTULINUM TOXIN-A IN UROLOGY CURRENT AND FUTURE TYPE ANALYSIS, 2025–2034, (USD MILLION)
FIGURE 100 INDIA BOTULINUM TOXIN-A IN UROLOGY CURRENT AND FUTURE END USER ANALYSIS, 2025–2034, (USD MILLION)
FIGURE 101 SINGAPORE BOTULINUM TOXIN-A IN UROLOGY CURRENT AND FUTURE TYPE ANALYSIS, 2025–2034, (USD MILLION)
FIGURE 102 SINGAPORE BOTULINUM TOXIN-A IN UROLOGY CURRENT AND FUTURE END USER ANALYSIS, 2025–2034, (USD MILLION)
FIGURE 103 THAILAND BOTULINUM TOXIN-A IN UROLOGY CURRENT AND FUTURE TYPE ANALYSIS, 2025–2034, (USD MILLION)
FIGURE 104 THAILAND BOTULINUM TOXIN-A IN UROLOGY CURRENT AND FUTURE END USER ANALYSIS, 2025–2034, (USD MILLION)
FIGURE 105 TAIWAN BOTULINUM TOXIN-A IN UROLOGY CURRENT AND FUTURE TYPE ANALYSIS, 2025–2034, (USD MILLION)
FIGURE 106 TAIWAN BOTULINUM TOXIN-A IN UROLOGY CURRENT AND FUTURE END USER ANALYSIS, 2025–2034, (USD MILLION)
FIGURE 107 MALAYSIA BOTULINUM TOXIN-A IN UROLOGY CURRENT AND FUTURE TYPE ANALYSIS, 2025–2034, (USD MILLION)
FIGURE 108 MALAYSIA BOTULINUM TOXIN-A IN UROLOGY CURRENT AND FUTURE END USER ANALYSIS, 2025–2034, (USD MILLION)
FIGURE 109 REST OF SEA AND SOUTH ASIA BOTULINUM TOXIN-A IN UROLOGY CURRENT AND FUTURE TYPE ANALYSIS, 2025–2034, (USD MILLION)
FIGURE 110 REST OF SEA AND SOUTH ASIA BOTULINUM TOXIN-A IN UROLOGY CURRENT AND FUTURE END USER ANALYSIS, 2025–2034, (USD MILLION)
FIGURE 111 MIDDLE EAST AND AFRICA BOTULINUM TOXIN-A IN UROLOGY CURRENT AND FUTURE MARKET VOLUME SHARE REGIONAL ANALYSIS, 2025–2034, (USD MILLION)
FIGURE 112 GCC COUNTRIES BOTULINUM TOXIN-A IN UROLOGY CURRENT AND FUTURE TYPE ANALYSIS, 2025–2034, (USD MILLION)
FIGURE 113 GCC COUNTRIES BOTULINUM TOXIN-A IN UROLOGY CURRENT AND FUTURE END USER ANALYSIS, 2025–2034, (USD MILLION)
FIGURE 114 SAUDI ARABIA BOTULINUM TOXIN-A IN UROLOGY CURRENT AND FUTURE TYPE ANALYSIS, 2025–2034, (USD MILLION)
FIGURE 115 SAUDI ARABIA BOTULINUM TOXIN-A IN UROLOGY CURRENT AND FUTURE END USER ANALYSIS, 2025–2034, (USD MILLION)
FIGURE 116 UAE BOTULINUM TOXIN-A IN UROLOGY CURRENT AND FUTURE TYPE ANALYSIS, 2025–2034, (USD MILLION)
FIGURE 117 UAE BOTULINUM TOXIN-A IN UROLOGY CURRENT AND FUTURE END USER ANALYSIS, 2025–2034, (USD MILLION)
FIGURE 118 BAHRAIN BOTULINUM TOXIN-A IN UROLOGY CURRENT AND FUTURE TYPE ANALYSIS, 2025–2034, (USD MILLION)
FIGURE 119 BAHRAIN BOTULINUM TOXIN-A IN UROLOGY CURRENT AND FUTURE END USER ANALYSIS, 2025–2034, (USD MILLION)
FIGURE 120 KUWAIT BOTULINUM TOXIN-A IN UROLOGY CURRENT AND FUTURE TYPE ANALYSIS, 2025–2034, (USD MILLION)
FIGURE 121 KUWAIT BOTULINUM TOXIN-A IN UROLOGY CURRENT AND FUTURE END USER ANALYSIS, 2025–2034, (USD MILLION)
FIGURE 122 OMAN BOTULINUM TOXIN-A IN UROLOGY CURRENT AND FUTURE TYPE ANALYSIS, 2025–2034, (USD MILLION)
FIGURE 123 OMAN BOTULINUM TOXIN-A IN UROLOGY CURRENT AND FUTURE END USER ANALYSIS, 2025–2034, (USD MILLION)
FIGURE 124 QATAR BOTULINUM TOXIN-A IN UROLOGY CURRENT AND FUTURE TYPE ANALYSIS, 2025–2034, (USD MILLION)
FIGURE 125 QATAR BOTULINUM TOXIN-A IN UROLOGY CURRENT AND FUTURE END USER ANALYSIS, 2025–2034, (USD MILLION)
FIGURE 126 EGYPT BOTULINUM TOXIN-A IN UROLOGY CURRENT AND FUTURE TYPE ANALYSIS, 2025–2034, (USD MILLION)
FIGURE 127 EGYPT BOTULINUM TOXIN-A IN UROLOGY CURRENT AND FUTURE END USER ANALYSIS, 2025–2034, (USD MILLION)
FIGURE 128 NIGERIA BOTULINUM TOXIN-A IN UROLOGY CURRENT AND FUTURE TYPE ANALYSIS, 2025–2034, (USD MILLION)
FIGURE 129 NIGERIA BOTULINUM TOXIN-A IN UROLOGY CURRENT AND FUTURE END USER ANALYSIS, 2025–2034, (USD MILLION)
FIGURE 130 SOUTH AFRICA BOTULINUM TOXIN-A IN UROLOGY CURRENT AND FUTURE TYPE ANALYSIS, 2025–2034, (USD MILLION)
FIGURE 131 SOUTH AFRICA BOTULINUM TOXIN-A IN UROLOGY CURRENT AND FUTURE END USER ANALYSIS, 2025–2034, (USD MILLION)
FIGURE 132 ISRAEL BOTULINUM TOXIN-A IN UROLOGY CURRENT AND FUTURE TYPE ANALYSIS, 2025–2034, (USD MILLION)
FIGURE 133 ISRAEL BOTULINUM TOXIN-A IN UROLOGY CURRENT AND FUTURE END USER ANALYSIS, 2025–2034, (USD MILLION)
FIGURE 134 REST OF MEA BOTULINUM TOXIN-A IN UROLOGY CURRENT AND FUTURE TYPE ANALYSIS, 2025–2034, (USD MILLION)
FIGURE 135 REST OF MEA BOTULINUM TOXIN-A IN UROLOGY CURRENT AND FUTURE END USER ANALYSIS, 2025–2034, (USD MILLION)
FIGURE 136 U. S. MARKET SHARE ANALYSIS BY TYPE (2024)
FIGURE 137 U. S. MARKET SHARE ANALYSIS BY END USER (2024)
FIGURE 138 CANADA MARKET SHARE ANALYSIS BY TYPE (2024)
FIGURE 139 CANADA MARKET SHARE ANALYSIS BY END USER (2024)
FIGURE 140 MEXICO MARKET SHARE ANALYSIS BY TYPE (2024)
FIGURE 141 MEXICO MARKET SHARE ANALYSIS BY END USER (2024)
FIGURE 142 CHINA MARKET SHARE ANALYSIS BY TYPE (2024)
FIGURE 143 CHINA MARKET SHARE ANALYSIS BY END USER (2024)
FIGURE 144 JAPAN MARKET SHARE ANALYSIS BY TYPE (2024)
FIGURE 145 JAPAN MARKET SHARE ANALYSIS BY END USER (2024)
FIGURE 146 INDIA MARKET SHARE ANALYSIS BY TYPE (2024)
FIGURE 147 INDIA MARKET SHARE ANALYSIS BY END USER (2024)
FIGURE 148 SOUTH KOREA MARKET SHARE ANALYSIS BY TYPE (2024)
FIGURE 149 SOUTH KOREA MARKET SHARE ANALYSIS BY END USER (2024)
FIGURE 150 SAUDI ARABIA MARKET SHARE ANALYSIS BY TYPE (2024)
FIGURE 151 SAUDI ARABIA MARKET SHARE ANALYSIS BY END USER (2024)
FIGURE 152 UAE MARKET SHARE ANALYSIS BY TYPE (2024)
FIGURE 153 UAE MARKET SHARE ANALYSIS BY END USER (2024)
FIGURE 154 EGYPT MARKET SHARE ANALYSIS BY TYPE (2024)
FIGURE 155 EGYPT MARKET SHARE ANALYSIS BY END USER (2024)
FIGURE 156 NIGERIA MARKET SHARE ANALYSIS BY TYPE (2024)
FIGURE 157 NIGERIA MARKET SHARE ANALYSIS BY END USER (2024)
FIGURE 158 SOUTH AFRICA MARKET SHARE ANALYSIS BY TYPE (2024)
FIGURE 159 SOUTH AFRICA MARKET SHARE ANALYSIS BY END USER (2024)
FIGURE 160 GERMANY MARKET SHARE ANALYSIS BY TYPE (2024)
FIGURE 161 GERMANY MARKET SHARE ANALYSIS BY END USER (2024)
FIGURE 162 FRANCE MARKET SHARE ANALYSIS BY TYPE (2024)
FIGURE 163 FRANCE MARKET SHARE ANALYSIS BY END USER (2024)
FIGURE 164 UK MARKET SHARE ANALYSIS BY TYPE (2024)
FIGURE 165 UK MARKET SHARE ANALYSIS BY END USER (2024)
FIGURE 166 SPAIN MARKET SHARE ANALYSIS BY TYPE (2024)
FIGURE 167 SPAIN MARKET SHARE ANALYSIS BY END USER (2024)
FIGURE 168 ITALY MARKET SHARE ANALYSIS BY TYPE (2024)
FIGURE 169 ITALY MARKET SHARE ANALYSIS BY END USER (2024)
FIGURE 170 BRAZIL MARKET SHARE ANALYSIS BY TYPE (2024)
FIGURE 171 BRAZIL MARKET SHARE ANALYSIS BY END USER (2024)
FIGURE 172 ARGENTINA MARKET SHARE ANALYSIS BY TYPE (2024)
FIGURE 173 ARGENTINA MARKET SHARE ANALYSIS BY END USER (2024)
FIGURE 174 COLUMBIA MARKET SHARE ANALYSIS BY TYPE (2024)
FIGURE 175 COLUMBIA MARKET SHARE ANALYSIS BY END USER (2024)
FIGURE 176 GLOBAL BOTULINUM TOXIN-A IN UROLOGY CURRENT AND FUTURE MARKET KEY COUNTRY LEVEL ANALYSIS, 2024–2034, (USD MILLION)
FIGURE 177 FINANCIAL OVERVIEW:
Key Player Analysis
Merz Pharma: Merz is a challenger in urology with IncobotulinumtoxinA (Xeomin). It targets segments where neutral complex formulations and room-temperature storage advantages support clinic operations. In 2025, Merz is expanding access through specialty distributors and payer engagement in Europe and select Asia Pacific markets. It focuses on clinical protocols tailored to OAB and NDO to improve dosing consistency and reduce UTI rates.
Merz differentiates on formulation characteristics, physician education, and operational efficiency. Its strategy includes partnerships with outpatient urology centers to shift treatments from hospital to clinic settings. This supports lower procedure costs and faster scheduling, which can increase adoption in markets with limited inpatient capacity. Expect steady share gains where procurement diversity and clinic-based delivery are priorities.
Medytox: Medytox is a niche player with regional strength in Asia, primarily South Korea, and growing presence through alliances in broader therapeutics. While most revenues derive from aesthetics, the company is investing to expand therapeutic applications, including urology. In 2025, Medytox is advancing clinical collaborations and post-marketing studies aimed at OAB symptom control and durability.
Medytox differentiates through manufacturing capabilities, cost-effective supply, and rapid clinical development cycles. It leverages regional distributor networks to drive adoption in private clinics. The near-term impact in urology is modest, but targeted trials and pricing flexibility could enable entry into select hospital tenders across Asia Pacific.
Bio-Med Private Limited: Bio-Med is a regional distributor and supplier in India, positioned as a niche player supporting hospital procurement and clinician access for BoNT-A products. Its core role is market enablement rather than proprietary toxin manufacturing. In 2025, Bio-Med focuses on expanding urology clinic coverage in Tier 1 and Tier 2 cities, improving cold-chain reliability, and aligning with payer and state programs to reduce patient out-of-pocket costs.
L3Harris Technologies Inc: L3Harris does not operate in BoNT-A therapeutics or urology. It focuses on defense and communications technologies. No market positioning or product relevance to the Botulinum Toxin-A in Urology market.
Lockheed Martin Corporation: Lockheed Martin is outside the scope of BoNT-A in urology. It operates in aerospace and defense systems. No applicable products, clinical initiatives, or distribution activities in this market.
Optional additions – AbbVie (Allergan Aesthetics): AbbVie is the market leader through OnabotulinumtoxinA (Botox), which holds the largest share in urology indications. In 2025, AbbVie is expanding training for urology specialists, enhancing patient support programs, and funding trials focused on dosing optimization and retreatment timing in OAB and NDO. Differentiators include the largest prescriber base, extensive clinical evidence, and strong reimbursement coverage, especially in North America. Expect stable high share and consistent revenue growth aligned with market CAGR.
Market Key Players
Daewoong Pharmaceutical Co., Ltd.
AbbVie Inc
Medytox
Galderma (Distributor)
Ipsen Pharma
HUGEL, Inc.
Merz Pharma
Bio-Med Private Limited
Driver
Aging Population Driving Urological Disease Burden
By 2025, the increasing number of age-related urological disorders will be the main factor driving the use of Botulinum Toxin-A (BoNT-A). Overactive bladder affects almost 17% of adults worldwide, while benign prostatic hyperplasia impacts more than 100 million men, with cases rising sharply after age 60. Global demographic trends support this need, as the population aged 65 and older is expected to surpass 1.2 billion by 2030, greatly increasing the number of patients needing long-term management for bladder dysfunction.
BoNT-A provides long-lasting symptom relief for six to nine months. It performs better than oral anticholinergics and beta-3 agonists, which often cause systemic side effects and poor adherence. Increasing knowledge among doctors, standardized injection protocols, and favorable reimbursement in developed healthcare systems are strengthening its position as a primary treatment for difficult urological conditions. For investors, this combination of demographic growth and clinical effectiveness offers a clear outlook for long-term demand and steady revenue growth throughout the forecast period.
Despite its proven effectiveness, safety concerns limit the wider use of BoNT-A. Clinical studies show that 15 to 35% of patients treated experience urinary tract infections, while up to 20% may face temporary urinary retention that could need intermittent catheterization. These issues can hurt patient satisfaction and treatment continuity, especially among older adults managing multiple health problems.
Physician Caution and Risk Sensitivity in Prescribing
Although it's rare, worries about toxin diffusion and possible neuromuscular side effects influence cautious prescribing practices in some markets. In healthcare systems that prioritize risk management or have many alternative treatments available, these safety concerns may slow the decision to escalate treatment to BoNT-A. For manufacturers, overcoming this challenge requires strong post-marketing monitoring, real-world evidence, and better patient selection strategies to maintain trust among doctors and regulators.
Opportunity
Pipeline Expansion Into Underserved Urological Indications
Current research and development are opening new growth opportunities for BoNT-A beyond its known use in overactive bladder and neurogenic detrusor overactivity. Clinical trials are now increasingly targeting bladder pain syndrome and interstitial cystitis, conditions that have high unmet needs and few lasting treatment choices. Early results suggest significant reductions in pain, urgency, and frequency, positioning BoNT-A as a potential groundbreaking therapy for these conditions.
Revenue Upside Through Indication Diversification
The BoNT-A in urology market is predicted to grow at nearly 9% annually through 2034. Successfully moving into more indications could significantly increase revenue beyond initial forecasts. For stakeholders, investing in late-stage clinical trials, regulatory submissions, and physician training programs offers a direct route to expanding their portfolios and establishing a long-term market advantage, especially in specialty urology care.
Trend
Shift Toward Minimally Invasive, Outpatient Care Models
A key trend in 2025 is the growing incorporation of BoNT-A into minimally invasive, outpatient urology treatment methods. Clinics and hospitals are adopting standardized injection protocols that cut down procedure time, reduce costs, and enhance patient convenience. This shift promotes wider access while supporting healthcare systems' goals of decreasing inpatient demand and improving procedural efficiency.
Data-Driven Treatment Optimization and Digital Integration
At the same time, digital health tools and real-world evidence platforms are becoming popular for monitoring outcomes, optimizing dosing times, and improving patient classification. Manufacturers are investing in digital communication, ongoing data collection, and expanded clinical programs to encourage evidence-driven adoption. This combination of minimally invasive care and data-based optimization is changing the competitive landscape, favoring companies that combine clinical effectiveness with a better patient experience and decision support.
Recent Developments
Dec 2024 – AbbVie Inc.: Initiated a large-scale, multi-year real-world evidence program valued at over $20 million to analyze post-treatment outcomes for BOTOX® in patients with Overactive Bladder (OAB). This initiative is designed to refine patient selection criteria and dosing protocols, reinforcing the product's market leadership by improving its long-term safety and efficacy profile.
Jan 2025 – Ipsen Pharma: Entered a strategic research collaboration with a leading European urology institute to accelerate the development of its next-generation recombinant botulinum toxin therapies for neurogenic bladder disorders. This partnership leverages specialized research capabilities to create a longer-acting therapy, positioning Ipsen to compete on product differentiation and treatment duration.
Apr 2025 – Merz Pharma: Announced the initiation of its pivotal Phase III clinical trial for a needle-free botulinum toxin (XEOMIN®) delivery system for OAB, developed with Vensica Therapeutics. The trial is set to enroll over 500 patients across North America and Europe, with an estimated investment of $35 million. A successful outcome would introduce the first needleless urological application, expanding the market by appealing to injection-averse patients.
Jul 2025 – Daewoong Pharmaceutical Co., Ltd.: Received regulatory approval from Indian authorities for its botulinum toxin product to treat neurogenic detrusor overactivity. This approval follows a successful Phase III trial demonstrating non-inferiority to existing treatments. The decision marks a critical entry into a high-growth market, strengthening the company's position in the Asia-Pacific region.
Sep 2025 – AbbVie Inc.: Reported that its lower-dose formulation of BOTOX® for OAB, launched in late 2024, achieved rapid adoption across more than 1,500 urology clinics in the United States. The company projects the formulation will capture an additional 10% of the addressable OAB treatment market by the end of 2026. This fast uptake confirms strong demand for treatments with an improved side-effect profile, solidifying AbbVie’s dominant position in the segment.