Building Maintenance Services Market Size & Forecast | 8.3% CAGR
Global Building Maintenance Services Market Size, Share & Industry Analysis By Service Type (Landscaping, Interior Building Cleaning, Exterior Cleaning, Pest Control, HVAC Maintenance, Elevator Maintenance, Security Services), By Application (Residential, Commercial, Healthcare, Education, Hotels & Resorts), By End-User (Facility Management Companies, Property Owners, Government Organizations, Outsourced Providers), Regional Outlook, Competitive Landscape, Market Trends & Forecast 2025–2034
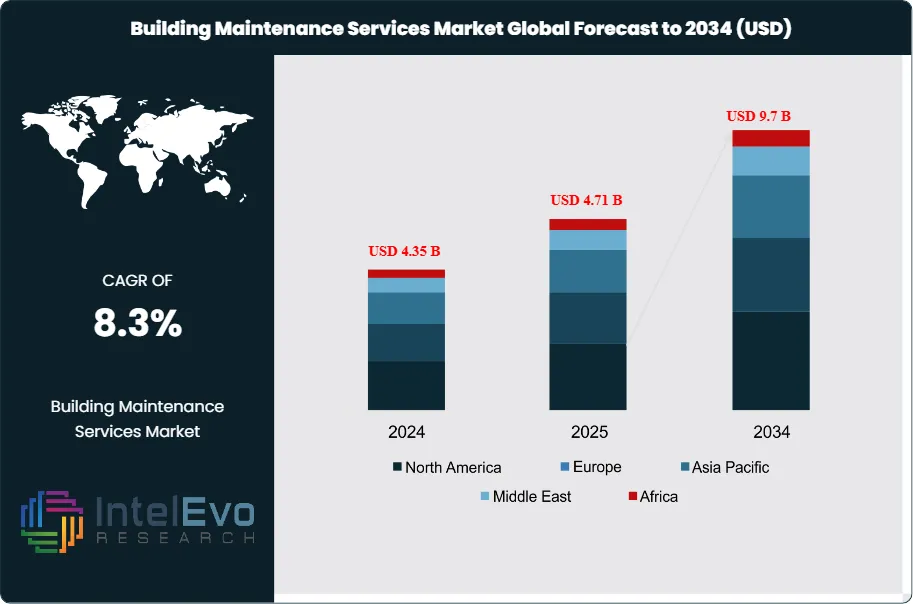
The Building Maintenance Services Market was valued at USD 4.35 Billion in 2024 and is projected to reach approximately USD 9.7 Billion by 2034. The market is estimated to grow to around USD 4.71 Billion in 2025. Based on projected expansion from 2026 onward, the industry is expected to register a compound annual growth rate (CAGR) of approximately 8.3% during 2026–2034.
Building maintenance services cover routine and corrective work that keeps assets safe, compliant, and efficient across commercial, residential, and institutional sites. Service scopes span janitorial and deep cleaning, minor repairs, HVAC servicing, electrical and plumbing work, landscaping, and pest control. Demand expands as owners move spending from reactive interventions to structured preventive programs that protect building uptime, support tenant satisfaction, and extend asset life. Aging infrastructure in mature cities and heavier utilization in mixed-use properties add steady service volume and shorten maintenance cycles.
Sustainability priorities now shape procurement and operating standards. Energy and emissions regulations, indoor-air requirements, and building-performance disclosure programs push portfolios toward mechanical optimization and auditable maintenance records. Buyers increasingly favor vendors that can document outcomes such as reduced energy intensity, fewer critical failures, and longer equipment run time between overhauls. On the supply side, the market remains fragmented, but consolidation continues as integrated facilities managers acquire local specialists to widen geographic coverage and add technical capabilities.
Digitalization is changing both economics and risk. CMMS platforms, connected sensors, and digital twins improve asset visibility and reduce unplanned downtime. AI-enabled scheduling and predictive analytics improve technician dispatch, parts planning, and preventive work sequencing, while automation in cleaning and inspection lifts productivity in airports, hospitals, and large office campuses. These advances support performance-based contracts, yet they also increase exposure to service-level penalties, cybersecurity incidents, and data-quality gaps. Wage inflation, skills shortages in HVAC and electrical trades, and contractor safety liabilities remain central cost and execution risks.
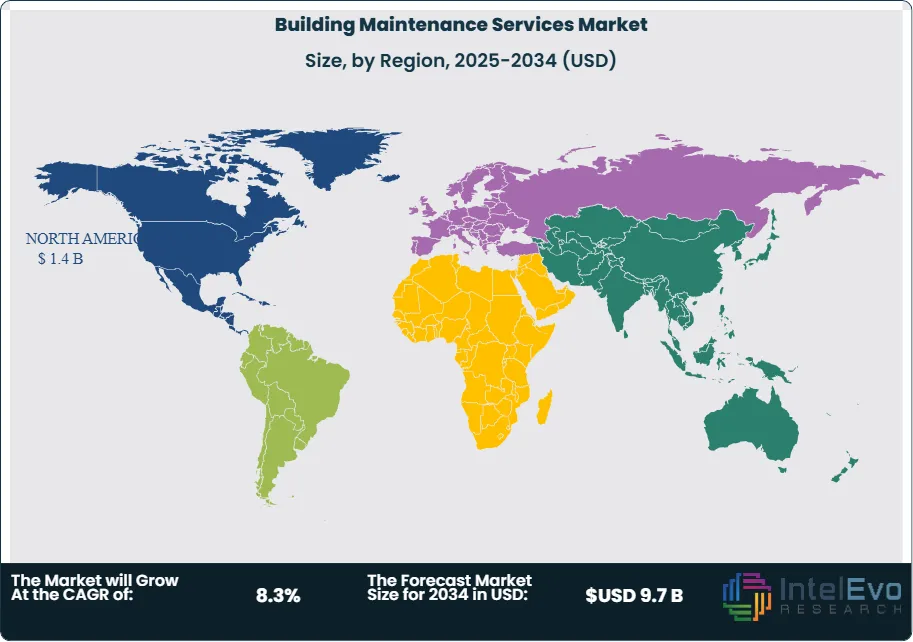
North America led in 2024, capturing more than 34% of revenue and generating about USD 1.4 billion, supported by high outsourcing penetration and strict safety compliance. Europe followed with an estimated 26% share, driven by retrofit cycles and efficiency mandates across public and commercial stock. Asia Pacific represented roughly 24% and delivers the fastest growth as urban development expands the installed base and raises compliance needs. Investment hotspots include U.S. Sun Belt metros, Western European retrofit corridors, and fast-growing Indian and Southeast Asian city clusters where premium commercial space and industrial parks are scaling quickly.
Key Takeaways
Market Growth: The market expands from 4.35 billion USD, 2024 to 9.7 billion USD, 2034 and delivers 8.4% CAGR, 2024-2034. This trajectory reflects sustained demand scaling across core service lines at 9.7 billion USD, 2034.
Segment Dominance: Interior Building Cleaning leads service mix with more than 22.0% share, 2024. This segment anchors recurring maintenance spend at 22.0% share, 2024.
Segment Dominance: Commercial Buildings dominate end-use demand with more than 34.0% share, 2024. This concentration signals high contract density at 34.0% share, 2024.
Driver: Facility Management Companies set the primary delivery model with more than 40.0% share, 2024. Scale-driven bundling and compliance execution accelerate adoption at 40.0% share, 2024.
Restraint: The U.S. market grows at a slower 5.3% CAGR, 2024-2034 versus 8.4% CAGR, 2024-2034 globally. This gap indicates margin and expansion pressure in a mature base at 1.4 billion USD, 2024.
Opportunity: Outsourced delivery remains the default with more than 41.0% share, 2024, creating room to upsell integrated and performance-linked contracts. Providers can capture incremental share through conversion programs at estimated: 2.0 percentage points, 2024-2034.
Trend: Digital operations and automation expand use in service delivery to improve scheduling and quality control at estimated: 30.0% adoption, 2024. AI-enabled workflows increase utilization to estimate: 55.0% adoption, 2034.
Regional Analysis: North America leads with more than 34.0% share, 2024 and records 1.4 billion USD revenue, 2024. The U.S. contributes 1.4 billion USD, 2024 and sustains 5.3% CAGR, 2024-2034.
By Type
Interior building cleaning remains the largest service category as the market moves into 2025, accounting for just over 22% of global revenue in 2024. You see this dominance across offices, healthcare facilities, education campuses, and residential complexes where hygiene standards directly influence occupancy rates, employee productivity, and regulatory compliance. High service frequency and contract-based delivery create steady recurring revenue, which keeps this segment structurally resilient even during economic slowdowns.
Outsourcing continues to reshape demand patterns. Organizations increasingly rely on third-party specialists rather than internal teams to control labor exposure and maintain consistent service quality. Industry surveys indicate that more than 60% of commercial properties globally outsource daily or weekly interior cleaning as of 2025. Adoption of automated scrubbers, sensor-based restroom monitoring, and low-chemical cleaning agents has reduced operating costs by an estimated 10–15% while meeting stricter indoor air quality and sanitation rules.
Regulatory pressure further supports long-term growth. Updated workplace safety and public health standards across North America and Europe now mandate documented cleaning protocols in offices, hospitals, and public buildings. These requirements increase contract durations and raise entry barriers, reinforcing the leading position of professional interior cleaning services.
By Application
Commercial buildings continue to represent the largest application segment, contributing more than 34% of total market revenue in 2024. You see stronger demand in office towers, retail centers, and mixed-use developments where maintenance complexity is higher and downtime carries financial risk. Large floor areas, high foot traffic, and complex mechanical systems drive consistent service requirements across cleaning, HVAC, and technical maintenance.
Compliance obligations intensify spending. Commercial properties face stricter fire safety, energy performance, and occupational health audits compared to residential buildings. As a result, annual maintenance budgets for commercial facilities are typically 25–40% higher per square meter than residential assets. Property owners prioritize preventive maintenance to protect asset value and reduce insurance exposure.
Sustainability programs also influence service selection. Energy-efficient HVAC servicing, water-saving cleaning practices, and waste reduction initiatives increasingly form part of maintenance contracts. By 2026, more than 45% of new commercial maintenance agreements are expected to include measurable energy or environmental performance targets.
By End-Use
Facility management companies remain the dominant end-user group, holding over 40% of market share in 2024. You benefit from their integrated service models that combine cleaning, technical maintenance, security, and compliance management under single contracts. This structure reduces coordination risk for property owners and improves service accountability.
Technology adoption strengthens their position. Building management systems, predictive maintenance software, and remote monitoring tools allow these companies to reduce equipment failures by an estimated 20–25%. Cost transparency and performance reporting appeal strongly to corporate clients and public institutions.
As buildings adopt smart controls and energy monitoring systems, reliance on specialized facility managers increases. This trend positions facility management companies to capture additional share through long-term contracts and multi-site portfolios beyond 2025.
By Region
North America leads the global market with more than 34% share and approximately USD 1.4 billion in revenue in 2024. You see strong demand supported by dense commercial infrastructure, high outsourcing penetration, and strict safety enforcement. The U.S. alone accounts for nearly the full regional total and is projected to expand at a 5.3% CAGR through 2034.
Europe follows with steady growth driven by retrofit activity and tightening energy performance rules. Asia Pacific shows the fastest expansion, supported by urban construction, rising commercial stock, and growing acceptance of outsourced maintenance. Markets such as India, China, and Southeast Asia are expected to post high single-digit growth as professional maintenance adoption accelerates.
Latin America and the Middle East and Africa remain smaller but attractive. Investments in hospitality, healthcare, and transport infrastructure are increasing service demand, particularly in the Gulf states and major urban centers. These regions present medium-term growth potential as regulatory frameworks and service standards mature.
By Type (Landscaping, Interior Building Cleaning, Pest Control, Exterior Building Cleaning, Street & Parking Lot Cleaning, Maintenance, Swimming Pool Cleaning, HVAC Maintenance, Elevator Maintenance, Security Services, Others), By Application (Residential Building, Commercial Building, Hotels and Resorts, Healthcare, Education, Others), By End-User (Facility Management Companies, Property Owners/Managers, Government Organizations, Outsourced Service Providers, Others), By Service Provider (In-House, Outsourced, Franchise)
Research Methodology
Primary Research- 100 Interviews of Stakeholders
Secondary Research
Desk Research
Regional scope
North America (United States, Canada, Mexico)
Latin America (Brazil, Argentina, Columbia)
East Asia And Pacific (China, Japan, South Korea, Australia, Cambodia, Fiji, Indonesia)
Sea And South Asia (India, Singapore, Thailand, Taiwan, Malaysia)
Eastern Europe (Poland, Russia, Czech Republic, Romania)
Western Europe (Germany, U.K., France, Spain, Itlay)
Middle East & Africa (GCC Countries, Egypt, Nigeria, South Africa, Israel)
Competitive Landscape
Power Climber, Zarafa Group Ltd, Heightsafe Systems Limited, Alimak Group, Sky Rider Equipment Inc, Akrobat Pte Ltd., Workplace Access Safety, FBA Gomyl, NSS Group, Jomy, Andrew Engineering, Other Key Players
Customization Scope
Customization for segments, region/country-level will be provided. Moreover, additional customization can be done based on the requirements.
Pricing and Purchase Options
Avail customized purchase options to meet your exact research needs. We have three licenses to opt for: Single User License, Multi-User License (Up to 5 Users), Corporate Use License (Unlimited User and Printable PDF).
TABLE OF CONTENTS
1. EXECUTIVE SUMMARY
1.1. MARKET SNAPSHOT
1.2. KEY FINDINGS & INSIGHTS
1.3. ANALYST RECOMMENDATIONS
1.4. FUTURE OUTLOOK
2. RESEARCH METHODOLOGY
2.1. MARKET DEFINITION & SCOPE
2.2. RESEARCH OBJECTIVES: PRIMARY & SECONDARY DATA SOURCES
2.3. DATA COLLECTION SOURCES
2.3.1. COVERAGE OF 100+ PRIMARY RESEARCH/CONSULTATION CALLS WITH INDUSTRY STAKEHOLDERS
FIGURE 17 NORTH AMERICA BUILDING MAINTENANCE SERVICESCURRENT AND FUTURE TYPE ANALYSIS, 2025–2034, (USD MILLION)
FIGURE 18 NORTH AMERICA BUILDING MAINTENANCE SERVICESCURRENT AND FUTURE END USER ANALYSIS, 2025–2034, (USD MILLION)
FIGURE 19 MARKET SHARE BY COUNTRY
FIGURE 20 LATIN AMERICA BUILDING MAINTENANCE SERVICESCURRENT AND FUTURE TYPE ANALYSIS, 2025–2034, (USD MILLION)
FIGURE 21 LATIN AMERICA BUILDING MAINTENANCE SERVICESCURRENT AND FUTURE END USER ANALYSIS, 2025–2034, (USD MILLION)
FIGURE 22 MARKET SHARE BY COUNTRY
FIGURE 23 EASTERN EUROPE BUILDING MAINTENANCE SERVICESCURRENT AND FUTURE TYPE ANALYSIS, 2025–2034, (USD MILLION)
FIGURE 24 EASTERN EUROPE BUILDING MAINTENANCE SERVICESCURRENT AND FUTURE END USER ANALYSIS, 2025–2034, (USD MILLION)
FIGURE 25 MARKET SHARE BY COUNTRY
FIGURE 26 WESTERN EUROPE BUILDING MAINTENANCE SERVICESCURRENT AND FUTURE TYPE ANALYSIS, 2025–2034, (USD MILLION)
FIGURE 27 WESTERN EUROPE BUILDING MAINTENANCE SERVICESCURRENT AND FUTURE END USER ANALYSIS, 2025–2034, (USD MILLION)
FIGURE 28 MARKET SHARE BY COUNTRY
FIGURE 29 EAST ASIA AND PACIFIC BUILDING MAINTENANCE SERVICESCURRENT AND FUTURE TYPE ANALYSIS, 2025–2034, (USD MILLION)
FIGURE 30 EAST ASIA AND PACIFIC BUILDING MAINTENANCE SERVICESCURRENT AND FUTURE END USER ANALYSIS, 2025–2034, (USD MILLION)
FIGURE 31 MARKET SHARE BY COUNTRY
FIGURE 32 SEA AND SOUTH ASIA BUILDING MAINTENANCE SERVICESCURRENT AND FUTURE TYPE ANALYSIS, 2025–2034, (USD MILLION)
FIGURE 33 SEA AND SOUTH ASIA BUILDING MAINTENANCE SERVICESCURRENT AND FUTURE END USER ANALYSIS, 2025–2034, (USD MILLION)
FIGURE 34 MARKET SHARE BY COUNTRY
FIGURE 35 MIDDLE EAST AND AFRICA BUILDING MAINTENANCE SERVICESCURRENT AND FUTURE TYPE ANALYSIS, 2025–2034, (USD MILLION)
FIGURE 36 MIDDLE EAST AND AFRICA BUILDING MAINTENANCE SERVICESCURRENT AND FUTURE END USER ANALYSIS, 2025–2034, (USD MILLION)
FIGURE 37 NORTH AMERICA BUILDING MAINTENANCE SERVICESCURRENT AND FUTURE MARKET VOLUME SHARE REGIONAL ANALYSIS, 2025–2034, (USD MILLION)
FIGURE 38 U.S. BUILDING MAINTENANCE SERVICESCURRENT AND FUTURE TYPE ANALYSIS, 2025–2034, (USD MILLION)
FIGURE 39 U.S. BUILDING MAINTENANCE SERVICESCURRENT AND FUTURE END USER ANALYSIS, 2025–2034, (USD MILLION)
FIGURE 40 CANADA BUILDING MAINTENANCE SERVICESCURRENT AND FUTURE TYPE ANALYSIS, 2025–2034, (USD MILLION)
FIGURE 41 CANADA BUILDING MAINTENANCE SERVICESCURRENT AND FUTURE END USER ANALYSIS, 2025–2034, (USD MILLION)
FIGURE 42 LATIN AMERICA BUILDING MAINTENANCE SERVICESCURRENT AND FUTURE MARKET VOLUME SHARE REGIONAL ANALYSIS, 2025–2034, (USD MILLION)
FIGURE 43 MEXICO BUILDING MAINTENANCE SERVICESCURRENT AND FUTURE TYPE ANALYSIS, 2025–2034, (USD MILLION)
FIGURE 44 MEXICO BUILDING MAINTENANCE SERVICESCURRENT AND FUTURE END USER ANALYSIS, 2025–2034, (USD MILLION)
FIGURE 45 BRAZIL BUILDING MAINTENANCE SERVICESCURRENT AND FUTURE TYPE ANALYSIS, 2025–2034, (USD MILLION)
FIGURE 46 BRAZIL BUILDING MAINTENANCE SERVICESCURRENT AND FUTURE END USER ANALYSIS, 2025–2034, (USD MILLION)
FIGURE 47 ARGENTINA BUILDING MAINTENANCE SERVICESCURRENT AND FUTURE TYPE ANALYSIS, 2025–2034, (USD MILLION)
FIGURE 48 ARGENTINA BUILDING MAINTENANCE SERVICESCURRENT AND FUTURE END USER ANALYSIS, 2025–2034, (USD MILLION)
FIGURE 49 COLUMBIA BUILDING MAINTENANCE SERVICESCURRENT AND FUTURE TYPE ANALYSIS, 2025–2034, (USD MILLION)
FIGURE 50 COLUMBIA BUILDING MAINTENANCE SERVICESCURRENT AND FUTURE END USER ANALYSIS, 2025–2034, (USD MILLION)
FIGURE 51 REST OF LATIN AMERICA BUILDING MAINTENANCE SERVICESCURRENT AND FUTURE TYPE ANALYSIS, 2025–2034, (USD MILLION)
FIGURE 52 REST OF LATIN AMERICA BUILDING MAINTENANCE SERVICESCURRENT AND FUTURE END USER ANALYSIS, 2025–2034, (USD MILLION)
FIGURE 53 EASTERN EUROPE BUILDING MAINTENANCE SERVICESCURRENT AND FUTURE MARKET VOLUME SHARE REGIONAL ANALYSIS, 2025–2034, (USD MILLION)
FIGURE 54 POLAND BUILDING MAINTENANCE SERVICESCURRENT AND FUTURE TYPE ANALYSIS, 2025–2034, (USD MILLION)
FIGURE 55 POLAND BUILDING MAINTENANCE SERVICESCURRENT AND FUTURE END USER ANALYSIS, 2025–2034, (USD MILLION)
FIGURE 56 RUSSIA BUILDING MAINTENANCE SERVICESCURRENT AND FUTURE TYPE ANALYSIS, 2025–2034, (USD MILLION)
FIGURE 57 RUSSIA BUILDING MAINTENANCE SERVICESCURRENT AND FUTURE END USER ANALYSIS, 2025–2034, (USD MILLION)
FIGURE 58 CZECH REPUBLIC BUILDING MAINTENANCE SERVICESCURRENT AND FUTURE TYPE ANALYSIS, 2025–2034, (USD MILLION)
FIGURE 59 CZECH REPUBLIC BUILDING MAINTENANCE SERVICESCURRENT AND FUTURE END USER ANALYSIS, 2025–2034, (USD MILLION)
FIGURE 60 ROMANIA BUILDING MAINTENANCE SERVICESCURRENT AND FUTURE TYPE ANALYSIS, 2025–2034, (USD MILLION)
FIGURE 61 ROMANIA BUILDING MAINTENANCE SERVICESCURRENT AND FUTURE END USER ANALYSIS, 2025–2034, (USD MILLION)
FIGURE 62 REST OF EASTERN EUROPE BUILDING MAINTENANCE SERVICESCURRENT AND FUTURE TYPE ANALYSIS, 2025–2034, (USD MILLION)
FIGURE 63 REST OF EASTERN EUROPE BUILDING MAINTENANCE SERVICESCURRENT AND FUTURE END USER ANALYSIS, 2025–2034, (USD MILLION)
FIGURE 64 WESTERN EUROPE BUILDING MAINTENANCE SERVICESCURRENT AND FUTURE MARKET VOLUME SHARE REGIONAL ANALYSIS, 2025–2034, (USD MILLION)
FIGURE 65 GERMANY BUILDING MAINTENANCE SERVICESCURRENT AND FUTURE TYPE ANALYSIS, 2025–2034, (USD MILLION)
FIGURE 66 GERMANY BUILDING MAINTENANCE SERVICESCURRENT AND FUTURE END USER ANALYSIS, 2025–2034, (USD MILLION)
FIGURE 67 FRANCE BUILDING MAINTENANCE SERVICESCURRENT AND FUTURE TYPE ANALYSIS, 2025–2034, (USD MILLION)
FIGURE 68 FRANCE BUILDING MAINTENANCE SERVICESCURRENT AND FUTURE END USER ANALYSIS, 2025–2034, (USD MILLION)
FIGURE 69 UK BUILDING MAINTENANCE SERVICESCURRENT AND FUTURE TYPE ANALYSIS, 2025–2034, (USD MILLION)
FIGURE 70 UK BUILDING MAINTENANCE SERVICESCURRENT AND FUTURE END USER ANALYSIS, 2025–2034, (USD MILLION)
FIGURE 71 SPAIN BUILDING MAINTENANCE SERVICESCURRENT AND FUTURE TYPE ANALYSIS, 2025–2034, (USD MILLION)
FIGURE 72 SPAIN BUILDING MAINTENANCE SERVICESCURRENT AND FUTURE END USER ANALYSIS, 2025–2034, (USD MILLION)
FIGURE 73 ITALY BUILDING MAINTENANCE SERVICESCURRENT AND FUTURE TYPE ANALYSIS, 2025–2034, (USD MILLION)
FIGURE 74 ITALY BUILDING MAINTENANCE SERVICESCURRENT AND FUTURE END USER ANALYSIS, 2025–2034, (USD MILLION)
FIGURE 75 REST OF WESTERN EUROPE BUILDING MAINTENANCE SERVICESCURRENT AND FUTURE TYPE ANALYSIS, 2025–2034, (USD MILLION)
FIGURE 76 REST OF WESTERN EUROPE BUILDING MAINTENANCE SERVICESCURRENT AND FUTURE END USER ANALYSIS, 2025–2034, (USD MILLION)
FIGURE 77 EAST ASIA AND PACIFIC BUILDING MAINTENANCE SERVICESCURRENT AND FUTURE MARKET VOLUME SHARE REGIONAL ANALYSIS, 2025–2034, (USD MILLION)
FIGURE 78 CHINA BUILDING MAINTENANCE SERVICESCURRENT AND FUTURE TYPE ANALYSIS, 2025–2034, (USD MILLION)
FIGURE 79 CHINA BUILDING MAINTENANCE SERVICESCURRENT AND FUTURE END USER ANALYSIS, 2025–2034, (USD MILLION)
FIGURE 80 JAPAN BUILDING MAINTENANCE SERVICESCURRENT AND FUTURE TYPE ANALYSIS, 2025–2034, (USD MILLION)
FIGURE 81 JAPAN BUILDING MAINTENANCE SERVICESCURRENT AND FUTURE END USER ANALYSIS, 2025–2034, (USD MILLION)
FIGURE 82 AUSTRALIA BUILDING MAINTENANCE SERVICESCURRENT AND FUTURE TYPE ANALYSIS, 2025–2034, (USD MILLION)
FIGURE 83 AUSTRALIA BUILDING MAINTENANCE SERVICESCURRENT AND FUTURE END USER ANALYSIS, 2025–2034, (USD MILLION)
FIGURE 84 CAMBODIA BUILDING MAINTENANCE SERVICESCURRENT AND FUTURE TYPE ANALYSIS, 2025–2034, (USD MILLION)
FIGURE 85 CAMBODIA BUILDING MAINTENANCE SERVICESCURRENT AND FUTURE END USER ANALYSIS, 2025–2034, (USD MILLION)
FIGURE 86 FIJI BUILDING MAINTENANCE SERVICESCURRENT AND FUTURE TYPE ANALYSIS, 2025–2034, (USD MILLION)
FIGURE 87 FIJI BUILDING MAINTENANCE SERVICESCURRENT AND FUTURE END USER ANALYSIS, 2025–2034, (USD MILLION)
FIGURE 88 INDONESIA BUILDING MAINTENANCE SERVICESCURRENT AND FUTURE TYPE ANALYSIS, 2025–2034, (USD MILLION)
FIGURE 89 INDONESIA BUILDING MAINTENANCE SERVICESCURRENT AND FUTURE END USER ANALYSIS, 2025–2034, (USD MILLION)
FIGURE 90 SOUTH KOREA BUILDING MAINTENANCE SERVICESCURRENT AND FUTURE TYPE ANALYSIS, 2025–2034, (USD MILLION)
FIGURE 91 SOUTH KOREA BUILDING MAINTENANCE SERVICESCURRENT AND FUTURE END USER ANALYSIS, 2025–2034, (USD MILLION)
FIGURE 92 REST OF EAST ASIA AND PACIFIC BUILDING MAINTENANCE SERVICESCURRENT AND FUTURE TYPE ANALYSIS, 2025–2034, (USD MILLION)
FIGURE 93 REST OF EAST ASIA AND PACIFIC BUILDING MAINTENANCE SERVICESCURRENT AND FUTURE END USER ANALYSIS, 2025–2034, (USD MILLION)
FIGURE 94 SEA AND SOUTH ASIA BUILDING MAINTENANCE SERVICESCURRENT AND FUTURE MARKET VOLUME SHARE REGIONAL ANALYSIS, 2025–2034, (USD MILLION)
FIGURE 95 BANGLADESH BUILDING MAINTENANCE SERVICESCURRENT AND FUTURE TYPE ANALYSIS, 2025–2034, (USD MILLION)
FIGURE 96 BANGLADESH BUILDING MAINTENANCE SERVICESCURRENT AND FUTURE END USER ANALYSIS, 2025–2034, (USD MILLION)
FIGURE 97 NEW ZEALAND BUILDING MAINTENANCE SERVICESCURRENT AND FUTURE TYPE ANALYSIS, 2025–2034, (USD MILLION)
FIGURE 98 NEW ZEALAND BUILDING MAINTENANCE SERVICESCURRENT AND FUTURE END USER ANALYSIS, 2025–2034, (USD MILLION)
FIGURE 99 INDIA BUILDING MAINTENANCE SERVICESCURRENT AND FUTURE TYPE ANALYSIS, 2025–2034, (USD MILLION)
FIGURE 100 INDIA BUILDING MAINTENANCE SERVICESCURRENT AND FUTURE END USER ANALYSIS, 2025–2034, (USD MILLION)
FIGURE 101 SINGAPORE BUILDING MAINTENANCE SERVICESCURRENT AND FUTURE TYPE ANALYSIS, 2025–2034, (USD MILLION)
FIGURE 102 SINGAPORE BUILDING MAINTENANCE SERVICESCURRENT AND FUTURE END USER ANALYSIS, 2025–2034, (USD MILLION)
FIGURE 103 THAILAND BUILDING MAINTENANCE SERVICESCURRENT AND FUTURE TYPE ANALYSIS, 2025–2034, (USD MILLION)
FIGURE 104 THAILAND BUILDING MAINTENANCE SERVICESCURRENT AND FUTURE END USER ANALYSIS, 2025–2034, (USD MILLION)
FIGURE 105 TAIWAN BUILDING MAINTENANCE SERVICESCURRENT AND FUTURE TYPE ANALYSIS, 2025–2034, (USD MILLION)
FIGURE 106 TAIWAN BUILDING MAINTENANCE SERVICESCURRENT AND FUTURE END USER ANALYSIS, 2025–2034, (USD MILLION)
FIGURE 107 MALAYSIA BUILDING MAINTENANCE SERVICESCURRENT AND FUTURE TYPE ANALYSIS, 2025–2034, (USD MILLION)
FIGURE 108 MALAYSIA BUILDING MAINTENANCE SERVICESCURRENT AND FUTURE END USER ANALYSIS, 2025–2034, (USD MILLION)
FIGURE 109 REST OF SEA AND SOUTH ASIA BUILDING MAINTENANCE SERVICESCURRENT AND FUTURE TYPE ANALYSIS, 2025–2034, (USD MILLION)
FIGURE 110 REST OF SEA AND SOUTH ASIA BUILDING MAINTENANCE SERVICESCURRENT AND FUTURE END USER ANALYSIS, 2025–2034, (USD MILLION)
FIGURE 111 MIDDLE EAST AND AFRICA BUILDING MAINTENANCE SERVICESCURRENT AND FUTURE MARKET VOLUME SHARE REGIONAL ANALYSIS, 2025–2034, (USD MILLION)
FIGURE 112 GCC COUNTRIES BUILDING MAINTENANCE SERVICESCURRENT AND FUTURE TYPE ANALYSIS, 2025–2034, (USD MILLION)
FIGURE 113 GCC COUNTRIES BUILDING MAINTENANCE SERVICESCURRENT AND FUTURE END USER ANALYSIS, 2025–2034, (USD MILLION)
FIGURE 114 SAUDI ARABIA BUILDING MAINTENANCE SERVICESCURRENT AND FUTURE TYPE ANALYSIS, 2025–2034, (USD MILLION)
FIGURE 115 SAUDI ARABIA BUILDING MAINTENANCE SERVICESCURRENT AND FUTURE END USER ANALYSIS, 2025–2034, (USD MILLION)
FIGURE 116 UAE BUILDING MAINTENANCE SERVICESCURRENT AND FUTURE TYPE ANALYSIS, 2025–2034, (USD MILLION)
FIGURE 117 UAE BUILDING MAINTENANCE SERVICESCURRENT AND FUTURE END USER ANALYSIS, 2025–2034, (USD MILLION)
FIGURE 118 BAHRAIN BUILDING MAINTENANCE SERVICESCURRENT AND FUTURE TYPE ANALYSIS, 2025–2034, (USD MILLION)
FIGURE 119 BAHRAIN BUILDING MAINTENANCE SERVICESCURRENT AND FUTURE END USER ANALYSIS, 2025–2034, (USD MILLION)
FIGURE 120 KUWAIT BUILDING MAINTENANCE SERVICESCURRENT AND FUTURE TYPE ANALYSIS, 2025–2034, (USD MILLION)
FIGURE 121 KUWAIT BUILDING MAINTENANCE SERVICESCURRENT AND FUTURE END USER ANALYSIS, 2025–2034, (USD MILLION)
FIGURE 122 OMAN BUILDING MAINTENANCE SERVICESCURRENT AND FUTURE TYPE ANALYSIS, 2025–2034, (USD MILLION)
FIGURE 123 OMAN BUILDING MAINTENANCE SERVICESCURRENT AND FUTURE END USER ANALYSIS, 2025–2034, (USD MILLION)
FIGURE 124 QATAR BUILDING MAINTENANCE SERVICESCURRENT AND FUTURE TYPE ANALYSIS, 2025–2034, (USD MILLION)
FIGURE 125 QATAR BUILDING MAINTENANCE SERVICESCURRENT AND FUTURE END USER ANALYSIS, 2025–2034, (USD MILLION)
FIGURE 126 EGYPT BUILDING MAINTENANCE SERVICESCURRENT AND FUTURE TYPE ANALYSIS, 2025–2034, (USD MILLION)
FIGURE 127 EGYPT BUILDING MAINTENANCE SERVICESCURRENT AND FUTURE END USER ANALYSIS, 2025–2034, (USD MILLION)
FIGURE 128 NIGERIA BUILDING MAINTENANCE SERVICESCURRENT AND FUTURE TYPE ANALYSIS, 2025–2034, (USD MILLION)
FIGURE 129 NIGERIA BUILDING MAINTENANCE SERVICESCURRENT AND FUTURE END USER ANALYSIS, 2025–2034, (USD MILLION)
FIGURE 130 SOUTH AFRICA BUILDING MAINTENANCE SERVICESCURRENT AND FUTURE TYPE ANALYSIS, 2025–2034, (USD MILLION)
FIGURE 131 SOUTH AFRICA BUILDING MAINTENANCE SERVICESCURRENT AND FUTURE END USER ANALYSIS, 2025–2034, (USD MILLION)
FIGURE 132 ISRAEL BUILDING MAINTENANCE SERVICESCURRENT AND FUTURE TYPE ANALYSIS, 2025–2034, (USD MILLION)
FIGURE 133 ISRAEL BUILDING MAINTENANCE SERVICESCURRENT AND FUTURE END USER ANALYSIS, 2025–2034, (USD MILLION)
FIGURE 134 REST OF MEA BUILDING MAINTENANCE SERVICESCURRENT AND FUTURE TYPE ANALYSIS, 2025–2034, (USD MILLION)
FIGURE 135 REST OF MEA BUILDING MAINTENANCE SERVICESCURRENT AND FUTURE END USER ANALYSIS, 2025–2034, (USD MILLION)
FIGURE 136 U. S. MARKET SHARE ANALYSIS BY TYPE (2024)
FIGURE 137 U. S. MARKET SHARE ANALYSIS BY END USER (2024)
FIGURE 138 CANADA MARKET SHARE ANALYSIS BY TYPE (2024)
FIGURE 139 CANADA MARKET SHARE ANALYSIS BY END USER (2024)
FIGURE 140 MEXICO MARKET SHARE ANALYSIS BY TYPE (2024)
FIGURE 141 MEXICO MARKET SHARE ANALYSIS BY END USER (2024)
FIGURE 142 CHINA MARKET SHARE ANALYSIS BY TYPE (2024)
FIGURE 143 CHINA MARKET SHARE ANALYSIS BY END USER (2024)
FIGURE 144 JAPAN MARKET SHARE ANALYSIS BY TYPE (2024)
FIGURE 145 JAPAN MARKET SHARE ANALYSIS BY END USER (2024)
FIGURE 146 INDIA MARKET SHARE ANALYSIS BY TYPE (2024)
FIGURE 147 INDIA MARKET SHARE ANALYSIS BY END USER (2024)
FIGURE 148 SOUTH KOREA MARKET SHARE ANALYSIS BY TYPE (2024)
FIGURE 149 SOUTH KOREA MARKET SHARE ANALYSIS BY END USER (2024)
FIGURE 150 SAUDI ARABIA MARKET SHARE ANALYSIS BY TYPE (2024)
FIGURE 151 SAUDI ARABIA MARKET SHARE ANALYSIS BY END USER (2024)
FIGURE 152 UAE MARKET SHARE ANALYSIS BY TYPE (2024)
FIGURE 153 UAE MARKET SHARE ANALYSIS BY END USER (2024)
FIGURE 154 EGYPT MARKET SHARE ANALYSIS BY TYPE (2024)
FIGURE 155 EGYPT MARKET SHARE ANALYSIS BY END USER (2024)
FIGURE 156 NIGERIA MARKET SHARE ANALYSIS BY TYPE (2024)
FIGURE 157 NIGERIA MARKET SHARE ANALYSIS BY END USER (2024)
FIGURE 158 SOUTH AFRICA MARKET SHARE ANALYSIS BY TYPE (2024)
FIGURE 159 SOUTH AFRICA MARKET SHARE ANALYSIS BY END USER (2024)
FIGURE 160 GERMANY MARKET SHARE ANALYSIS BY TYPE (2024)
FIGURE 161 GERMANY MARKET SHARE ANALYSIS BY END USER (2024)
FIGURE 162 FRANCE MARKET SHARE ANALYSIS BY TYPE (2024)
FIGURE 163 FRANCE MARKET SHARE ANALYSIS BY END USER (2024)
FIGURE 164 UK MARKET SHARE ANALYSIS BY TYPE (2024)
FIGURE 165 UK MARKET SHARE ANALYSIS BY END USER (2024)
FIGURE 166 SPAIN MARKET SHARE ANALYSIS BY TYPE (2024)
FIGURE 167 SPAIN MARKET SHARE ANALYSIS BY END USER (2024)
FIGURE 168 ITALY MARKET SHARE ANALYSIS BY TYPE (2024)
FIGURE 169 ITALY MARKET SHARE ANALYSIS BY END USER (2024)
FIGURE 170 BRAZIL MARKET SHARE ANALYSIS BY TYPE (2024)
FIGURE 171 BRAZIL MARKET SHARE ANALYSIS BY END USER (2024)
FIGURE 172 ARGENTINA MARKET SHARE ANALYSIS BY TYPE (2024)
FIGURE 173 ARGENTINA MARKET SHARE ANALYSIS BY END USER (2024)
FIGURE 174 COLUMBIA MARKET SHARE ANALYSIS BY TYPE (2024)
FIGURE 175 COLUMBIA MARKET SHARE ANALYSIS BY END USER (2024)
FIGURE 176 GLOBAL BUILDING MAINTENANCE SERVICESCURRENT AND FUTURE MARKET KEY COUNTRY LEVEL ANALYSIS, 2024–2034, (USD MILLION)
FIGURE 177 FINANCIAL OVERVIEW:
Key Player Analysis
Alimak Group: Alimak Group positions itself as a challenger with strong specialization in vertical access and permanent building access solutions that support maintenance, facade cleaning, and repair activities. Its product portfolio includes permanent and temporary building maintenance units, mast climbers, and access platforms used across high-rise commercial and industrial assets. In 2025, the company benefits from sustained demand for safe access systems in dense urban markets, particularly in Europe, North America, and the Middle East. Building owners increasingly require compliant access infrastructure to meet safety audits and reduce liability exposure.
Strategically, Alimak Group continues to expand service-based offerings around installation, inspection, and lifecycle maintenance of access systems. Recurring service revenue now represents an estimated 35–40% of its building-related business. The company differentiates through long equipment lifecycles, strong safety certifications, and deep penetration in premium commercial towers and infrastructure projects. Its focus on retrofitting older buildings aligns with aging urban stock and supports steady mid-single-digit growth through the forecast period.
Andrew Engineering: Andrew Engineering operates as a niche player focused on specialized mechanical and HVAC-related maintenance solutions for complex buildings. Its core services support heating, ventilation, cooling, and mechanical system performance in commercial and industrial facilities. In 2025, rising energy costs and stricter emissions rules increase demand for technical maintenance providers with system-level expertise. The company’s positioning centers on performance reliability rather than broad facilities coverage.
The firm emphasizes engineering-led maintenance and custom service contracts for data centers, manufacturing sites, and large office campuses. Andrew Engineering invests steadily in diagnostic tools and technician training to reduce equipment failure rates and extend asset life. Its customer base values uptime and compliance over cost minimization, which supports stable margins. Regional strength in North America anchors revenue, with selective expansion into Asia Pacific industrial hubs underway.
FBA Gomyl: FBA Gomyl holds a strong niche position in facade access and exterior building maintenance equipment. Its suspended platforms and building maintenance units support cleaning, inspection, and repair of high-rise structures. In 2025, growth remains tied to urban vertical development and stricter facade safety regulations. The company serves commercial towers, hotels, and public infrastructure where exterior maintenance frequency remains high.
Strategic priorities focus on geographic expansion and product standardization to support faster deployment and lower installation times. FBA Gomyl differentiates through engineering customization and long-term service agreements tied to installed equipment. An estimated 45% of new orders now include multi-year maintenance contracts, improving revenue visibility. Its presence in Europe and the Middle East positions the company well as high-rise construction and retrofit activity continues beyond 2025.
Market Key Players
Power Climber
Zarafa Group Ltd
Heightsafe Systems Limited
Alimak Group
Sky Rider Equipment Inc
Akrobat Pte Ltd.
Workplace Access Safety
FBA Gomyl
NSS Group
Jomy
Andrew Engineering
Other Key Players
Driver:
Rising Energy Costs Reshaping Maintenance Priorities
As of 2025, energy intensity and operating costs shape maintenance budgets across commercial and institutional buildings. You face sustained pressure from higher electricity prices, tighter emissions rules, and mandatory performance reporting. Buildings account for roughly 30–35% of global energy use, which keeps efficiency at the center of asset strategy. Maintenance contracts increasingly focus on HVAC tuning, equipment calibration, and energy monitoring rather than reactive repairs.
Building Management Systems Driving Contract Stability
Building management systems now sit at the core of this shift. Adoption across large commercial assets exceeds an estimated 55% in North America and Europe in 2025. These systems give you visibility into consumption patterns and system drift. Maintenance providers that support energy-focused outcomes see higher renewal rates and longer contract terms. This driver supports steady market expansion near an 8% CAGR through 2034 as efficiency-linked services gain priority.
Restraint:
High Upfront Capital Requirements for Advanced Systems
High upfront costs continue to limit adoption of advanced maintenance solutions. You often face capital requirements that range from USD 3 to 7 per square foot for system upgrades tied to energy monitoring, controls, or automation. For small and mid-sized property owners, these costs delay decision-making even when long-term savings are clear.
Extended Payback Periods Limiting Broader Adoption
The payback period remains a concern. Energy-focused upgrades typically require three to five years to recover costs, which clashes with shorter ownership or lease cycles. This restraint slows penetration outside premium commercial assets and keeps adoption uneven across regions. As a result, near-term growth depends heavily on large portfolios and regulated sectors rather than the full building stock.
Opportunity:
5G-Enabled Predictive Maintenance Expansion
5G deployment opens a clear growth path for maintenance services after 2025. Global 5G coverage now reaches more than 45% of urban buildings, with enterprise adoption accelerating in Asia Pacific and North America. Faster data transfer allows dense sensor networks and real-time diagnostics across HVAC, elevators, and electrical systems.
Performance-Based, High-Margin Service Models
For you, this enables predictive maintenance at scale. Service providers can detect faults early, cut unplanned downtime by an estimated 20–30%, and extend asset life. Providers that align offerings with 5G-enabled monitoring can move into higher-margin contracts tied to uptime and performance. This opportunity supports incremental revenue expansion of an estimated USD 1.2–1.5 billion globally by 2030.
Trend:
IoT-Driven Smart Maintenance Transformation
Smart building integration defines current service models. IoT-enabled monitoring now appears in more than 40% of new commercial maintenance contracts signed in 2025. You gain continuous visibility into asset health, which shifts maintenance from fixed schedules to condition-based execution.
Sustainability and Robotics Redefining Service Delivery
Sustainability practices also shape purchasing decisions. Use of low-chemical cleaning, energy-efficient equipment, and waste reduction protocols rises across healthcare, offices, and hospitality. Robotics adoption grows alongside labor shortages. Autonomous cleaning machines now handle an estimated 18–22% of large-floor-area cleaning tasks globally. This trend reshapes workforce planning while improving service consistency and cost control.
Recent Developments
Dec 2024 – CBRE Group: CBRE expanded its integrated facilities management platform with enhanced energy monitoring and predictive maintenance modules across North America and Europe, covering more than 120 million square feet of managed space. The move strengthens CBRE’s position in performance-based maintenance contracts tied to energy compliance and asset uptime.
Feb 2025 – ISS A/S: ISS announced the acquisition of a regional technical maintenance provider in Southeast Asia, valued at over USD 85 million, adding HVAC and electrical maintenance capabilities across logistics parks and commercial campuses. This acquisition expands ISS’s footprint in high-growth urban markets and deepens technical service depth.
Apr 2025 – Sodexo: Sodexo launched a digital maintenance management suite integrating IoT sensors and remote diagnostics for healthcare and education clients, with pilot adoption across 300+ sites globally. The rollout improves service predictability and supports long-term contracts in regulated end-use segments.
Jul 2025 – Johnson Controls: Johnson Controls partnered with a major real estate investment trust in the U.S. to deploy AI-supported building management systems across a portfolio exceeding 40 million square feet. The collaboration positions the company as a preferred provider for smart maintenance tied to emissions reporting and cost control.
Sep 2025 – Mitie Group: Mitie secured a multi-year government facilities maintenance contract in the UK valued at approximately USD 420 million, covering public offices, transport hubs, and defense facilities. The contract reinforces Mitie’s standing in large-scale outsourced maintenance and stabilizes revenue visibility through 2030.
Nov 2025 – EMCOR Group: EMCOR expanded its industrial maintenance operations into Mexico through a greenfield entry, targeting manufacturing plants and data centers with projected annual revenue of USD 150 million by 2028. The expansion diversifies geographic exposure and captures nearshoring-driven demand in North America’s extended supply chain.