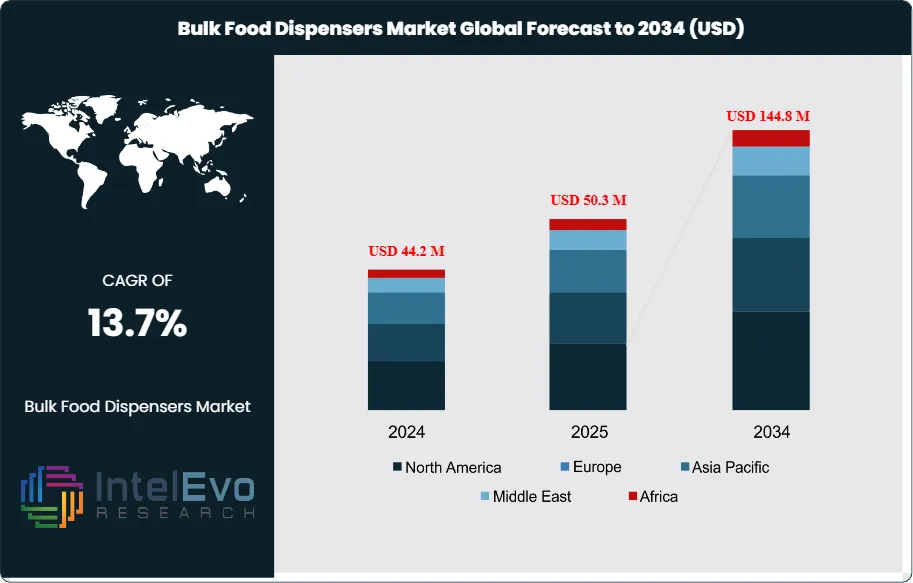
The Bulk Food Dispensers Market is estimated at USD 44.2 million in 2024 and is on track to reach roughly USD 144.8 million by 2034, implying a compound annual growth rate of 13.7% over 2024–2034. From a niche format a decade ago, the category is entering a scale-up phase as retailers, institutions, and foodservice operators adopt gravity and scoop dispensers for cereals, grains, pulses, nuts, and snacks. The market’s value is set to more than triple (3.3x) over the forecast horizon, underpinned by sustainability mandates, packaging-waste reduction goals, and the economics of bulk merchandising. Industry pilots indicate bulk programs can meaningfully cut single-use packaging volumes and reduce product shrink, while improving SKU visibility and replenishment efficiency—benefits that translate into stronger sell-through and margin resilience in high-inflation environments.
Demand-side momentum is reinforced by consumers’ rising preference for waste-light shopping and price transparency, while on the supply side, improvements in dispenser design (modular footprints, tamper-evident closures, food-grade materials) and standardized sanitation protocols are addressing historical concerns around hygiene and cross-contamination. Challenges remain: upfront capex for retrofits, staff training, and variability in store traffic can slow rollout cadence; materials costs and quality control in components such as food-grade polycarbonate and stainless steel also require careful vendor selection and long-term service agreements.
Technology is accelerating adoption. Smart dispensers with IoT sensors enable real-time inventory monitoring, automated planogram compliance, and refill alerts; integration with POS and handheld apps supports frictionless tare-and-weigh checkout. Emerging AI use cases—demand forecasting at bin level, loss-detection from flow anomalies, and dynamic space optimization—are lifting labor productivity and reducing out-of-stocks.
Regionally, North America and Europe currently lead, together accounting for roughly 55–60% of 2024 revenues, driven by zero-waste retail formats and retailer ESG targets. Asia–Pacific is the fastest-growing region (mid-teens CAGR), with India a standout. India’s food processing sector contributes 1.69% to national GVA, and policy support is deepening: the Ministry of Food Processing Industries’ ₹3,290-crore allocation for 2024–25 (+30.19% YoY) strengthens cold-chain and processing infrastructure; the PLISFPI reimburses up to 50% of international branding spends (capped at ₹50 crore per year); and PMKSY targets ₹31,400 crore in leveraged investment, benefiting ~20 lakh farmers and creating 5+ lakh jobs. Strong wheat procurement—2.08 million metric tons since March 15, 2025, up 44.4% year over year—underscores supply stability. Investment hotspots include modern trade, campus and corporate dining, and public distribution modernization in high-growth urban corridors across India and Southeast Asia.
Key Takeaways
Market Growth: The global Bulk Food Dispensers Market will expand from USD 44.2 Mn in 2024 to USD 144.8 Mn by 2034, a 13.7% CAGR (≈3.3x growth), propelled by sustainability mandates, packaging-waste reduction, and modern trade rollouts.
Technology: Gravity-fed systems lead with 57.3% share, reflecting lower product breakage, faster throughput, and fewer touchpoints versus scoop models—key advantages for high-traffic grocery aisles.
Material: Plastics account for 58.3% of units due to cost efficiency, light weight, and product visibility, while glass and stainless alternatives remain niche where premium aesthetics or stricter hygiene coding is required.
Driver: Organized retail adoption is accelerating—hypermarkets & supermarkets hold 48.3% share—while retrofit-friendly formats (countertop at 46.3%) and smaller bins (up to 3 gallons at 46.3%) align with space constraints and frequent-turn dry categories.
Restraint: Upfront capex and sanitation compliance temper rollout; the continued presence of non-gravity solutions (42.7%) and non-plastic materials (41.7%) signals cost sensitivity and maintenance burdens that slow conversions, especially in independents.
Opportunity: Penetration white space outside the current leaders is sizable; capturing just 5 percentage points of the global market by 2034 equates to roughly USD 7.1 Mn in incremental revenue (5% of the USD 142.8 Mn TAM), with compact countertop and ≤3-gallon formats best positioned to win.
Trend: Mix is shifting toward compact, modular deployments—evidenced by countertop (46.3%) and ≤3-gallon (46.3%) shares—supporting micro-aisle “zero-waste” concepts and phased retrofits; suppliers are prioritizing modularity, tamper-evident closures, and food-grade polymers to standardize hygiene.
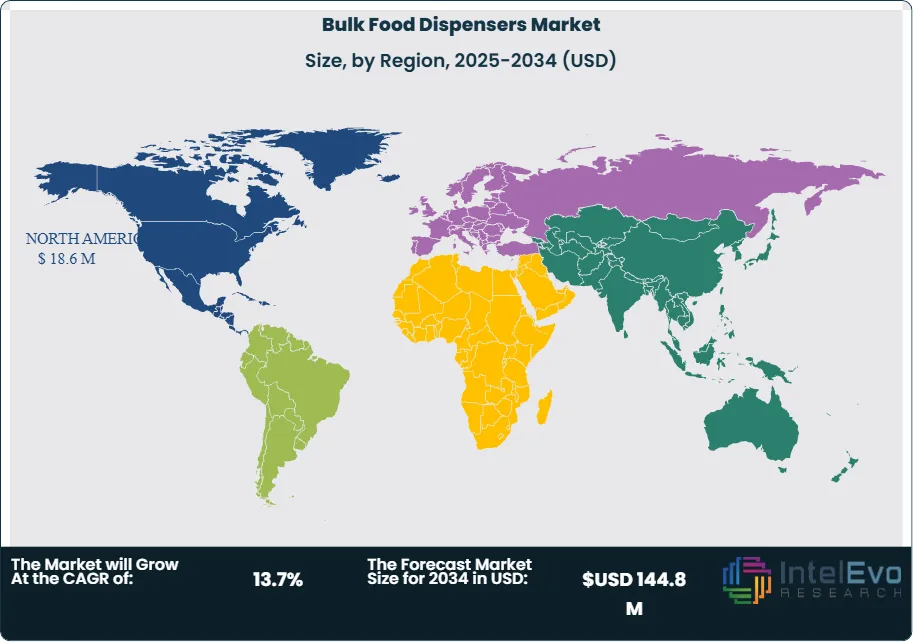
RegionalAnalysis: North America leads with 43.2% of 2024 revenue (≈USD 18.6 Mn), while the rest of the world represents 56.8% (≈USD 24.6 Mn); if shares were to hold constant, North America would scale to ~USD 61.8 Mn by 2034, underscoring both a durable core market and substantial international whitespace.
Type Analysis
Gravity-fed dispensers remain the industry’s anchor format entering 2025, accounting for an estimated 57.3% of 2024 shipments and sustaining leadership on the back of simpler mechanics, faster line speeds, and fewer touchpoints in-store. Their controlled flow reduces product breakage and shrink versus scoop-based systems, which continue to serve fragile SKUs (e.g., specialty confectionery) but face slower adoption in high-traffic aisles. Pre-packaged bulk dispensers—pre-portioned, refillable cartridges—are a smaller but rising niche, benefiting formats that prioritize hygiene, traceability, and labor-light replenishment, particularly in pharmacies, travel retail, and campus convenience.
Material and design choices reinforce this mix: plastics (polycarbonate, copolyester, ABS) represented roughly 58.3% of unit materials in 2024 due to impact resistance, optical clarity, and lower total cost of ownership. Vendors are adding tamper-evident closures, food-grade seals, and IoT-ready lids to gravity systems, enabling bin-level stock sensing, planogram compliance, and predictive refills—features increasingly specified by top grocery banners and cash-and-carry chains.
Application Analysis
Staple pantry categories—cereals, grains, pulses, rice, and dry beans—drive the highest throughput in modern trade, where gravity bins minimize handling and speed self-service. Premium and impulse lines (nuts, trail mixes, candy, granola, and specialty snacks) favor compact footprints that support frequent rotation and visual merchandising. Coffee and tea benefit from aroma-preserving valves and UV-resistant canisters, while pet food and baking ingredients (flour, sugar) rely on wider spouts and anti-bridging inserts to maintain consistent flow.
Capacity and placement correlate tightly with mix. ≤3-gallon units accounted for ~46.3% of 2024 deployments, aligning with higher-margin or fast-turn items that need smaller batches and fresher rotations; larger 3–6+ gallon bins continue to anchor staples where velocity and price transparency matter most. Countertop positioning (46.3% share in 2024) supports impulse categories at service counters and endcaps, whereas wall-mounted arrays and floor-standing gondolas optimize staple aisles and back-of-house replenishment.
End-Use Analysis
Hypermarkets and supermarkets are the primary demand engine, holding about 48.3% share in 2024 as chains expand zero-waste aisles and private-label bulk programs to cut packaging and improve price perception. General retail (organic stores, refilleries, drugstores) is broadening category width—often starting with snacks and coffee—while foodservice (corporate cafeterias, universities, QSR salad/ice-cream toppings) deploys closed systems to manage portion control and hygiene. Residential adoption is nascent but growing in premium kitchen and co-living formats, aided by compact, modular dispensers and online D2C kits.
Operationally, retailers prioritize solutions that compress labor minutes per refill and standardize sanitation. This is accelerating the shift to modular cartridges, bin-level sensors, and POS-integrated tare workflows, which collectively reduce out-of-stocks, improve shrink control, and lift conversion in fresh-adjacent aisles.
Regional Analysis
North America entered 2025 as the largest regional market with ~43.2% revenue share in 2024 (≈USD 18.6 million), supported by mature modern trade, ESG targets, and strong uptake of touchless features. Europe follows with dense urban refillery ecosystems and retailer plastics pacts driving sustained rollouts, though regulatory complexity and store-labor constraints favor modular, service-light systems. Asia Pacific is the fastest-growing region (double-digit CAGR through 2034), led by organized retail expansion and government programs that strengthen food processing and distribution infrastructure—India’s policy push and modern trade growth are particularly supportive of bulk formats.
Latin America and the Middle East & Africa are emerging opportunity corridors where cash-and-carry and value banners are piloting bulk to sharpen price points and reduce secondary packaging. Across all regions, 2025–2030 investment themes center on hygiene-by-design, bin telemetry, and adaptable footprints (countertop, wall-mounted, and floor-standing) that let retailers scale from pilot bays to full-aisle conversions while protecting capex and labor budgets.
By Material Type (Plastics, Metal, Glass), By Type (Gravity-fed, Scoop bins, Pre-Packaged Bulk Food Dispenser), By Installation Type (Countertop, Wall-Mounted, Floor-Standing), By Capacity (Up to 3 Gallon, 3 to 6 Gallon, Above 6 Gallon), By End-user (Hypermarkets & Supermarkets, Retail Stores, Food Service, Residential)
Research Methodology
Primary Research- 100 Interviews of Stakeholders
Secondary Research
Desk Research
Regional scope
North America (United States, Canada, Mexico)
Latin America (Brazil, Argentina, Columbia)
East Asia And Pacific (China, Japan, South Korea, Australia, Cambodia, Fiji, Indonesia)
Sea And South Asia (India, Singapore, Thailand, Taiwan, Malaysia)
Eastern Europe (Poland, Russia, Czech Republic, Romania)
Western Europe (Germany, U.K., France, Spain, Itlay)
Middle East & Africa (GCC Countries, Egypt, Nigeria, South Africa, Israel)
Competitive Landscape
Server Products Inc, Rosseto Serving Solutions, Joalpe International UK, Hubert Company, LLC, BestBins, Jiangxi Eco Technology Group Co., Ltd., Cal-Mil, Nestlé S.A., Food Dispense, Lipton, Danone, Akriform Plast AB, IDM LTD, Purcell, Hangzhou Fulinde Display Manufacturer, Other Key Players
Customization Scope
Customization for segments, region/country-level will be provided. Moreover, additional customization can be done based on the requirements.
Pricing and Purchase Options
Avail customized purchase options to meet your exact research needs. We have three licenses to opt for: Single User License, Multi-User License (Up to 5 Users), Corporate Use License (Unlimited User and Printable PDF).
TABLE OF CONTENTS
1. EXECUTIVE SUMMARY
1.1. MARKET SNAPSHOT
1.2. KEY FINDINGS & INSIGHTS
1.3. ANALYST RECOMMENDATIONS
1.4. FUTURE OUTLOOK
2. RESEARCH METHODOLOGY
2.1. MARKET DEFINITION & SCOPE
2.2. RESEARCH OBJECTIVES: PRIMARY & SECONDARY DATA SOURCES
2.3. DATA COLLECTION SOURCES
2.3.1. COVERAGE OF 100+ PRIMARY RESEARCH/CONSULTATION CALLS WITH INDUSTRY STAKEHOLDERS
FIGURE 17 NORTH AMERICA BULK FOOD DISPENSERS CURRENT AND FUTURE TYPE ANALYSIS, 2025–2034, (USD MILLION)
FIGURE 18 NORTH AMERICA BULK FOOD DISPENSERS CURRENT AND FUTURE END USER ANALYSIS, 2025–2034, (USD MILLION)
FIGURE 19 MARKET SHARE BY COUNTRY
FIGURE 20 LATIN AMERICA BULK FOOD DISPENSERS CURRENT AND FUTURE TYPE ANALYSIS, 2025–2034, (USD MILLION)
FIGURE 21 LATIN AMERICA BULK FOOD DISPENSERS CURRENT AND FUTURE END USER ANALYSIS, 2025–2034, (USD MILLION)
FIGURE 22 MARKET SHARE BY COUNTRY
FIGURE 23 EASTERN EUROPE BULK FOOD DISPENSERS CURRENT AND FUTURE TYPE ANALYSIS, 2025–2034, (USD MILLION)
FIGURE 24 EASTERN EUROPE BULK FOOD DISPENSERS CURRENT AND FUTURE END USER ANALYSIS, 2025–2034, (USD MILLION)
FIGURE 25 MARKET SHARE BY COUNTRY
FIGURE 26 WESTERN EUROPE BULK FOOD DISPENSERS CURRENT AND FUTURE TYPE ANALYSIS, 2025–2034, (USD MILLION)
FIGURE 27 WESTERN EUROPE BULK FOOD DISPENSERS CURRENT AND FUTURE END USER ANALYSIS, 2025–2034, (USD MILLION)
FIGURE 28 MARKET SHARE BY COUNTRY
FIGURE 29 EAST ASIA AND PACIFIC BULK FOOD DISPENSERS CURRENT AND FUTURE TYPE ANALYSIS, 2025–2034, (USD MILLION)
FIGURE 30 EAST ASIA AND PACIFIC BULK FOOD DISPENSERS CURRENT AND FUTURE END USER ANALYSIS, 2025–2034, (USD MILLION)
FIGURE 31 MARKET SHARE BY COUNTRY
FIGURE 32 SEA AND SOUTH ASIA BULK FOOD DISPENSERS CURRENT AND FUTURE TYPE ANALYSIS, 2025–2034, (USD MILLION)
FIGURE 33 SEA AND SOUTH ASIA BULK FOOD DISPENSERS CURRENT AND FUTURE END USER ANALYSIS, 2025–2034, (USD MILLION)
FIGURE 34 MARKET SHARE BY COUNTRY
FIGURE 35 MIDDLE EAST AND AFRICA BULK FOOD DISPENSERS CURRENT AND FUTURE TYPE ANALYSIS, 2025–2034, (USD MILLION)
FIGURE 36 MIDDLE EAST AND AFRICA BULK FOOD DISPENSERS CURRENT AND FUTURE END USER ANALYSIS, 2025–2034, (USD MILLION)
FIGURE 37 NORTH AMERICA BULK FOOD DISPENSERS CURRENT AND FUTURE MARKET VOLUME SHARE REGIONAL ANALYSIS, 2025–2034, (USD MILLION)
FIGURE 38 U.S. BULK FOOD DISPENSERS CURRENT AND FUTURE TYPE ANALYSIS, 2025–2034, (USD MILLION)
FIGURE 39 U.S. BULK FOOD DISPENSERS CURRENT AND FUTURE END USER ANALYSIS, 2025–2034, (USD MILLION)
FIGURE 40 CANADA BULK FOOD DISPENSERS CURRENT AND FUTURE TYPE ANALYSIS, 2025–2034, (USD MILLION)
FIGURE 41 CANADA BULK FOOD DISPENSERS CURRENT AND FUTURE END USER ANALYSIS, 2025–2034, (USD MILLION)
FIGURE 42 LATIN AMERICA BULK FOOD DISPENSERS CURRENT AND FUTURE MARKET VOLUME SHARE REGIONAL ANALYSIS, 2025–2034, (USD MILLION)
FIGURE 43 MEXICO BULK FOOD DISPENSERS CURRENT AND FUTURE TYPE ANALYSIS, 2025–2034, (USD MILLION)
FIGURE 44 MEXICO BULK FOOD DISPENSERS CURRENT AND FUTURE END USER ANALYSIS, 2025–2034, (USD MILLION)
FIGURE 45 BRAZIL BULK FOOD DISPENSERS CURRENT AND FUTURE TYPE ANALYSIS, 2025–2034, (USD MILLION)
FIGURE 46 BRAZIL BULK FOOD DISPENSERS CURRENT AND FUTURE END USER ANALYSIS, 2025–2034, (USD MILLION)
FIGURE 47 ARGENTINA BULK FOOD DISPENSERS CURRENT AND FUTURE TYPE ANALYSIS, 2025–2034, (USD MILLION)
FIGURE 48 ARGENTINA BULK FOOD DISPENSERS CURRENT AND FUTURE END USER ANALYSIS, 2025–2034, (USD MILLION)
FIGURE 49 COLUMBIA BULK FOOD DISPENSERS CURRENT AND FUTURE TYPE ANALYSIS, 2025–2034, (USD MILLION)
FIGURE 50 COLUMBIA BULK FOOD DISPENSERS CURRENT AND FUTURE END USER ANALYSIS, 2025–2034, (USD MILLION)
FIGURE 51 REST OF LATIN AMERICA BULK FOOD DISPENSERS CURRENT AND FUTURE TYPE ANALYSIS, 2025–2034, (USD MILLION)
FIGURE 52 REST OF LATIN AMERICA BULK FOOD DISPENSERS CURRENT AND FUTURE END USER ANALYSIS, 2025–2034, (USD MILLION)
FIGURE 53 EASTERN EUROPE BULK FOOD DISPENSERS CURRENT AND FUTURE MARKET VOLUME SHARE REGIONAL ANALYSIS, 2025–2034, (USD MILLION)
FIGURE 54 POLAND BULK FOOD DISPENSERS CURRENT AND FUTURE TYPE ANALYSIS, 2025–2034, (USD MILLION)
FIGURE 55 POLAND BULK FOOD DISPENSERS CURRENT AND FUTURE END USER ANALYSIS, 2025–2034, (USD MILLION)
FIGURE 56 RUSSIA BULK FOOD DISPENSERS CURRENT AND FUTURE TYPE ANALYSIS, 2025–2034, (USD MILLION)
FIGURE 57 RUSSIA BULK FOOD DISPENSERS CURRENT AND FUTURE END USER ANALYSIS, 2025–2034, (USD MILLION)
FIGURE 58 CZECH REPUBLIC BULK FOOD DISPENSERS CURRENT AND FUTURE TYPE ANALYSIS, 2025–2034, (USD MILLION)
FIGURE 59 CZECH REPUBLIC BULK FOOD DISPENSERS CURRENT AND FUTURE END USER ANALYSIS, 2025–2034, (USD MILLION)
FIGURE 60 ROMANIA BULK FOOD DISPENSERS CURRENT AND FUTURE TYPE ANALYSIS, 2025–2034, (USD MILLION)
FIGURE 61 ROMANIA BULK FOOD DISPENSERS CURRENT AND FUTURE END USER ANALYSIS, 2025–2034, (USD MILLION)
FIGURE 62 REST OF EASTERN EUROPE BULK FOOD DISPENSERS CURRENT AND FUTURE TYPE ANALYSIS, 2025–2034, (USD MILLION)
FIGURE 63 REST OF EASTERN EUROPE BULK FOOD DISPENSERS CURRENT AND FUTURE END USER ANALYSIS, 2025–2034, (USD MILLION)
FIGURE 64 WESTERN EUROPE BULK FOOD DISPENSERS CURRENT AND FUTURE MARKET VOLUME SHARE REGIONAL ANALYSIS, 2025–2034, (USD MILLION)
FIGURE 65 GERMANY BULK FOOD DISPENSERS CURRENT AND FUTURE TYPE ANALYSIS, 2025–2034, (USD MILLION)
FIGURE 66 GERMANY BULK FOOD DISPENSERS CURRENT AND FUTURE END USER ANALYSIS, 2025–2034, (USD MILLION)
FIGURE 67 FRANCE BULK FOOD DISPENSERS CURRENT AND FUTURE TYPE ANALYSIS, 2025–2034, (USD MILLION)
FIGURE 68 FRANCE BULK FOOD DISPENSERS CURRENT AND FUTURE END USER ANALYSIS, 2025–2034, (USD MILLION)
FIGURE 69 UK BULK FOOD DISPENSERS CURRENT AND FUTURE TYPE ANALYSIS, 2025–2034, (USD MILLION)
FIGURE 70 UK BULK FOOD DISPENSERS CURRENT AND FUTURE END USER ANALYSIS, 2025–2034, (USD MILLION)
FIGURE 71 SPAIN BULK FOOD DISPENSERS CURRENT AND FUTURE TYPE ANALYSIS, 2025–2034, (USD MILLION)
FIGURE 72 SPAIN BULK FOOD DISPENSERS CURRENT AND FUTURE END USER ANALYSIS, 2025–2034, (USD MILLION)
FIGURE 73 ITALY BULK FOOD DISPENSERS CURRENT AND FUTURE TYPE ANALYSIS, 2025–2034, (USD MILLION)
FIGURE 74 ITALY BULK FOOD DISPENSERS CURRENT AND FUTURE END USER ANALYSIS, 2025–2034, (USD MILLION)
FIGURE 75 REST OF WESTERN EUROPE BULK FOOD DISPENSERS CURRENT AND FUTURE TYPE ANALYSIS, 2025–2034, (USD MILLION)
FIGURE 76 REST OF WESTERN EUROPE BULK FOOD DISPENSERS CURRENT AND FUTURE END USER ANALYSIS, 2025–2034, (USD MILLION)
FIGURE 77 EAST ASIA AND PACIFIC BULK FOOD DISPENSERS CURRENT AND FUTURE MARKET VOLUME SHARE REGIONAL ANALYSIS, 2025–2034, (USD MILLION)
FIGURE 78 CHINA BULK FOOD DISPENSERS CURRENT AND FUTURE TYPE ANALYSIS, 2025–2034, (USD MILLION)
FIGURE 79 CHINA BULK FOOD DISPENSERS CURRENT AND FUTURE END USER ANALYSIS, 2025–2034, (USD MILLION)
FIGURE 80 JAPAN BULK FOOD DISPENSERS CURRENT AND FUTURE TYPE ANALYSIS, 2025–2034, (USD MILLION)
FIGURE 81 JAPAN BULK FOOD DISPENSERS CURRENT AND FUTURE END USER ANALYSIS, 2025–2034, (USD MILLION)
FIGURE 82 AUSTRALIA BULK FOOD DISPENSERS CURRENT AND FUTURE TYPE ANALYSIS, 2025–2034, (USD MILLION)
FIGURE 83 AUSTRALIA BULK FOOD DISPENSERS CURRENT AND FUTURE END USER ANALYSIS, 2025–2034, (USD MILLION)
FIGURE 84 CAMBODIA BULK FOOD DISPENSERS CURRENT AND FUTURE TYPE ANALYSIS, 2025–2034, (USD MILLION)
FIGURE 85 CAMBODIA BULK FOOD DISPENSERS CURRENT AND FUTURE END USER ANALYSIS, 2025–2034, (USD MILLION)
FIGURE 86 FIJI BULK FOOD DISPENSERS CURRENT AND FUTURE TYPE ANALYSIS, 2025–2034, (USD MILLION)
FIGURE 87 FIJI BULK FOOD DISPENSERS CURRENT AND FUTURE END USER ANALYSIS, 2025–2034, (USD MILLION)
FIGURE 88 INDONESIA BULK FOOD DISPENSERS CURRENT AND FUTURE TYPE ANALYSIS, 2025–2034, (USD MILLION)
FIGURE 89 INDONESIA BULK FOOD DISPENSERS CURRENT AND FUTURE END USER ANALYSIS, 2025–2034, (USD MILLION)
FIGURE 90 SOUTH KOREA BULK FOOD DISPENSERS CURRENT AND FUTURE TYPE ANALYSIS, 2025–2034, (USD MILLION)
FIGURE 91 SOUTH KOREA BULK FOOD DISPENSERS CURRENT AND FUTURE END USER ANALYSIS, 2025–2034, (USD MILLION)
FIGURE 92 REST OF EAST ASIA AND PACIFIC BULK FOOD DISPENSERS CURRENT AND FUTURE TYPE ANALYSIS, 2025–2034, (USD MILLION)
FIGURE 93 REST OF EAST ASIA AND PACIFIC BULK FOOD DISPENSERS CURRENT AND FUTURE END USER ANALYSIS, 2025–2034, (USD MILLION)
FIGURE 94 SEA AND SOUTH ASIA BULK FOOD DISPENSERS CURRENT AND FUTURE MARKET VOLUME SHARE REGIONAL ANALYSIS, 2025–2034, (USD MILLION)
FIGURE 95 BANGLADESH BULK FOOD DISPENSERS CURRENT AND FUTURE TYPE ANALYSIS, 2025–2034, (USD MILLION)
FIGURE 96 BANGLADESH BULK FOOD DISPENSERS CURRENT AND FUTURE END USER ANALYSIS, 2025–2034, (USD MILLION)
FIGURE 97 NEW ZEALAND BULK FOOD DISPENSERS CURRENT AND FUTURE TYPE ANALYSIS, 2025–2034, (USD MILLION)
FIGURE 98 NEW ZEALAND BULK FOOD DISPENSERS CURRENT AND FUTURE END USER ANALYSIS, 2025–2034, (USD MILLION)
FIGURE 99 INDIA BULK FOOD DISPENSERS CURRENT AND FUTURE TYPE ANALYSIS, 2025–2034, (USD MILLION)
FIGURE 100 INDIA BULK FOOD DISPENSERS CURRENT AND FUTURE END USER ANALYSIS, 2025–2034, (USD MILLION)
FIGURE 101 SINGAPORE BULK FOOD DISPENSERS CURRENT AND FUTURE TYPE ANALYSIS, 2025–2034, (USD MILLION)
FIGURE 102 SINGAPORE BULK FOOD DISPENSERS CURRENT AND FUTURE END USER ANALYSIS, 2025–2034, (USD MILLION)
FIGURE 103 THAILAND BULK FOOD DISPENSERS CURRENT AND FUTURE TYPE ANALYSIS, 2025–2034, (USD MILLION)
FIGURE 104 THAILAND BULK FOOD DISPENSERS CURRENT AND FUTURE END USER ANALYSIS, 2025–2034, (USD MILLION)
FIGURE 105 TAIWAN BULK FOOD DISPENSERS CURRENT AND FUTURE TYPE ANALYSIS, 2025–2034, (USD MILLION)
FIGURE 106 TAIWAN BULK FOOD DISPENSERS CURRENT AND FUTURE END USER ANALYSIS, 2025–2034, (USD MILLION)
FIGURE 107 MALAYSIA BULK FOOD DISPENSERS CURRENT AND FUTURE TYPE ANALYSIS, 2025–2034, (USD MILLION)
FIGURE 108 MALAYSIA BULK FOOD DISPENSERS CURRENT AND FUTURE END USER ANALYSIS, 2025–2034, (USD MILLION)
FIGURE 109 REST OF SEA AND SOUTH ASIA BULK FOOD DISPENSERS CURRENT AND FUTURE TYPE ANALYSIS, 2025–2034, (USD MILLION)
FIGURE 110 REST OF SEA AND SOUTH ASIA BULK FOOD DISPENSERS CURRENT AND FUTURE END USER ANALYSIS, 2025–2034, (USD MILLION)
FIGURE 111 MIDDLE EAST AND AFRICA BULK FOOD DISPENSERS CURRENT AND FUTURE MARKET VOLUME SHARE REGIONAL ANALYSIS, 2025–2034, (USD MILLION)
FIGURE 112 GCC COUNTRIES BULK FOOD DISPENSERS CURRENT AND FUTURE TYPE ANALYSIS, 2025–2034, (USD MILLION)
FIGURE 113 GCC COUNTRIES BULK FOOD DISPENSERS CURRENT AND FUTURE END USER ANALYSIS, 2025–2034, (USD MILLION)
FIGURE 114 SAUDI ARABIA BULK FOOD DISPENSERS CURRENT AND FUTURE TYPE ANALYSIS, 2025–2034, (USD MILLION)
FIGURE 115 SAUDI ARABIA BULK FOOD DISPENSERS CURRENT AND FUTURE END USER ANALYSIS, 2025–2034, (USD MILLION)
FIGURE 116 UAE BULK FOOD DISPENSERS CURRENT AND FUTURE TYPE ANALYSIS, 2025–2034, (USD MILLION)
FIGURE 117 UAE BULK FOOD DISPENSERS CURRENT AND FUTURE END USER ANALYSIS, 2025–2034, (USD MILLION)
FIGURE 118 BAHRAIN BULK FOOD DISPENSERS CURRENT AND FUTURE TYPE ANALYSIS, 2025–2034, (USD MILLION)
FIGURE 119 BAHRAIN BULK FOOD DISPENSERS CURRENT AND FUTURE END USER ANALYSIS, 2025–2034, (USD MILLION)
FIGURE 120 KUWAIT BULK FOOD DISPENSERS CURRENT AND FUTURE TYPE ANALYSIS, 2025–2034, (USD MILLION)
FIGURE 121 KUWAIT BULK FOOD DISPENSERS CURRENT AND FUTURE END USER ANALYSIS, 2025–2034, (USD MILLION)
FIGURE 122 OMAN BULK FOOD DISPENSERS CURRENT AND FUTURE TYPE ANALYSIS, 2025–2034, (USD MILLION)
FIGURE 123 OMAN BULK FOOD DISPENSERS CURRENT AND FUTURE END USER ANALYSIS, 2025–2034, (USD MILLION)
FIGURE 124 QATAR BULK FOOD DISPENSERS CURRENT AND FUTURE TYPE ANALYSIS, 2025–2034, (USD MILLION)
FIGURE 125 QATAR BULK FOOD DISPENSERS CURRENT AND FUTURE END USER ANALYSIS, 2025–2034, (USD MILLION)
FIGURE 126 EGYPT BULK FOOD DISPENSERS CURRENT AND FUTURE TYPE ANALYSIS, 2025–2034, (USD MILLION)
FIGURE 127 EGYPT BULK FOOD DISPENSERS CURRENT AND FUTURE END USER ANALYSIS, 2025–2034, (USD MILLION)
FIGURE 128 NIGERIA BULK FOOD DISPENSERS CURRENT AND FUTURE TYPE ANALYSIS, 2025–2034, (USD MILLION)
FIGURE 129 NIGERIA BULK FOOD DISPENSERS CURRENT AND FUTURE END USER ANALYSIS, 2025–2034, (USD MILLION)
FIGURE 130 SOUTH AFRICA BULK FOOD DISPENSERS CURRENT AND FUTURE TYPE ANALYSIS, 2025–2034, (USD MILLION)
FIGURE 131 SOUTH AFRICA BULK FOOD DISPENSERS CURRENT AND FUTURE END USER ANALYSIS, 2025–2034, (USD MILLION)
FIGURE 132 ISRAEL BULK FOOD DISPENSERS CURRENT AND FUTURE TYPE ANALYSIS, 2025–2034, (USD MILLION)
FIGURE 133 ISRAEL BULK FOOD DISPENSERS CURRENT AND FUTURE END USER ANALYSIS, 2025–2034, (USD MILLION)
FIGURE 134 REST OF MEA BULK FOOD DISPENSERS CURRENT AND FUTURE TYPE ANALYSIS, 2025–2034, (USD MILLION)
FIGURE 135 REST OF MEA BULK FOOD DISPENSERS CURRENT AND FUTURE END USER ANALYSIS, 2025–2034, (USD MILLION)
FIGURE 136 U. S. MARKET SHARE ANALYSIS BY TYPE (2024)
FIGURE 137 U. S. MARKET SHARE ANALYSIS BY END USER (2024)
FIGURE 138 CANADA MARKET SHARE ANALYSIS BY TYPE (2024)
FIGURE 139 CANADA MARKET SHARE ANALYSIS BY END USER (2024)
FIGURE 140 MEXICO MARKET SHARE ANALYSIS BY TYPE (2024)
FIGURE 141 MEXICO MARKET SHARE ANALYSIS BY END USER (2024)
FIGURE 142 CHINA MARKET SHARE ANALYSIS BY TYPE (2024)
FIGURE 143 CHINA MARKET SHARE ANALYSIS BY END USER (2024)
FIGURE 144 JAPAN MARKET SHARE ANALYSIS BY TYPE (2024)
FIGURE 145 JAPAN MARKET SHARE ANALYSIS BY END USER (2024)
FIGURE 146 INDIA MARKET SHARE ANALYSIS BY TYPE (2024)
FIGURE 147 INDIA MARKET SHARE ANALYSIS BY END USER (2024)
FIGURE 148 SOUTH KOREA MARKET SHARE ANALYSIS BY TYPE (2024)
FIGURE 149 SOUTH KOREA MARKET SHARE ANALYSIS BY END USER (2024)
FIGURE 150 SAUDI ARABIA MARKET SHARE ANALYSIS BY TYPE (2024)
FIGURE 151 SAUDI ARABIA MARKET SHARE ANALYSIS BY END USER (2024)
FIGURE 152 UAE MARKET SHARE ANALYSIS BY TYPE (2024)
FIGURE 153 UAE MARKET SHARE ANALYSIS BY END USER (2024)
FIGURE 154 EGYPT MARKET SHARE ANALYSIS BY TYPE (2024)
FIGURE 155 EGYPT MARKET SHARE ANALYSIS BY END USER (2024)
FIGURE 156 NIGERIA MARKET SHARE ANALYSIS BY TYPE (2024)
FIGURE 157 NIGERIA MARKET SHARE ANALYSIS BY END USER (2024)
FIGURE 158 SOUTH AFRICA MARKET SHARE ANALYSIS BY TYPE (2024)
FIGURE 159 SOUTH AFRICA MARKET SHARE ANALYSIS BY END USER (2024)
FIGURE 160 GERMANY MARKET SHARE ANALYSIS BY TYPE (2024)
FIGURE 161 GERMANY MARKET SHARE ANALYSIS BY END USER (2024)
FIGURE 162 FRANCE MARKET SHARE ANALYSIS BY TYPE (2024)
FIGURE 163 FRANCE MARKET SHARE ANALYSIS BY END USER (2024)
FIGURE 164 UK MARKET SHARE ANALYSIS BY TYPE (2024)
FIGURE 165 UK MARKET SHARE ANALYSIS BY END USER (2024)
FIGURE 166 SPAIN MARKET SHARE ANALYSIS BY TYPE (2024)
FIGURE 167 SPAIN MARKET SHARE ANALYSIS BY END USER (2024)
FIGURE 168 ITALY MARKET SHARE ANALYSIS BY TYPE (2024)
FIGURE 169 ITALY MARKET SHARE ANALYSIS BY END USER (2024)
FIGURE 170 BRAZIL MARKET SHARE ANALYSIS BY TYPE (2024)
FIGURE 171 BRAZIL MARKET SHARE ANALYSIS BY END USER (2024)
FIGURE 172 ARGENTINA MARKET SHARE ANALYSIS BY TYPE (2024)
FIGURE 173 ARGENTINA MARKET SHARE ANALYSIS BY END USER (2024)
FIGURE 174 COLUMBIA MARKET SHARE ANALYSIS BY TYPE (2024)
FIGURE 175 COLUMBIA MARKET SHARE ANALYSIS BY END USER (2024)
FIGURE 176 GLOBAL BULK FOOD DISPENSERS CURRENT AND FUTURE MARKET KEY COUNTRY LEVEL ANALYSIS, 2024–2034, (USD MILLION)
FIGURE 177 FINANCIAL OVERVIEW:
Key Player Analysis
Danone: Danone positions itself as a global sustainability leader in the bulk food ecosystem, leveraging its strong presence in dairy, plant-based, and packaged foods to align with refill and waste-reduction strategies. By 2025, the company has accelerated partnerships with retail chains across Europe and North America to pilot bulk dispenser programs for cereals, dairy powders, and infant nutrition products, linking directly to its long-term ESG commitments. Danone differentiates itself through its “One Planet. One Health.” framework, using bulk systems as a practical extension of its sustainability agenda. With revenues exceeding USD 30 billion globally, the company is actively exploring IoT-enabled dispensers for freshness and traceability, strengthening its position as both a consumer brand and a systems innovator in bulk dispensing.
Nestlé S.A.: Nestlé is a market leader and innovator, leveraging its vast product portfolio—including coffee, confectionery, and cereals—to scale bulk dispenser adoption. The company has piloted refill stations for brands such as Nescafé and KitKat in multiple geographies, reporting waste reductions of up to 30% in pilot stores. In 2025, Nestlé is doubling down on digital integration, embedding QR codes and refill-tracking apps that reward consumers with loyalty incentives. With annual revenues exceeding USD 100 billion and a strong presence in over 180 countries, Nestlé’s differentiator lies in its scale and global retail partnerships, enabling rapid deployment of sustainable bulk solutions. The company’s heavy investment in R&D, including touchless and smart dispensing technologies, positions it to maintain leadership as consumer expectations around hygiene and transparency intensify.
Lipton: Lipton, under the Unilever portfolio until its carve-out into Ekaterra, operates as a niche yet influential player in the beverage and tea categories. By 2025, Lipton has integrated bulk dispensing for teas and herbal infusions in supermarkets and specialty stores, aligning with the rising consumer demand for customizable blends and sustainable retail formats. Its strategic focus has been on customization and consumer engagement, allowing shoppers to mix varieties directly in-store—a move that resonates strongly with younger demographics seeking personalized, eco-conscious experiences. Lipton’s differentiator lies in its brand equity and category specialization, which allow it to command loyalty in the competitive beverage segment while testing modular dispenser formats in both Europe and Asia.
Rosseto Serving Solutions: Rosseto stands out as a specialized equipment manufacturer and disruptor in the bulk food dispensers market, focusing exclusively on dispenser technology rather than branded food. Its product line spans gravity-fed, scoop bins, and modular countertop systems, widely adopted by supermarkets, hotels, and foodservice providers. As of 2025, the company is investing heavily in smart dispenser design, embedding IoT sensors for inventory tracking, anti-bridging features to prevent clogging, and touchless systems to meet post-pandemic hygiene expectations. Unlike food giants, Rosseto’s competitive edge lies in its design innovation and B2B focus, serving as a preferred partner for retailers modernizing their bulk aisles. Its footprint is particularly strong in North America and Europe, with expansion opportunities in Asia Pacific as modern retail formats scale up.
Market Key Players
Server Products Inc
Rosseto Serving Solutions
Joalpe International UK
Hubert Company, LLC
BestBins
Jiangxi Eco Technology Group Co., Ltd.
Cal-Mil
Nestlé S.A.
Food Dispense
Lipton
Danone
Akriform Plast AB
IDM LTD
Purcell
Hangzhou Fulinde Display Manufacturer
Other Key Players
Driver:
Sustainability Initiatives and Zero-Waste Retail Driving Market Growth
As of 2025, the bulk food dispensers market is experiencing accelerated adoption, driven by sustainability commitments and waste reduction targets across modern retail. With the global market valued at USD 43.2 million in 2024 and projected to grow at a robust CAGR of 12.7% through 2034, retailers are increasingly prioritizing zero-waste aisles and refill stations to align with evolving consumer expectations. Gravity-fed dispensers, which account for over 57% of installations, have become critical enablers of this transition by reducing food handling, extending product shelf life, and lowering packaging costs. For investors, this demand surge signals expanding revenue streams across both staple food categories and premium snack assortments, positioning dispenser manufacturers to capture share through innovation and scalability.
Restraint:
High Capital Costs and Operational Challenges Limiting Market Expansion
Despite strong growth momentum, high upfront capital expenditure and operational challenges remain key restraints to large-scale adoption. Outfitting a full supermarket aisle with modular dispenser systems can cost significantly more than conventional shelving, creating barriers for smaller retailers and value-driven formats. Additionally, maintaining hygiene standards and ensuring compliance with food safety regulations requires staff training, frequent sanitation, and standardized protocols—factors that add to operating costs and slow rollout velocity. As a result, while hypermarkets and tier-1 retailers are pushing forward, penetration in smaller regional outlets remains limited, constraining overall market acceleration in the short term.
Opportunity:
Strong Growth Opportunities Emerging in Asia Pacific and Smart Dispenser Technologies
The most compelling opportunity lies in Asia Pacific, which is projected to deliver mid-teens CAGR growth over the next decade. Rapid urbanization, expansion of organized retail, and government-backed food distribution reforms are fueling demand for compact, ≤3-gallon countertop dispensers that suit both hypermarkets and convenience-driven formats. India’s retail modernization and policy investments in food processing, coupled with Southeast Asia’s rising middle class, are expected to generate incremental revenues exceeding USD 25 million by 2030. Beyond geography, technology-enabled dispensers with IoT connectivity and AI-driven inventory management represent an emerging high-margin growth avenue, offering suppliers the chance to differentiate and command premium pricing.
Trend:
Smart, IoT-Enabled Dispensing Systems Shaping the Future of Bulk Food Retail
A defining trend reshaping the market in 2025 is the shift toward smart dispensing systems. Leading retailers in North America and Europe are piloting IoT-enabled units capable of real-time stock monitoring, automated refill alerts, and integration with POS systems to streamline tare-and-weigh checkouts. Touchless dispensing, accelerated by post-pandemic hygiene concerns, is becoming a baseline requirement, while modular cartridge designs are reducing labor intensity and enhancing scalability across store formats. Together, these innovations are moving bulk food dispensers beyond cost-saving tools into strategic assets that enhance operational efficiency, shopper experience, and brand ESG positioning—signaling that digitalization and sustainability will increasingly converge as the industry standard.
Recent Developments
Dec 2024 – Rosseto Serving Solutions: Rolled out its new Skycap modular dispensing line, including gravity-fed cereal bins and countertop snack dispensers, across its key North American hospitality account base. This launch strengthens Rosseto’s product portfolio in modular, hygienic dispenser solutions and positions the company to gain share in eco- and design-conscious segments.
Feb 2025 – Nestlé S.A.: Announced a pilot program for smart bulk-dispensing refill stations in select European supermarkets, integrating IoT sensors and mobile scanning for product freshness and consumer loyalty tracking. By doing so, Nestlé aims to boost traceability, cut down spoilage by up to 15%, and deepen customer engagement in competitive retail environments.
Apr 2025 – Hubert Company, LLC: Expanded its manufacturing footprint for dry-food bulk dispensers with a new facility in Asia Pacific, increasing capacity by roughly 25%. This geographic expansion allows the company to better serve rapidly growing demand in APAC markets and achieve lower lead times for retailers in that region.
Jul 2025 – BestBins: Entered a strategic partnership with a major organic retail chain to supply acrylic and copolyester bulk food dispensers built with tamper-evident lids and touchless dispensing operation. Early deployment covers over 150 stores, and initial feedback shows an adoption rate lift of ~20% in bulk snack categories. This partnership underlines BestBins’ shift from a niche to a more scalable, hygiene- and sustainability-focused market position.
Sep 2025 – Jiangxi Eco Technology Group Co., Ltd.: Launched an R&D initiative to develop bio-based, food-grade plastics for bulk dispensers, targeting at least 30% reduction in CO₂ emissions per unit compared to standard ABS/plastic models. This move aligns with increasing regulatory pressure and consumer demand for greener materials, giving Jiangxi a potential differentiator in both cost and ESG metrics.