Bulk Material Handling System Market Size & Forecast 2034 | CAGR 4.7%
Global Bulk Material Handling System Market Size, Share, Analysis By Product (Conveyor Belts, Case Conveyors, Pallet Conveyors, Stackers, Reclaimers, Elevators), By Application (3PL, E-Commerce, General Merchandise, Food Retail, Food & Beverage, Manufacturing, Pharmaceutical/Healthcare), By Sales Channel (Manufacturers, Distributors) Industry Region & Key Players – Industry Segment Overview, Market Dynamics, Automation Trends & Forecast 2025–2034
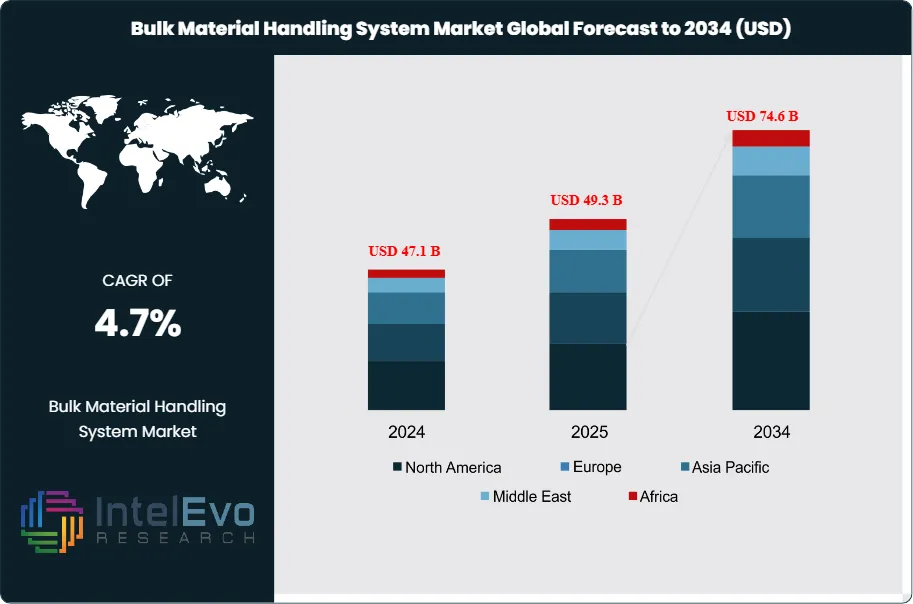
The Bulk Material Handling System Market was valued at approximately USD 47.1 billion in 2024 and is projected to reach nearly USD 74.6 billion by 2034, reflecting steady expansion across industrial, mining, construction, and manufacturing sectors. Based on the projected growth trajectory, the market size for 2025 is estimated at around USD 49.3 billion. Beginning in 2026, the market is expected to grow at a compound annual growth rate (CAGR) of about 4.7% from 2026 to 2034, ultimately reaching an estimated valuation of approximately USD 74.6 billion by 2034.
Demand concentrates in mining, ports and terminals, agriculture, construction, and power generation, where operators move high volumes of ores, coal, grains, aggregates, and other commodities. Systems integrate conveyors, stacker-reclaimers, ship loaders, cranes, feeders, and storage solutions into automated, continuous material flow networks.
Structural demand-side momentum remains strong. Rising global commodity trade, projected to add more than USD 350 billion in goods and services value in 2024, increases throughput requirements at mines, ports, and logistics hubs. High-capacity systems already account for an estimated 55% of new installations, as operators shift from labor-intensive handling toward continuous, enclosed, and higher-speed conveying. On the supply side, leading OEMs expand modular platforms and localized manufacturing to shorten lead times and address project-specific engineering requirements.
Technology reshapes competitive positioning. Automation-ready and digitally enabled systems represent roughly 35% of 2024 revenue and could exceed 50% by 2030. Vendors embed AI-based analytics for predictive maintenance, intelligent routing, and dynamic load optimization, which can reduce unplanned downtime by 15–25% and energy consumption by up to 10%. Digital twins and IIoT connectivity support real-time monitoring across dispersed assets, allowing operators to centralize control rooms and tighten integration with warehouse management and terminal operating systems.
Regulation and risk factors also influence capital allocation. Stricter safety codes and occupational health requirements push operators toward enclosed conveyors, dust suppression, and advanced collision-avoidance solutions. Energy-efficiency and emissions policies in Europe and parts of Asia encourage the adoption of variable-frequency drives and regenerative braking. At the same time, project pipelines face risks from commodity price volatility, permitting delays, and supply chain disruptions in critical components such as drives, bearings, and electronic controls, which can extend project timelines and pressure margins.
Regional dynamics shape the next wave of investment hotspots. Asia Pacific is expected to command about 40% of global revenue in 2024, supported by large-scale mining, port expansion, and industrial infrastructure in China, India, and Southeast Asia. North America and Europe together hold roughly 45%, underpinned by modernization of aging assets and automation upgrades. Emerging corridors in the Middle East, Africa, and Latin America, particularly in bulk terminals and greenfield mining projects, present attractive opportunities for differentiated, high-efficiency, and digitally integrated systems over the coming decade.
Key Takeaways
Market Growth: The bulk material handling system market records a size of 47.1 billion USD, 2024 and is projected to reach 74.6 billion USD, 2034, reflecting a 4.7% CAGR, 2024-2034.
Segment Dominance: Conveyor belts lead the product segment with a 34.8% revenue share, 2024, anchored in their efficiency for high-throughput material transport within the 47.1 billion USD market, 2024.
Segment Dominance: Manufacturers dominate the sales channel with a 68.2% share, 2024, as industrial buyers prioritize direct procurement for large-scale systems within the 47.1 billion USD market, 2024.
Driver: Rapid expansion of online retail acts as a core demand driver, with e-commerce applications contributing 21.2% of system demand, 2024 and supporting the market’s rise toward 74.6 billion USD, 2034.
Restraint: High upfront investment and integration complexity constrain adoption, with estimated: 8.0 billion USD, 2024 in deferred or postponed projects across capital-intensive end-user industries and pressure on smaller buyers.
Opportunity: Vendors capture a growing opportunity in value-added automation and lifecycle services, with estimated: 6.5 billion USD, 2034 in incremental revenue potential tied to upgrades of conveyor, warehousing, and port handling assets.
Trend: The channel mix continues to favor direct and digital-first ordering, as manufacturers’ 68.2% share, 2024 evolves toward more integrated digital platforms targeting estimated: 72.0% channel share, 2034 for combined direct and online models.
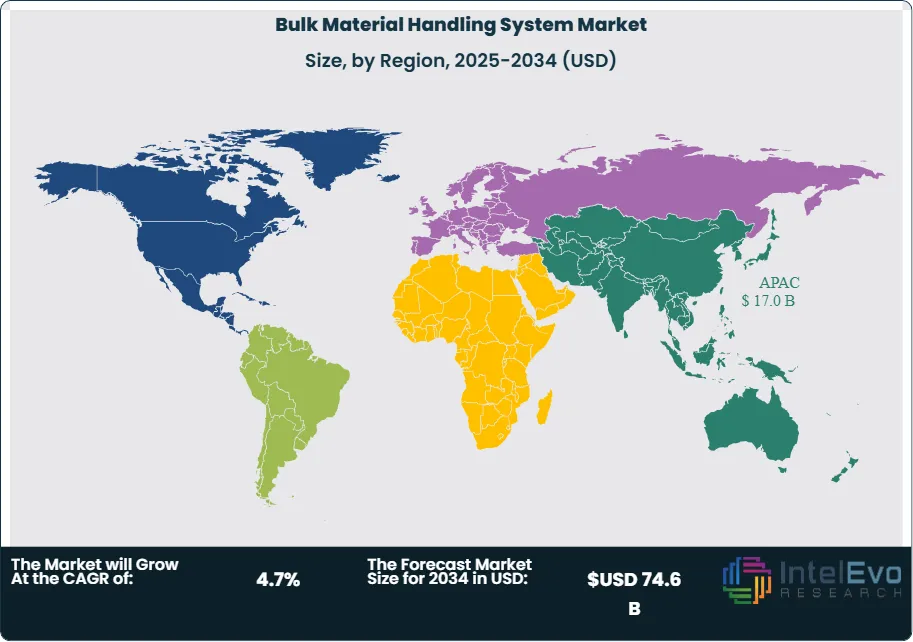
Regional Analysis: APAC stands out as the core regional demand hub with a 36.1% share of global revenue, 2024 and market value of 17.0 billion USD, 2024, with industrial and infrastructure projects positioning the region to reach estimated: 24.0 billion USD, 2034.
By Type
The market continues to shift toward high throughput material handling equipment in 2025 as demand from mining, manufacturing, and port operations increases. Stackers and stacker cum reclaimers remain central to large-volume storage yards. Their installed base expands steadily, particularly in iron ore and coal facilities, where operators prioritize consistent discharge rates and controlled material flow. Band conveyors account for a substantial share of new installations. They support continuous transport at lower operating costs, which positions them as a preferred option for facilities handling grains, aggregates, and packaged products.
Bucket wheel excavators and stripping shovels retain strong relevance in large mines. Their capacity to remove overburden at scale drives uptake in regions expanding open-pit operations. Rope shovels complement this segment by offering high mechanical reliability in harsh environments. Bucket elevators continue to gain traction in vertical transport applications across cement plants and industrial processing. Ship loaders and unloaders record rising adoption as port operators increase berth handling capacity to match growth in bulk commodity trade volumes. Industry assessments indicate that combined demand across these equipment types will expand at roughly 4.5 percent CAGR through 2034 as operators upgrade aging systems and automate material flow.
By Application
Mining remains the largest application area in 2025. Companies invest in higher-capacity machinery to support ore extraction and transport, particularly across Asia Pacific and Latin America. Construction firms expand their fleets of loaders, conveyors, and reclaiming equipment to meet rising demand for aggregates and raw materials. The packaging industry also increases adoption of automated conveying systems. It seeks to reduce manual handling and support faster throughput as order volumes rise.
Manufacturing facilities use stackers, elevators, and conveyors to support structured production flow and continuous processing. Sea ports and cargo terminals represent a fast-growing application. Operators upgrade ship loaders, unloaders, and yard conveyors to handle rising container and bulk cargo traffic. Market data suggests the ports segment will record some of the fastest growth from 2025 to 2034 as governments expand maritime infrastructure.
By End-Use
Residential construction drives consistent material flow needs, particularly in developing economies where new housing projects continue to scale. Bulk handling systems support the movement of cement, aggregates, and prefabricated materials within these sites. Commercial buildings create demand for mid-capacity equipment suited to large complexes, logistics hubs, and retail infrastructure. Operators prioritize equipment that supports predictable supply cycles and consistent site productivity.
Industrial buildings contribute the highest share of demand. These facilities rely on conveyors, elevators, and reclaiming equipment to maintain steady production lines across automotive, chemicals, metals processing, and food manufacturing. The expansion of high-volume industrial zones across Asia Pacific strengthens this segment’s long-term growth outlook.
By Region
North America records steady system upgrades in 2025 as companies replace legacy equipment to improve throughput and reliability. The United States remains the region’s anchor market due to its extensive mining, port, and industrial operations. Europe continues to prioritize automation and safety compliance. Demand rises in Germany, France, and the Nordic countries as operators integrate digital monitoring and energy-efficient conveying units into existing plants.
Asia Pacific holds the largest global share. China, India, and Japan remain the strongest contributors, supported by industrial expansion, major port developments, and large-volume mining operations. Latin America sees increased adoption of stackers and excavators in copper and iron ore mines. The Middle East and Africa show solid momentum. Large infrastructure projects, port expansions, and resource extraction activities position the region as an emerging growth center through 2034.
By Product (Conveyor Belts, Case Conveyors, Pallet Conveyors, Stackers, Reclaimers, Elevators, Others), By Application (3PL, E-commerce, General Merchandise, Food Retail, Food & Beverage, Manufacturing, Pharmaceutical/Healthcare), By Sales Channel (Manufacturers, Distributors)
Research Methodology
Primary Research- 100 Interviews of Stakeholders
Secondary Research
Desk Research
Regional scope
North America (United States, Canada, Mexico)
Latin America (Brazil, Argentina, Columbia)
East Asia And Pacific (China, Japan, South Korea, Australia, Cambodia, Fiji, Indonesia)
Sea And South Asia (India, Singapore, Thailand, Taiwan, Malaysia)
Eastern Europe (Poland, Russia, Czech Republic, Romania)
Western Europe (Germany, U.K., France, Spain, Itlay)
Middle East & Africa (GCC Countries, Egypt, Nigeria, South Africa, Israel)
Competitive Landscape
Beumer Group, TGW Logistics Group GmbH, Honeywell International Inc., Crown Equipment Corporation, Mitsubishi Electric Corporation, SSI Schaefer Group, Continental AG, Daifuku Co., Ltd., Jungheinrich AG, MHS Conveyor
Customization Scope
Customization for segments, region/country-level will be provided. Moreover, additional customization can be done based on the requirements.
Pricing and Purchase Options
Avail customized purchase options to meet your exact research needs. We have three licenses to opt for: Single User License, Multi-User License (Up to 5 Users), Corporate Use License (Unlimited User and Printable PDF).
TABLE OF CONTENTS
1. EXECUTIVE SUMMARY
1.1. MARKET SNAPSHOT
1.2. KEY FINDINGS & INSIGHTS
1.3. ANALYST RECOMMENDATIONS
1.4. FUTURE OUTLOOK
2. RESEARCH METHODOLOGY
2.1. MARKET DEFINITION & SCOPE
2.2. RESEARCH OBJECTIVES: PRIMARY & SECONDARY DATA SOURCES
2.3. DATA COLLECTION SOURCES
2.3.1. COVERAGE OF 100+ PRIMARY RESEARCH/CONSULTATION CALLS WITH INDUSTRY STAKEHOLDERS
FIGURE 17 NORTH AMERICA BULK MATERIAL HANDLING SYSTEMCURRENT AND FUTURE TYPE ANALYSIS, 2025–2034, (USD MILLION)
FIGURE 18 NORTH AMERICA BULK MATERIAL HANDLING SYSTEMCURRENT AND FUTURE END USER ANALYSIS, 2025–2034, (USD MILLION)
FIGURE 19 MARKET SHARE BY COUNTRY
FIGURE 20 LATIN AMERICA BULK MATERIAL HANDLING SYSTEMCURRENT AND FUTURE TYPE ANALYSIS, 2025–2034, (USD MILLION)
FIGURE 21 LATIN AMERICA BULK MATERIAL HANDLING SYSTEMCURRENT AND FUTURE END USER ANALYSIS, 2025–2034, (USD MILLION)
FIGURE 22 MARKET SHARE BY COUNTRY
FIGURE 23 EASTERN EUROPE BULK MATERIAL HANDLING SYSTEMCURRENT AND FUTURE TYPE ANALYSIS, 2025–2034, (USD MILLION)
FIGURE 24 EASTERN EUROPE BULK MATERIAL HANDLING SYSTEMCURRENT AND FUTURE END USER ANALYSIS, 2025–2034, (USD MILLION)
FIGURE 25 MARKET SHARE BY COUNTRY
FIGURE 26 WESTERN EUROPE BULK MATERIAL HANDLING SYSTEMCURRENT AND FUTURE TYPE ANALYSIS, 2025–2034, (USD MILLION)
FIGURE 27 WESTERN EUROPE BULK MATERIAL HANDLING SYSTEMCURRENT AND FUTURE END USER ANALYSIS, 2025–2034, (USD MILLION)
FIGURE 28 MARKET SHARE BY COUNTRY
FIGURE 29 EAST ASIA AND PACIFIC BULK MATERIAL HANDLING SYSTEMCURRENT AND FUTURE TYPE ANALYSIS, 2025–2034, (USD MILLION)
FIGURE 30 EAST ASIA AND PACIFIC BULK MATERIAL HANDLING SYSTEMCURRENT AND FUTURE END USER ANALYSIS, 2025–2034, (USD MILLION)
FIGURE 31 MARKET SHARE BY COUNTRY
FIGURE 32 SEA AND SOUTH ASIA BULK MATERIAL HANDLING SYSTEMCURRENT AND FUTURE TYPE ANALYSIS, 2025–2034, (USD MILLION)
FIGURE 33 SEA AND SOUTH ASIA BULK MATERIAL HANDLING SYSTEMCURRENT AND FUTURE END USER ANALYSIS, 2025–2034, (USD MILLION)
FIGURE 34 MARKET SHARE BY COUNTRY
FIGURE 35 MIDDLE EAST AND AFRICA BULK MATERIAL HANDLING SYSTEMCURRENT AND FUTURE TYPE ANALYSIS, 2025–2034, (USD MILLION)
FIGURE 36 MIDDLE EAST AND AFRICA BULK MATERIAL HANDLING SYSTEMCURRENT AND FUTURE END USER ANALYSIS, 2025–2034, (USD MILLION)
FIGURE 37 NORTH AMERICA BULK MATERIAL HANDLING SYSTEMCURRENT AND FUTURE MARKET VOLUME SHARE REGIONAL ANALYSIS, 2025–2034, (USD MILLION)
FIGURE 38 U.S. BULK MATERIAL HANDLING SYSTEMCURRENT AND FUTURE TYPE ANALYSIS, 2025–2034, (USD MILLION)
FIGURE 39 U.S. BULK MATERIAL HANDLING SYSTEMCURRENT AND FUTURE END USER ANALYSIS, 2025–2034, (USD MILLION)
FIGURE 40 CANADA BULK MATERIAL HANDLING SYSTEMCURRENT AND FUTURE TYPE ANALYSIS, 2025–2034, (USD MILLION)
FIGURE 41 CANADA BULK MATERIAL HANDLING SYSTEMCURRENT AND FUTURE END USER ANALYSIS, 2025–2034, (USD MILLION)
FIGURE 42 LATIN AMERICA BULK MATERIAL HANDLING SYSTEMCURRENT AND FUTURE MARKET VOLUME SHARE REGIONAL ANALYSIS, 2025–2034, (USD MILLION)
FIGURE 43 MEXICO BULK MATERIAL HANDLING SYSTEMCURRENT AND FUTURE TYPE ANALYSIS, 2025–2034, (USD MILLION)
FIGURE 44 MEXICO BULK MATERIAL HANDLING SYSTEMCURRENT AND FUTURE END USER ANALYSIS, 2025–2034, (USD MILLION)
FIGURE 45 BRAZIL BULK MATERIAL HANDLING SYSTEMCURRENT AND FUTURE TYPE ANALYSIS, 2025–2034, (USD MILLION)
FIGURE 46 BRAZIL BULK MATERIAL HANDLING SYSTEMCURRENT AND FUTURE END USER ANALYSIS, 2025–2034, (USD MILLION)
FIGURE 47 ARGENTINA BULK MATERIAL HANDLING SYSTEMCURRENT AND FUTURE TYPE ANALYSIS, 2025–2034, (USD MILLION)
FIGURE 48 ARGENTINA BULK MATERIAL HANDLING SYSTEMCURRENT AND FUTURE END USER ANALYSIS, 2025–2034, (USD MILLION)
FIGURE 49 COLUMBIA BULK MATERIAL HANDLING SYSTEMCURRENT AND FUTURE TYPE ANALYSIS, 2025–2034, (USD MILLION)
FIGURE 50 COLUMBIA BULK MATERIAL HANDLING SYSTEMCURRENT AND FUTURE END USER ANALYSIS, 2025–2034, (USD MILLION)
FIGURE 51 REST OF LATIN AMERICA BULK MATERIAL HANDLING SYSTEMCURRENT AND FUTURE TYPE ANALYSIS, 2025–2034, (USD MILLION)
FIGURE 52 REST OF LATIN AMERICA BULK MATERIAL HANDLING SYSTEMCURRENT AND FUTURE END USER ANALYSIS, 2025–2034, (USD MILLION)
FIGURE 53 EASTERN EUROPE BULK MATERIAL HANDLING SYSTEMCURRENT AND FUTURE MARKET VOLUME SHARE REGIONAL ANALYSIS, 2025–2034, (USD MILLION)
FIGURE 54 POLAND BULK MATERIAL HANDLING SYSTEMCURRENT AND FUTURE TYPE ANALYSIS, 2025–2034, (USD MILLION)
FIGURE 55 POLAND BULK MATERIAL HANDLING SYSTEMCURRENT AND FUTURE END USER ANALYSIS, 2025–2034, (USD MILLION)
FIGURE 56 RUSSIA BULK MATERIAL HANDLING SYSTEMCURRENT AND FUTURE TYPE ANALYSIS, 2025–2034, (USD MILLION)
FIGURE 57 RUSSIA BULK MATERIAL HANDLING SYSTEMCURRENT AND FUTURE END USER ANALYSIS, 2025–2034, (USD MILLION)
FIGURE 58 CZECH REPUBLIC BULK MATERIAL HANDLING SYSTEMCURRENT AND FUTURE TYPE ANALYSIS, 2025–2034, (USD MILLION)
FIGURE 59 CZECH REPUBLIC BULK MATERIAL HANDLING SYSTEMCURRENT AND FUTURE END USER ANALYSIS, 2025–2034, (USD MILLION)
FIGURE 60 ROMANIA BULK MATERIAL HANDLING SYSTEMCURRENT AND FUTURE TYPE ANALYSIS, 2025–2034, (USD MILLION)
FIGURE 61 ROMANIA BULK MATERIAL HANDLING SYSTEMCURRENT AND FUTURE END USER ANALYSIS, 2025–2034, (USD MILLION)
FIGURE 62 REST OF EASTERN EUROPE BULK MATERIAL HANDLING SYSTEMCURRENT AND FUTURE TYPE ANALYSIS, 2025–2034, (USD MILLION)
FIGURE 63 REST OF EASTERN EUROPE BULK MATERIAL HANDLING SYSTEMCURRENT AND FUTURE END USER ANALYSIS, 2025–2034, (USD MILLION)
FIGURE 64 WESTERN EUROPE BULK MATERIAL HANDLING SYSTEMCURRENT AND FUTURE MARKET VOLUME SHARE REGIONAL ANALYSIS, 2025–2034, (USD MILLION)
FIGURE 65 GERMANY BULK MATERIAL HANDLING SYSTEMCURRENT AND FUTURE TYPE ANALYSIS, 2025–2034, (USD MILLION)
FIGURE 66 GERMANY BULK MATERIAL HANDLING SYSTEMCURRENT AND FUTURE END USER ANALYSIS, 2025–2034, (USD MILLION)
FIGURE 67 FRANCE BULK MATERIAL HANDLING SYSTEMCURRENT AND FUTURE TYPE ANALYSIS, 2025–2034, (USD MILLION)
FIGURE 68 FRANCE BULK MATERIAL HANDLING SYSTEMCURRENT AND FUTURE END USER ANALYSIS, 2025–2034, (USD MILLION)
FIGURE 69 UK BULK MATERIAL HANDLING SYSTEMCURRENT AND FUTURE TYPE ANALYSIS, 2025–2034, (USD MILLION)
FIGURE 70 UK BULK MATERIAL HANDLING SYSTEMCURRENT AND FUTURE END USER ANALYSIS, 2025–2034, (USD MILLION)
FIGURE 71 SPAIN BULK MATERIAL HANDLING SYSTEMCURRENT AND FUTURE TYPE ANALYSIS, 2025–2034, (USD MILLION)
FIGURE 72 SPAIN BULK MATERIAL HANDLING SYSTEMCURRENT AND FUTURE END USER ANALYSIS, 2025–2034, (USD MILLION)
FIGURE 73 ITALY BULK MATERIAL HANDLING SYSTEMCURRENT AND FUTURE TYPE ANALYSIS, 2025–2034, (USD MILLION)
FIGURE 74 ITALY BULK MATERIAL HANDLING SYSTEMCURRENT AND FUTURE END USER ANALYSIS, 2025–2034, (USD MILLION)
FIGURE 75 REST OF WESTERN EUROPE BULK MATERIAL HANDLING SYSTEMCURRENT AND FUTURE TYPE ANALYSIS, 2025–2034, (USD MILLION)
FIGURE 76 REST OF WESTERN EUROPE BULK MATERIAL HANDLING SYSTEMCURRENT AND FUTURE END USER ANALYSIS, 2025–2034, (USD MILLION)
FIGURE 77 EAST ASIA AND PACIFIC BULK MATERIAL HANDLING SYSTEMCURRENT AND FUTURE MARKET VOLUME SHARE REGIONAL ANALYSIS, 2025–2034, (USD MILLION)
FIGURE 78 CHINA BULK MATERIAL HANDLING SYSTEMCURRENT AND FUTURE TYPE ANALYSIS, 2025–2034, (USD MILLION)
FIGURE 79 CHINA BULK MATERIAL HANDLING SYSTEMCURRENT AND FUTURE END USER ANALYSIS, 2025–2034, (USD MILLION)
FIGURE 80 JAPAN BULK MATERIAL HANDLING SYSTEMCURRENT AND FUTURE TYPE ANALYSIS, 2025–2034, (USD MILLION)
FIGURE 81 JAPAN BULK MATERIAL HANDLING SYSTEMCURRENT AND FUTURE END USER ANALYSIS, 2025–2034, (USD MILLION)
FIGURE 82 AUSTRALIA BULK MATERIAL HANDLING SYSTEMCURRENT AND FUTURE TYPE ANALYSIS, 2025–2034, (USD MILLION)
FIGURE 83 AUSTRALIA BULK MATERIAL HANDLING SYSTEMCURRENT AND FUTURE END USER ANALYSIS, 2025–2034, (USD MILLION)
FIGURE 84 CAMBODIA BULK MATERIAL HANDLING SYSTEMCURRENT AND FUTURE TYPE ANALYSIS, 2025–2034, (USD MILLION)
FIGURE 85 CAMBODIA BULK MATERIAL HANDLING SYSTEMCURRENT AND FUTURE END USER ANALYSIS, 2025–2034, (USD MILLION)
FIGURE 86 FIJI BULK MATERIAL HANDLING SYSTEMCURRENT AND FUTURE TYPE ANALYSIS, 2025–2034, (USD MILLION)
FIGURE 87 FIJI BULK MATERIAL HANDLING SYSTEMCURRENT AND FUTURE END USER ANALYSIS, 2025–2034, (USD MILLION)
FIGURE 88 INDONESIA BULK MATERIAL HANDLING SYSTEMCURRENT AND FUTURE TYPE ANALYSIS, 2025–2034, (USD MILLION)
FIGURE 89 INDONESIA BULK MATERIAL HANDLING SYSTEMCURRENT AND FUTURE END USER ANALYSIS, 2025–2034, (USD MILLION)
FIGURE 90 SOUTH KOREA BULK MATERIAL HANDLING SYSTEMCURRENT AND FUTURE TYPE ANALYSIS, 2025–2034, (USD MILLION)
FIGURE 91 SOUTH KOREA BULK MATERIAL HANDLING SYSTEMCURRENT AND FUTURE END USER ANALYSIS, 2025–2034, (USD MILLION)
FIGURE 92 REST OF EAST ASIA AND PACIFIC BULK MATERIAL HANDLING SYSTEMCURRENT AND FUTURE TYPE ANALYSIS, 2025–2034, (USD MILLION)
FIGURE 93 REST OF EAST ASIA AND PACIFIC BULK MATERIAL HANDLING SYSTEMCURRENT AND FUTURE END USER ANALYSIS, 2025–2034, (USD MILLION)
FIGURE 94 SEA AND SOUTH ASIA BULK MATERIAL HANDLING SYSTEMCURRENT AND FUTURE MARKET VOLUME SHARE REGIONAL ANALYSIS, 2025–2034, (USD MILLION)
FIGURE 95 BANGLADESH BULK MATERIAL HANDLING SYSTEMCURRENT AND FUTURE TYPE ANALYSIS, 2025–2034, (USD MILLION)
FIGURE 96 BANGLADESH BULK MATERIAL HANDLING SYSTEMCURRENT AND FUTURE END USER ANALYSIS, 2025–2034, (USD MILLION)
FIGURE 97 NEW ZEALAND BULK MATERIAL HANDLING SYSTEMCURRENT AND FUTURE TYPE ANALYSIS, 2025–2034, (USD MILLION)
FIGURE 98 NEW ZEALAND BULK MATERIAL HANDLING SYSTEMCURRENT AND FUTURE END USER ANALYSIS, 2025–2034, (USD MILLION)
FIGURE 99 INDIA BULK MATERIAL HANDLING SYSTEMCURRENT AND FUTURE TYPE ANALYSIS, 2025–2034, (USD MILLION)
FIGURE 100 INDIA BULK MATERIAL HANDLING SYSTEMCURRENT AND FUTURE END USER ANALYSIS, 2025–2034, (USD MILLION)
FIGURE 101 SINGAPORE BULK MATERIAL HANDLING SYSTEMCURRENT AND FUTURE TYPE ANALYSIS, 2025–2034, (USD MILLION)
FIGURE 102 SINGAPORE BULK MATERIAL HANDLING SYSTEMCURRENT AND FUTURE END USER ANALYSIS, 2025–2034, (USD MILLION)
FIGURE 103 THAILAND BULK MATERIAL HANDLING SYSTEMCURRENT AND FUTURE TYPE ANALYSIS, 2025–2034, (USD MILLION)
FIGURE 104 THAILAND BULK MATERIAL HANDLING SYSTEMCURRENT AND FUTURE END USER ANALYSIS, 2025–2034, (USD MILLION)
FIGURE 105 TAIWAN BULK MATERIAL HANDLING SYSTEMCURRENT AND FUTURE TYPE ANALYSIS, 2025–2034, (USD MILLION)
FIGURE 106 TAIWAN BULK MATERIAL HANDLING SYSTEMCURRENT AND FUTURE END USER ANALYSIS, 2025–2034, (USD MILLION)
FIGURE 107 MALAYSIA BULK MATERIAL HANDLING SYSTEMCURRENT AND FUTURE TYPE ANALYSIS, 2025–2034, (USD MILLION)
FIGURE 108 MALAYSIA BULK MATERIAL HANDLING SYSTEMCURRENT AND FUTURE END USER ANALYSIS, 2025–2034, (USD MILLION)
FIGURE 109 REST OF SEA AND SOUTH ASIA BULK MATERIAL HANDLING SYSTEMCURRENT AND FUTURE TYPE ANALYSIS, 2025–2034, (USD MILLION)
FIGURE 110 REST OF SEA AND SOUTH ASIA BULK MATERIAL HANDLING SYSTEMCURRENT AND FUTURE END USER ANALYSIS, 2025–2034, (USD MILLION)
FIGURE 111 MIDDLE EAST AND AFRICA BULK MATERIAL HANDLING SYSTEMCURRENT AND FUTURE MARKET VOLUME SHARE REGIONAL ANALYSIS, 2025–2034, (USD MILLION)
FIGURE 112 GCC COUNTRIES BULK MATERIAL HANDLING SYSTEMCURRENT AND FUTURE TYPE ANALYSIS, 2025–2034, (USD MILLION)
FIGURE 113 GCC COUNTRIES BULK MATERIAL HANDLING SYSTEMCURRENT AND FUTURE END USER ANALYSIS, 2025–2034, (USD MILLION)
FIGURE 114 SAUDI ARABIA BULK MATERIAL HANDLING SYSTEMCURRENT AND FUTURE TYPE ANALYSIS, 2025–2034, (USD MILLION)
FIGURE 115 SAUDI ARABIA BULK MATERIAL HANDLING SYSTEMCURRENT AND FUTURE END USER ANALYSIS, 2025–2034, (USD MILLION)
FIGURE 116 UAE BULK MATERIAL HANDLING SYSTEMCURRENT AND FUTURE TYPE ANALYSIS, 2025–2034, (USD MILLION)
FIGURE 117 UAE BULK MATERIAL HANDLING SYSTEMCURRENT AND FUTURE END USER ANALYSIS, 2025–2034, (USD MILLION)
FIGURE 118 BAHRAIN BULK MATERIAL HANDLING SYSTEMCURRENT AND FUTURE TYPE ANALYSIS, 2025–2034, (USD MILLION)
FIGURE 119 BAHRAIN BULK MATERIAL HANDLING SYSTEMCURRENT AND FUTURE END USER ANALYSIS, 2025–2034, (USD MILLION)
FIGURE 120 KUWAIT BULK MATERIAL HANDLING SYSTEMCURRENT AND FUTURE TYPE ANALYSIS, 2025–2034, (USD MILLION)
FIGURE 121 KUWAIT BULK MATERIAL HANDLING SYSTEMCURRENT AND FUTURE END USER ANALYSIS, 2025–2034, (USD MILLION)
FIGURE 122 OMAN BULK MATERIAL HANDLING SYSTEMCURRENT AND FUTURE TYPE ANALYSIS, 2025–2034, (USD MILLION)
FIGURE 123 OMAN BULK MATERIAL HANDLING SYSTEMCURRENT AND FUTURE END USER ANALYSIS, 2025–2034, (USD MILLION)
FIGURE 124 QATAR BULK MATERIAL HANDLING SYSTEMCURRENT AND FUTURE TYPE ANALYSIS, 2025–2034, (USD MILLION)
FIGURE 125 QATAR BULK MATERIAL HANDLING SYSTEMCURRENT AND FUTURE END USER ANALYSIS, 2025–2034, (USD MILLION)
FIGURE 126 EGYPT BULK MATERIAL HANDLING SYSTEMCURRENT AND FUTURE TYPE ANALYSIS, 2025–2034, (USD MILLION)
FIGURE 127 EGYPT BULK MATERIAL HANDLING SYSTEMCURRENT AND FUTURE END USER ANALYSIS, 2025–2034, (USD MILLION)
FIGURE 128 NIGERIA BULK MATERIAL HANDLING SYSTEMCURRENT AND FUTURE TYPE ANALYSIS, 2025–2034, (USD MILLION)
FIGURE 129 NIGERIA BULK MATERIAL HANDLING SYSTEMCURRENT AND FUTURE END USER ANALYSIS, 2025–2034, (USD MILLION)
FIGURE 130 SOUTH AFRICA BULK MATERIAL HANDLING SYSTEMCURRENT AND FUTURE TYPE ANALYSIS, 2025–2034, (USD MILLION)
FIGURE 131 SOUTH AFRICA BULK MATERIAL HANDLING SYSTEMCURRENT AND FUTURE END USER ANALYSIS, 2025–2034, (USD MILLION)
FIGURE 132 ISRAEL BULK MATERIAL HANDLING SYSTEMCURRENT AND FUTURE TYPE ANALYSIS, 2025–2034, (USD MILLION)
FIGURE 133 ISRAEL BULK MATERIAL HANDLING SYSTEMCURRENT AND FUTURE END USER ANALYSIS, 2025–2034, (USD MILLION)
FIGURE 134 REST OF MEA BULK MATERIAL HANDLING SYSTEMCURRENT AND FUTURE TYPE ANALYSIS, 2025–2034, (USD MILLION)
FIGURE 135 REST OF MEA BULK MATERIAL HANDLING SYSTEMCURRENT AND FUTURE END USER ANALYSIS, 2025–2034, (USD MILLION)
FIGURE 136 U. S. MARKET SHARE ANALYSIS BY TYPE (2024)
FIGURE 137 U. S. MARKET SHARE ANALYSIS BY END USER (2024)
FIGURE 138 CANADA MARKET SHARE ANALYSIS BY TYPE (2024)
FIGURE 139 CANADA MARKET SHARE ANALYSIS BY END USER (2024)
FIGURE 140 MEXICO MARKET SHARE ANALYSIS BY TYPE (2024)
FIGURE 141 MEXICO MARKET SHARE ANALYSIS BY END USER (2024)
FIGURE 142 CHINA MARKET SHARE ANALYSIS BY TYPE (2024)
FIGURE 143 CHINA MARKET SHARE ANALYSIS BY END USER (2024)
FIGURE 144 JAPAN MARKET SHARE ANALYSIS BY TYPE (2024)
FIGURE 145 JAPAN MARKET SHARE ANALYSIS BY END USER (2024)
FIGURE 146 INDIA MARKET SHARE ANALYSIS BY TYPE (2024)
FIGURE 147 INDIA MARKET SHARE ANALYSIS BY END USER (2024)
FIGURE 148 SOUTH KOREA MARKET SHARE ANALYSIS BY TYPE (2024)
FIGURE 149 SOUTH KOREA MARKET SHARE ANALYSIS BY END USER (2024)
FIGURE 150 SAUDI ARABIA MARKET SHARE ANALYSIS BY TYPE (2024)
FIGURE 151 SAUDI ARABIA MARKET SHARE ANALYSIS BY END USER (2024)
FIGURE 152 UAE MARKET SHARE ANALYSIS BY TYPE (2024)
FIGURE 153 UAE MARKET SHARE ANALYSIS BY END USER (2024)
FIGURE 154 EGYPT MARKET SHARE ANALYSIS BY TYPE (2024)
FIGURE 155 EGYPT MARKET SHARE ANALYSIS BY END USER (2024)
FIGURE 156 NIGERIA MARKET SHARE ANALYSIS BY TYPE (2024)
FIGURE 157 NIGERIA MARKET SHARE ANALYSIS BY END USER (2024)
FIGURE 158 SOUTH AFRICA MARKET SHARE ANALYSIS BY TYPE (2024)
FIGURE 159 SOUTH AFRICA MARKET SHARE ANALYSIS BY END USER (2024)
FIGURE 160 GERMANY MARKET SHARE ANALYSIS BY TYPE (2024)
FIGURE 161 GERMANY MARKET SHARE ANALYSIS BY END USER (2024)
FIGURE 162 FRANCE MARKET SHARE ANALYSIS BY TYPE (2024)
FIGURE 163 FRANCE MARKET SHARE ANALYSIS BY END USER (2024)
FIGURE 164 UK MARKET SHARE ANALYSIS BY TYPE (2024)
FIGURE 165 UK MARKET SHARE ANALYSIS BY END USER (2024)
FIGURE 166 SPAIN MARKET SHARE ANALYSIS BY TYPE (2024)
FIGURE 167 SPAIN MARKET SHARE ANALYSIS BY END USER (2024)
FIGURE 168 ITALY MARKET SHARE ANALYSIS BY TYPE (2024)
FIGURE 169 ITALY MARKET SHARE ANALYSIS BY END USER (2024)
FIGURE 170 BRAZIL MARKET SHARE ANALYSIS BY TYPE (2024)
FIGURE 171 BRAZIL MARKET SHARE ANALYSIS BY END USER (2024)
FIGURE 172 ARGENTINA MARKET SHARE ANALYSIS BY TYPE (2024)
FIGURE 173 ARGENTINA MARKET SHARE ANALYSIS BY END USER (2024)
FIGURE 174 COLUMBIA MARKET SHARE ANALYSIS BY TYPE (2024)
FIGURE 175 COLUMBIA MARKET SHARE ANALYSIS BY END USER (2024)
FIGURE 176 GLOBAL BULK MATERIAL HANDLING SYSTEMCURRENT AND FUTURE MARKET KEY COUNTRY LEVEL ANALYSIS, 2024–2034, (USD MILLION)
FIGURE 177 FINANCIAL OVERVIEW:
Key Player Analysis
Continental AG: Continental AG positions itself as a leader in the bulk material handling system market, supported by a strong portfolio of conveyor belts and material transport technologies used in mining, construction, and industrial processing. The company maintains a broad installed base across more than 150 countries, which strengthens its aftermarket and service revenue streams. Continental continues to expand its smart conveyor solutions that integrate monitoring sensors for predictive maintenance. These systems help operators track belt wear and load conditions. The company commits a sizable portion of its annual R&D budget, estimated at 7 to 8 percent of revenue, to material science and automation. Continental’s focus on energy-efficient belt compounds and low-maintenance designs positions it well for 2025 as buyers prioritize cost control and improved uptime.
Crown Equipment Corporation: Crown Equipment Corporation operates as a challenger in the bulk material handling ecosystem. The company is known for forklifts, pallet movers, and automated warehouse systems. Crown increases its relevance in bulk handling applications by integrating autonomous navigation and fleet management software across its equipment lines. These tools help operators reduce downtime and improve load handling accuracy. The company reports steady growth across North America and Europe, supported by expanding e-commerce and manufacturing activity. Crown continues to invest in lithium-ion battery technology for its handling equipment, which reduces charging cycles and lowers operating costs. The strategic emphasis on connected equipment and service-based contracts strengthens its long-term position.
Daifuku Co., Ltd.: Daifuku Co., Ltd. holds a strong position as a global leader in automated material handling. Its portfolio spans conveyors, automated storage systems, and integrated warehouse platforms. The company reports consistent annual growth and holds a significant market share in Asia Pacific, where manufacturing and distribution activity continues to expand. Daifuku increases its footprint by securing contracts with automotive, electronics, and consumer goods manufacturers. Its software-driven control systems help clients manage real-time material flow and inventory accuracy. The company also expands into AI-supported warehouse management tools that improve load routing and reduce congestion. Daifuku’s global service network and proven execution capability make it a preferred partner for large-scale automation projects through 2025.
Market Key Players
Beumer Group
TGW Logistics Group GmbH
Honeywell International Inc.
Crown Equipment Corporation
Mitsubishi Electric Corporation
SSI Schaefer Group
Continental AG
Daifuku Co., Ltd.
Jungheinrich AG
MHS Conveyor
Driver
Automation Surge Across Industrial Operations
The market enters 2025 with strong momentum as companies speed up automation across warehouses, manufacturing plants, ports, and mining sites. The shift toward automated bulk movement closely follows the steady growth of e-commerce, which grew at an estimated 12% CAGR from 2020 to 2024 and continues to change distribution and fulfillment networks. Increased use of conveyor systems, stacker reclaimers, automated loaders, and robotic handling units cuts down manual labor while improving throughput accuracy and operational consistency.
Mining and Construction Investments Strengthen Demand
Mining and construction operators are increasing spending to support higher extraction volumes and large-scale infrastructure projects. Automated haulage systems and high-capacity conveying solutions enhance material flow efficiency and reduce operational risks in challenging environments. Improved system reliability, reduced labor dependency, and better safety performance make automation a key factor in growth, embedding bulk material handling systems into long-term industrial modernization plans.
Restraint
High Capital Intensity Limits Adoption
Despite the growing advantages of automation, significant capital needs continue to limit market access for mid-sized companies. Integrated bulk handling systems often require investments from USD 1.5 to 3.0 million for each large facility, leading to long payback periods that delay purchasing decisions. Financial limitations are especially noticeable in emerging markets and cost-sensitive industrial sectors.
Integration Complexity and Supply Chain Delays
Deployment timelines also suffer from engineering challenges when merging new systems with existing infrastructure. Facilities using outdated control systems face extra retrofitting costs and longer commissioning times. Supply chain disruptions, especially concerning motors, drives, and structural steel parts, increased wait times by 10 to 14 weeks in 2024. These logistical challenges slow down modernization efforts and delay the replacement of aging bulk handling equipment.
Opportunity
Infrastructure Expansion Fuels Equipment Demand
Large infrastructure projects across Asia Pacific, the Middle East, and Africa, totaling over USD 1 trillion in announced investments through 2030, create a steady demand for bulk handling equipment. Construction and industrial expansion need continuous movement of aggregates, cement, coal, and other bulk goods. This situation promotes increased use of conveyors, stackers, reclaimers, and ship loaders in ports and industrial areas.
Sustainability and Predictive Maintenance Drive Value Creation
Environmental regulations and decarbonization goals open up new opportunities for energy-efficient drives, enclosed conveying systems, and emission-reducing technologies. The use of predictive analytics and condition monitoring solutions cuts unplanned downtime by as much as 20%, boosting lifecycle service revenues. Vendors that combine equipment sales with digital performance enhancement capabilities are set to capture more lucrative contracts and long-term service agreements.
Trend
IoT and AI Transform Operational Intelligence
Digital integration is reshaping competitive positioning in 2025. IoT-enabled bulk handling systems offer real-time monitoring of temperature, vibration, load distribution, and mechanical stress indicators. AI-driven analytics tools improve routing and performance metrics, increasing equipment utilization rates and extending asset lifespan. Autonomous material transport vehicles are becoming popular in high-throughput industrial settings where consistent heavy-load movement is crucial.
Worker Safety and Connected Ecosystems Gain Priority
Technological advancements also focus on worker safety and human-machine collaboration. Wearable devices, like smart gloves and assistive exoskeletons, lessen physical strain and injury risk in manual tasks. The merging of connected equipment, digital diagnostics, and safety-enhancing wearables marks a significant shift towards intelligent bulk handling systems, where operational transparency and predictive control are standard performance measures.
Recent Developments
Dec 2024 – Continental AG: Continental AG launched a new energy-efficient conveyor belt line for mining and ports, targeting a reduction in power consumption of up to 12 percent and extending belt life by 15 percent across high-load applications. This move strengthens its position as a preferred supplier for large-scale bulk handling projects focused on operating cost control.
Feb 2025 – Daifuku Co., Ltd.: Daifuku announced a strategic partnership with a leading global e-commerce player to deploy automated bulk handling and sortation systems across five new mega-fulfillment centers, valued at over USD 250 million. The agreement expands Daifuku’s footprint in high-throughput logistics hubs and secures multi-year service and software revenue.
Apr 2025 – FLSmidth: FLSmidth completed the acquisition of a regional conveyor and stacker-reclaimer specialist in Latin America in a deal estimated at USD 140 million. The acquisition broadens FLSmidth’s installed base in copper and iron ore operations and strengthens its ability to bid for large integrated process and handling contracts in the region.
Jul 2025 – Metso Corporation: Metso introduced an AI-enabled condition monitoring platform for bulk material handling systems that connects conveyors, crushers, and feeders into a single analytics layer and targets a 20 percent reduction in unplanned downtime for early adopters. This launch enhances Metso’s service-led model and deepens customer lock-in through predictive maintenance capabilities.
Sep 2025 – thyssenkrupp Industrial Solutions: thyssenkrupp commissioned a large ship loader and yard conveyor project in the Middle East, designed to handle more than 25 million tonnes per year of bulk commodities for export, under a contract valued at over USD 300 million. The project consolidates thyssenkrupp’s role as a key supplier for high-capacity port terminals and supports further penetration into energy and mineral export corridors.