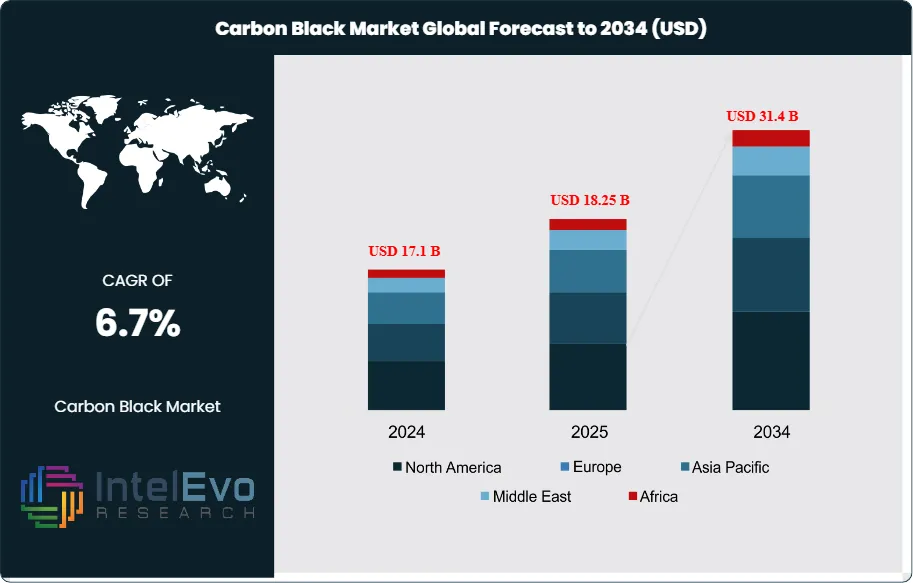
The Carbon Black Market is valued at approximately USD 17.1 billion in 2024 and is projected to reach nearly USD 31.4 billion by 2034, expanding at a CAGR of around 6.7% during 2025–2034. Growing consumption in automotive tires, conductive plastics, industrial rubber goods, and lithium-ion battery applications is reinforcing long-term demand worldwide. The shift toward high-performance and sustainable grades, along with capacity expansions across Asia Pacific, continues to reshape competitive dynamics.
This steady expansion reflects the market’s critical role in diverse industrial applications, underpinned by both demand-side growth from key end-use sectors and advances in processing technologies. Historically, the market has demonstrated resilience, with incremental adoption driven by the tire and rubber industries, which account for over 70% of total consumption, alongside increasing penetration in plastics, coatings, and specialty applications. The recent acceleration in global mobility trends, construction activity, and infrastructure investment has further lifted demand, while environmental regulations and supply chain realignments have added complexity to the market outlook.
Carbon black’s functionality as a reinforcing filler and pigment remains at the heart of its growth. Its ability to enhance mechanical strength, abrasion resistance, and UV protection continues to drive adoption in automotive tires, rubber products, and polymer-based applications. On the demand side, rising global vehicle production—expected to surpass 95 million units by 2030—represents a significant volume driver. Simultaneously, the plastics industry, valued at over USD 700 billion, is increasingly incorporating carbon black for insulation, color stabilization, and performance improvements. However, supply-side challenges such as reliance on petroleum-based feedstocks, energy-intensive production, and tightening emissions regulations in regions like Europe and North America pose headwinds, compelling producers to innovate toward cleaner and more efficient processes.
Technological innovation is reshaping the industry, particularly through the development of sustainable manufacturing pathways. Emerging solutions such as recovered carbon black (rCB) from end-of-life tires, coupled with process automation, AI-driven quality monitoring, and digitalized supply chain management, are enhancing cost efficiency and environmental compliance. These advancements are expected to account for a growing share of market revenues over the coming decade, with sustainability considerations shaping investment priorities.
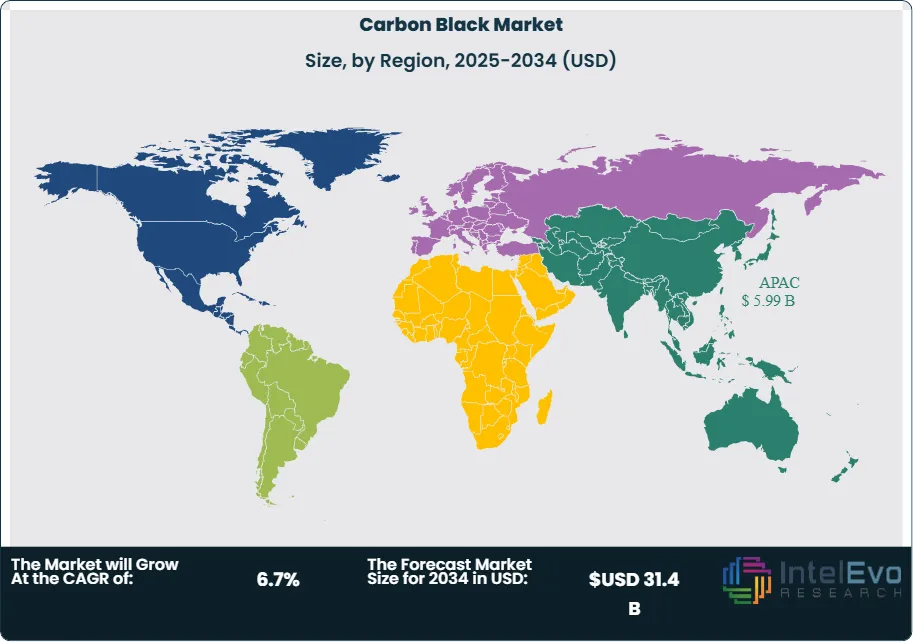
Regionally, Asia-Pacific dominates the market, accounting for nearly 50% of global consumption, fueled by robust automotive and industrial output in China, India, and Southeast Asia. North America and Europe remain mature yet innovation-driven markets, with investments focused on sustainable production and specialty-grade carbon black. Meanwhile, emerging economies in Latin America and Africa represent nascent growth hotspots, supported by rising urbanization and infrastructure spending. For investors, opportunities lie in scaling sustainable technologies, expanding specialty applications, and tapping underpenetrated markets where industrial demand is expected to accelerate sharply through 2034.
Key Takeaways
Market Growth: The global carbon black market was valued at USD 17.1 billion in 2024 and is projected to reach USD 31.4 billion by 2034, expanding at a CAGR of 6.7% over 2025–2034, driven by sustained demand from automotive, plastics, and industrial manufacturing sectors.
Product Type: Furnace black remains the leading product type, accounting for over 75% of global output, due to its cost-efficiency and superior reinforcement properties for rubber and tire applications.
Application: Tire manufacturing dominates with nearly 70% of total consumption, underpinned by rising global vehicle production and replacement tire demand, which together generate consistent revenue streams for producers.
Driver: Expanding automotive production—forecasted to surpass 95 million vehicles by 2030—continues to boost tire consumption, reinforcing carbon black’s role as a critical raw material for performance durability and safety.
Restraint: Stringent environmental regulations, particularly in North America and Europe, along with volatility in petroleum-derived feedstock prices, are exerting pressure on margins and prompting costly compliance investments.
Opportunity: Recovered carbon black (rCB) from end-of-life tires presents a fast-growing segment, projected to grow at over 10% CAGR through 2030, offering both cost savings and alignment with sustainability mandates.
Trend: Leading producers such as Cabot Corporation and Birla Carbon are investing in AI-driven process optimization and circular economy models, including carbon black recycling and cleaner production technologies, to meet regulatory and customer sustainability goals.
Regional Analysis: Asia-Pacific leads with a 33.9% share and is expected to register a robust CAGR of 8.1% through 2034, driven by automotive and industrial expansion in China and India. Europe and North America, though mature, are innovation hubs emphasizing sustainable production and specialty-grade carbon black, while Latin America and Africa represent emerging high-growth regions.
Type Analysis
The carbon black market is segmented into furnace black, channel black, acetylene black, thermal black, and other niche variants, with furnace black commanding the largest share. As of 2025, furnace black accounts for more than 70% of total production, supported by its cost efficiency and superior reinforcing properties for rubber, particularly in the tire industry. Its role extends beyond automotive, with growing use as a pigment in plastics, coatings, and even cosmetics, reinforcing its dominance across industries.
Thermal black is gaining traction due to its high UV absorption capacity, making it increasingly relevant for plastics and rubber-based adhesives where weather resistance is critical. Meanwhile, acetylene black, noted for its ultra-high purity and exceptional conductivity, is witnessing rising adoption in lithium-ion batteries, dry cells, and power cables—sectors poised for rapid growth amid electrification trends. Although channel black accounts for a smaller share, its unique fine-particle properties sustain niche demand, particularly in coatings and inks where high jetness and dispersion are valued. Collectively, these diverse applications highlight a balanced yet furnace-led market structure, with specialty subtypes gradually expanding their influence.
Grade Analysis
The market is bifurcated into standard grade and specialty grade, with specialty carbon black emerging as the dominant segment. Specialty grades are increasingly vital in high-performance applications due to their properties such as enhanced conductivity, UV resistance, and superior dispersion. By 2025, specialty carbon blacks are projected to represent nearly 40% of total market revenues, propelled by demand from polymers, printing inks, coatings, and electronic components.
Rapid expansion in consumer electronics, automotive coatings, and polymer composites has positioned specialty carbon blacks as critical enablers of performance and durability. In contrast, standard grades such as N772 and N660 remain indispensable for general-purpose industrial rubber products, particularly in heavy-duty applications like conveyor belts and hoses. While specialty grades command higher margins, standard grades continue to secure stable volumes, ensuring that the market maintains a dual-growth trajectory catering to both mass industrial demand and advanced material applications.
Application Analysis
Tire manufacturing remains the largest application area, accounting for around 65–70% of total consumption in 2025. Carbon black plays a crucial role in extending tire life by dissipating heat and reinforcing strength, making it indispensable as global vehicle production and replacement tire demand grow steadily. With the automotive industry projected to surpass 100 million units annually by 2030, tire-related applications will remain the backbone of market growth.
Non-tire rubber applications, including conveyor belts, roofing membranes, gaskets, and hoses, are gaining momentum as industries prioritize durability and cost efficiency in materials. Inks, coatings, and plastics together form another high-potential segment, supported by rising consumer preference for black-colored products and expanding use in electronics and packaging. Specialty coatings, conductive polymers, and high-gloss plastics are expected to lift demand further, diversifying carbon black’s application base beyond traditional tire-centric usage.
Regional Analysis
Asia-Pacific leads the global market, accounting for more than 35% of revenues in 2025 and projected to grow at a CAGR above 7% through 2034. This dominance is fueled by rapid industrialization in China and India, where polymer, tire, and automotive manufacturing continue to expand at scale. Southeast Asian nations, including Thailand, Malaysia, and Vietnam, are also emerging as production hubs, driven by investments in construction and manufacturing.
North America maintains a strong position with robust demand from automotive and polymer industries, supported by R&D into sustainable and specialty carbon blacks. Europe, while a mature market, is shifting focus toward high-value specialty grades, particularly for coatings, plastics, and electronics. The Middle East & Africa and Latin America, though smaller in size, present untapped growth opportunities. Rising infrastructure development, urbanization, and industrial investments are expected to accelerate carbon black demand in these regions, positioning them as the next wave of investment hotspots.
By Type (Furnace Black, Channel Black, Thermal Black, Acetylene Black, Others), By Grade (Standard Grade, Specialty Grade), By Application (Tire Rubber, Non-Tire Rubber, Inks and Coatings, Plastics, Others)
Research Methodology
Primary Research- 100 Interviews of Stakeholders
Secondary Research
Desk Research
Regional scope
North America (United States, Canada, Mexico)
Latin America (Brazil, Argentina, Columbia)
East Asia And Pacific (China, Japan, South Korea, Australia, Cambodia, Fiji, Indonesia)
Sea And South Asia (India, Singapore, Thailand, Taiwan, Malaysia)
Eastern Europe (Poland, Russia, Czech Republic, Romania)
Western Europe (Germany, U.K., France, Spain, Itlay)
Middle East & Africa (GCC Countries, Egypt, Nigeria, South Africa, Israel)
Competitive Landscape
Mitsubishi Chemical Corporation, Omsk Carbon Group, Orion Engineered Carbons GmbH, Cabot Corporation, Longxing Chemical Stock Co. Ltd, Atlas Organics Private Limited, Philips Carbon Black Limited, PCBL Limited, Birla Carbon, Jiangxi Black Cat Carbon Black Co. Ltd., Continental Carbon Company, Himadri Speciality Chemical Ltd, Tokai Carbon Co. Ltd., Orion Engineered Carbons S.A., Other Key Players
Customization Scope
Customization for segments, region/country-level will be provided. Moreover, additional customization can be done based on the requirements.
Pricing and Purchase Options
Avail customized purchase options to meet your exact research needs. We have three licenses to opt for: Single User License, Multi-User License (Up to 5 Users), Corporate Use License (Unlimited User and Printable PDF).
TABLE OF CONTENTS
1. EXECUTIVE SUMMARY
1.1. MARKET SNAPSHOT
1.2. KEY FINDINGS & INSIGHTS
1.3. ANALYST RECOMMENDATIONS
1.4. FUTURE OUTLOOK
2. RESEARCH METHODOLOGY
2.1. MARKET DEFINITION & SCOPE
2.2. RESEARCH OBJECTIVES: PRIMARY & SECONDARY DATA SOURCES
2.3. DATA COLLECTION SOURCES
2.3.1. COVERAGE OF 100+ PRIMARY RESEARCH/CONSULTATION CALLS WITH INDUSTRY STAKEHOLDERS
FIGURE 17 NORTH AMERICA CARBON BLACK CURRENT AND FUTURE TYPE ANALYSIS, 2025–2034, (USD MILLION)
FIGURE 18 NORTH AMERICA CARBON BLACK CURRENT AND FUTURE END USER ANALYSIS, 2025–2034, (USD MILLION)
FIGURE 19 MARKET SHARE BY COUNTRY
FIGURE 20 LATIN AMERICA CARBON BLACK CURRENT AND FUTURE TYPE ANALYSIS, 2025–2034, (USD MILLION)
FIGURE 21 LATIN AMERICA CARBON BLACK CURRENT AND FUTURE END USER ANALYSIS, 2025–2034, (USD MILLION)
FIGURE 22 MARKET SHARE BY COUNTRY
FIGURE 23 EASTERN EUROPE CARBON BLACK CURRENT AND FUTURE TYPE ANALYSIS, 2025–2034, (USD MILLION)
FIGURE 24 EASTERN EUROPE CARBON BLACK CURRENT AND FUTURE END USER ANALYSIS, 2025–2034, (USD MILLION)
FIGURE 25 MARKET SHARE BY COUNTRY
FIGURE 26 WESTERN EUROPE CARBON BLACK CURRENT AND FUTURE TYPE ANALYSIS, 2025–2034, (USD MILLION)
FIGURE 27 WESTERN EUROPE CARBON BLACK CURRENT AND FUTURE END USER ANALYSIS, 2025–2034, (USD MILLION)
FIGURE 28 MARKET SHARE BY COUNTRY
FIGURE 29 EAST ASIA AND PACIFIC CARBON BLACK CURRENT AND FUTURE TYPE ANALYSIS, 2025–2034, (USD MILLION)
FIGURE 30 EAST ASIA AND PACIFIC CARBON BLACK CURRENT AND FUTURE END USER ANALYSIS, 2025–2034, (USD MILLION)
FIGURE 31 MARKET SHARE BY COUNTRY
FIGURE 32 SEA AND SOUTH ASIA CARBON BLACK CURRENT AND FUTURE TYPE ANALYSIS, 2025–2034, (USD MILLION)
FIGURE 33 SEA AND SOUTH ASIA CARBON BLACK CURRENT AND FUTURE END USER ANALYSIS, 2025–2034, (USD MILLION)
FIGURE 34 MARKET SHARE BY COUNTRY
FIGURE 35 MIDDLE EAST AND AFRICA CARBON BLACK CURRENT AND FUTURE TYPE ANALYSIS, 2025–2034, (USD MILLION)
FIGURE 36 MIDDLE EAST AND AFRICA CARBON BLACK CURRENT AND FUTURE END USER ANALYSIS, 2025–2034, (USD MILLION)
FIGURE 37 NORTH AMERICA CARBON BLACK CURRENT AND FUTURE MARKET VOLUME SHARE REGIONAL ANALYSIS, 2025–2034, (USD MILLION)
FIGURE 38 U.S. CARBON BLACK CURRENT AND FUTURE TYPE ANALYSIS, 2025–2034, (USD MILLION)
FIGURE 39 U.S. CARBON BLACK CURRENT AND FUTURE END USER ANALYSIS, 2025–2034, (USD MILLION)
FIGURE 40 CANADA CARBON BLACK CURRENT AND FUTURE TYPE ANALYSIS, 2025–2034, (USD MILLION)
FIGURE 41 CANADA CARBON BLACK CURRENT AND FUTURE END USER ANALYSIS, 2025–2034, (USD MILLION)
FIGURE 42 LATIN AMERICA CARBON BLACK CURRENT AND FUTURE MARKET VOLUME SHARE REGIONAL ANALYSIS, 2025–2034, (USD MILLION)
FIGURE 43 MEXICO CARBON BLACK CURRENT AND FUTURE TYPE ANALYSIS, 2025–2034, (USD MILLION)
FIGURE 44 MEXICO CARBON BLACK CURRENT AND FUTURE END USER ANALYSIS, 2025–2034, (USD MILLION)
FIGURE 45 BRAZIL CARBON BLACK CURRENT AND FUTURE TYPE ANALYSIS, 2025–2034, (USD MILLION)
FIGURE 46 BRAZIL CARBON BLACK CURRENT AND FUTURE END USER ANALYSIS, 2025–2034, (USD MILLION)
FIGURE 47 ARGENTINA CARBON BLACK CURRENT AND FUTURE TYPE ANALYSIS, 2025–2034, (USD MILLION)
FIGURE 48 ARGENTINA CARBON BLACK CURRENT AND FUTURE END USER ANALYSIS, 2025–2034, (USD MILLION)
FIGURE 49 COLUMBIA CARBON BLACK CURRENT AND FUTURE TYPE ANALYSIS, 2025–2034, (USD MILLION)
FIGURE 50 COLUMBIA CARBON BLACK CURRENT AND FUTURE END USER ANALYSIS, 2025–2034, (USD MILLION)
FIGURE 51 REST OF LATIN AMERICA CARBON BLACK CURRENT AND FUTURE TYPE ANALYSIS, 2025–2034, (USD MILLION)
FIGURE 52 REST OF LATIN AMERICA CARBON BLACK CURRENT AND FUTURE END USER ANALYSIS, 2025–2034, (USD MILLION)
FIGURE 53 EASTERN EUROPE CARBON BLACK CURRENT AND FUTURE MARKET VOLUME SHARE REGIONAL ANALYSIS, 2025–2034, (USD MILLION)
FIGURE 54 POLAND CARBON BLACK CURRENT AND FUTURE TYPE ANALYSIS, 2025–2034, (USD MILLION)
FIGURE 55 POLAND CARBON BLACK CURRENT AND FUTURE END USER ANALYSIS, 2025–2034, (USD MILLION)
FIGURE 56 RUSSIA CARBON BLACK CURRENT AND FUTURE TYPE ANALYSIS, 2025–2034, (USD MILLION)
FIGURE 57 RUSSIA CARBON BLACK CURRENT AND FUTURE END USER ANALYSIS, 2025–2034, (USD MILLION)
FIGURE 58 CZECH REPUBLIC CARBON BLACK CURRENT AND FUTURE TYPE ANALYSIS, 2025–2034, (USD MILLION)
FIGURE 59 CZECH REPUBLIC CARBON BLACK CURRENT AND FUTURE END USER ANALYSIS, 2025–2034, (USD MILLION)
FIGURE 60 ROMANIA CARBON BLACK CURRENT AND FUTURE TYPE ANALYSIS, 2025–2034, (USD MILLION)
FIGURE 61 ROMANIA CARBON BLACK CURRENT AND FUTURE END USER ANALYSIS, 2025–2034, (USD MILLION)
FIGURE 62 REST OF EASTERN EUROPE CARBON BLACK CURRENT AND FUTURE TYPE ANALYSIS, 2025–2034, (USD MILLION)
FIGURE 63 REST OF EASTERN EUROPE CARBON BLACK CURRENT AND FUTURE END USER ANALYSIS, 2025–2034, (USD MILLION)
FIGURE 64 WESTERN EUROPE CARBON BLACK CURRENT AND FUTURE MARKET VOLUME SHARE REGIONAL ANALYSIS, 2025–2034, (USD MILLION)
FIGURE 65 GERMANY CARBON BLACK CURRENT AND FUTURE TYPE ANALYSIS, 2025–2034, (USD MILLION)
FIGURE 66 GERMANY CARBON BLACK CURRENT AND FUTURE END USER ANALYSIS, 2025–2034, (USD MILLION)
FIGURE 67 FRANCE CARBON BLACK CURRENT AND FUTURE TYPE ANALYSIS, 2025–2034, (USD MILLION)
FIGURE 68 FRANCE CARBON BLACK CURRENT AND FUTURE END USER ANALYSIS, 2025–2034, (USD MILLION)
FIGURE 69 UK CARBON BLACK CURRENT AND FUTURE TYPE ANALYSIS, 2025–2034, (USD MILLION)
FIGURE 70 UK CARBON BLACK CURRENT AND FUTURE END USER ANALYSIS, 2025–2034, (USD MILLION)
FIGURE 71 SPAIN CARBON BLACK CURRENT AND FUTURE TYPE ANALYSIS, 2025–2034, (USD MILLION)
FIGURE 72 SPAIN CARBON BLACK CURRENT AND FUTURE END USER ANALYSIS, 2025–2034, (USD MILLION)
FIGURE 73 ITALY CARBON BLACK CURRENT AND FUTURE TYPE ANALYSIS, 2025–2034, (USD MILLION)
FIGURE 74 ITALY CARBON BLACK CURRENT AND FUTURE END USER ANALYSIS, 2025–2034, (USD MILLION)
FIGURE 75 REST OF WESTERN EUROPE CARBON BLACK CURRENT AND FUTURE TYPE ANALYSIS, 2025–2034, (USD MILLION)
FIGURE 76 REST OF WESTERN EUROPE CARBON BLACK CURRENT AND FUTURE END USER ANALYSIS, 2025–2034, (USD MILLION)
FIGURE 77 EAST ASIA AND PACIFIC CARBON BLACK CURRENT AND FUTURE MARKET VOLUME SHARE REGIONAL ANALYSIS, 2025–2034, (USD MILLION)
FIGURE 78 CHINA CARBON BLACK CURRENT AND FUTURE TYPE ANALYSIS, 2025–2034, (USD MILLION)
FIGURE 79 CHINA CARBON BLACK CURRENT AND FUTURE END USER ANALYSIS, 2025–2034, (USD MILLION)
FIGURE 80 JAPAN CARBON BLACK CURRENT AND FUTURE TYPE ANALYSIS, 2025–2034, (USD MILLION)
FIGURE 81 JAPAN CARBON BLACK CURRENT AND FUTURE END USER ANALYSIS, 2025–2034, (USD MILLION)
FIGURE 82 AUSTRALIA CARBON BLACK CURRENT AND FUTURE TYPE ANALYSIS, 2025–2034, (USD MILLION)
FIGURE 83 AUSTRALIA CARBON BLACK CURRENT AND FUTURE END USER ANALYSIS, 2025–2034, (USD MILLION)
FIGURE 84 CAMBODIA CARBON BLACK CURRENT AND FUTURE TYPE ANALYSIS, 2025–2034, (USD MILLION)
FIGURE 85 CAMBODIA CARBON BLACK CURRENT AND FUTURE END USER ANALYSIS, 2025–2034, (USD MILLION)
FIGURE 86 FIJI CARBON BLACK CURRENT AND FUTURE TYPE ANALYSIS, 2025–2034, (USD MILLION)
FIGURE 87 FIJI CARBON BLACK CURRENT AND FUTURE END USER ANALYSIS, 2025–2034, (USD MILLION)
FIGURE 88 INDONESIA CARBON BLACK CURRENT AND FUTURE TYPE ANALYSIS, 2025–2034, (USD MILLION)
FIGURE 89 INDONESIA CARBON BLACK CURRENT AND FUTURE END USER ANALYSIS, 2025–2034, (USD MILLION)
FIGURE 90 SOUTH KOREA CARBON BLACK CURRENT AND FUTURE TYPE ANALYSIS, 2025–2034, (USD MILLION)
FIGURE 91 SOUTH KOREA CARBON BLACK CURRENT AND FUTURE END USER ANALYSIS, 2025–2034, (USD MILLION)
FIGURE 92 REST OF EAST ASIA AND PACIFIC CARBON BLACK CURRENT AND FUTURE TYPE ANALYSIS, 2025–2034, (USD MILLION)
FIGURE 93 REST OF EAST ASIA AND PACIFIC CARBON BLACK CURRENT AND FUTURE END USER ANALYSIS, 2025–2034, (USD MILLION)
FIGURE 94 SEA AND SOUTH ASIA CARBON BLACK CURRENT AND FUTURE MARKET VOLUME SHARE REGIONAL ANALYSIS, 2025–2034, (USD MILLION)
FIGURE 95 BANGLADESH CARBON BLACK CURRENT AND FUTURE TYPE ANALYSIS, 2025–2034, (USD MILLION)
FIGURE 96 BANGLADESH CARBON BLACK CURRENT AND FUTURE END USER ANALYSIS, 2025–2034, (USD MILLION)
FIGURE 97 NEW ZEALAND CARBON BLACK CURRENT AND FUTURE TYPE ANALYSIS, 2025–2034, (USD MILLION)
FIGURE 98 NEW ZEALAND CARBON BLACK CURRENT AND FUTURE END USER ANALYSIS, 2025–2034, (USD MILLION)
FIGURE 99 INDIA CARBON BLACK CURRENT AND FUTURE TYPE ANALYSIS, 2025–2034, (USD MILLION)
FIGURE 100 INDIA CARBON BLACK CURRENT AND FUTURE END USER ANALYSIS, 2025–2034, (USD MILLION)
FIGURE 101 SINGAPORE CARBON BLACK CURRENT AND FUTURE TYPE ANALYSIS, 2025–2034, (USD MILLION)
FIGURE 102 SINGAPORE CARBON BLACK CURRENT AND FUTURE END USER ANALYSIS, 2025–2034, (USD MILLION)
FIGURE 103 THAILAND CARBON BLACK CURRENT AND FUTURE TYPE ANALYSIS, 2025–2034, (USD MILLION)
FIGURE 104 THAILAND CARBON BLACK CURRENT AND FUTURE END USER ANALYSIS, 2025–2034, (USD MILLION)
FIGURE 105 TAIWAN CARBON BLACK CURRENT AND FUTURE TYPE ANALYSIS, 2025–2034, (USD MILLION)
FIGURE 106 TAIWAN CARBON BLACK CURRENT AND FUTURE END USER ANALYSIS, 2025–2034, (USD MILLION)
FIGURE 107 MALAYSIA CARBON BLACK CURRENT AND FUTURE TYPE ANALYSIS, 2025–2034, (USD MILLION)
FIGURE 108 MALAYSIA CARBON BLACK CURRENT AND FUTURE END USER ANALYSIS, 2025–2034, (USD MILLION)
FIGURE 109 REST OF SEA AND SOUTH ASIA CARBON BLACK CURRENT AND FUTURE TYPE ANALYSIS, 2025–2034, (USD MILLION)
FIGURE 110 REST OF SEA AND SOUTH ASIA CARBON BLACK CURRENT AND FUTURE END USER ANALYSIS, 2025–2034, (USD MILLION)
FIGURE 111 MIDDLE EAST AND AFRICA CARBON BLACK CURRENT AND FUTURE MARKET VOLUME SHARE REGIONAL ANALYSIS, 2025–2034, (USD MILLION)
FIGURE 112 GCC COUNTRIES CARBON BLACK CURRENT AND FUTURE TYPE ANALYSIS, 2025–2034, (USD MILLION)
FIGURE 113 GCC COUNTRIES CARBON BLACK CURRENT AND FUTURE END USER ANALYSIS, 2025–2034, (USD MILLION)
FIGURE 114 SAUDI ARABIA CARBON BLACK CURRENT AND FUTURE TYPE ANALYSIS, 2025–2034, (USD MILLION)
FIGURE 115 SAUDI ARABIA CARBON BLACK CURRENT AND FUTURE END USER ANALYSIS, 2025–2034, (USD MILLION)
FIGURE 116 UAE CARBON BLACK CURRENT AND FUTURE TYPE ANALYSIS, 2025–2034, (USD MILLION)
FIGURE 117 UAE CARBON BLACK CURRENT AND FUTURE END USER ANALYSIS, 2025–2034, (USD MILLION)
FIGURE 118 BAHRAIN CARBON BLACK CURRENT AND FUTURE TYPE ANALYSIS, 2025–2034, (USD MILLION)
FIGURE 119 BAHRAIN CARBON BLACK CURRENT AND FUTURE END USER ANALYSIS, 2025–2034, (USD MILLION)
FIGURE 120 KUWAIT CARBON BLACK CURRENT AND FUTURE TYPE ANALYSIS, 2025–2034, (USD MILLION)
FIGURE 121 KUWAIT CARBON BLACK CURRENT AND FUTURE END USER ANALYSIS, 2025–2034, (USD MILLION)
FIGURE 122 OMAN CARBON BLACK CURRENT AND FUTURE TYPE ANALYSIS, 2025–2034, (USD MILLION)
FIGURE 123 OMAN CARBON BLACK CURRENT AND FUTURE END USER ANALYSIS, 2025–2034, (USD MILLION)
FIGURE 124 QATAR CARBON BLACK CURRENT AND FUTURE TYPE ANALYSIS, 2025–2034, (USD MILLION)
FIGURE 125 QATAR CARBON BLACK CURRENT AND FUTURE END USER ANALYSIS, 2025–2034, (USD MILLION)
FIGURE 126 EGYPT CARBON BLACK CURRENT AND FUTURE TYPE ANALYSIS, 2025–2034, (USD MILLION)
FIGURE 127 EGYPT CARBON BLACK CURRENT AND FUTURE END USER ANALYSIS, 2025–2034, (USD MILLION)
FIGURE 128 NIGERIA CARBON BLACK CURRENT AND FUTURE TYPE ANALYSIS, 2025–2034, (USD MILLION)
FIGURE 129 NIGERIA CARBON BLACK CURRENT AND FUTURE END USER ANALYSIS, 2025–2034, (USD MILLION)
FIGURE 130 SOUTH AFRICA CARBON BLACK CURRENT AND FUTURE TYPE ANALYSIS, 2025–2034, (USD MILLION)
FIGURE 131 SOUTH AFRICA CARBON BLACK CURRENT AND FUTURE END USER ANALYSIS, 2025–2034, (USD MILLION)
FIGURE 132 ISRAEL CARBON BLACK CURRENT AND FUTURE TYPE ANALYSIS, 2025–2034, (USD MILLION)
FIGURE 133 ISRAEL CARBON BLACK CURRENT AND FUTURE END USER ANALYSIS, 2025–2034, (USD MILLION)
FIGURE 134 REST OF MEA CARBON BLACK CURRENT AND FUTURE TYPE ANALYSIS, 2025–2034, (USD MILLION)
FIGURE 135 REST OF MEA CARBON BLACK CURRENT AND FUTURE END USER ANALYSIS, 2025–2034, (USD MILLION)
FIGURE 136 U. S. MARKET SHARE ANALYSIS BY TYPE (2024)
FIGURE 137 U. S. MARKET SHARE ANALYSIS BY END USER (2024)
FIGURE 138 CANADA MARKET SHARE ANALYSIS BY TYPE (2024)
FIGURE 139 CANADA MARKET SHARE ANALYSIS BY END USER (2024)
FIGURE 140 MEXICO MARKET SHARE ANALYSIS BY TYPE (2024)
FIGURE 141 MEXICO MARKET SHARE ANALYSIS BY END USER (2024)
FIGURE 142 CHINA MARKET SHARE ANALYSIS BY TYPE (2024)
FIGURE 143 CHINA MARKET SHARE ANALYSIS BY END USER (2024)
FIGURE 144 JAPAN MARKET SHARE ANALYSIS BY TYPE (2024)
FIGURE 145 JAPAN MARKET SHARE ANALYSIS BY END USER (2024)
FIGURE 146 INDIA MARKET SHARE ANALYSIS BY TYPE (2024)
FIGURE 147 INDIA MARKET SHARE ANALYSIS BY END USER (2024)
FIGURE 148 SOUTH KOREA MARKET SHARE ANALYSIS BY TYPE (2024)
FIGURE 149 SOUTH KOREA MARKET SHARE ANALYSIS BY END USER (2024)
FIGURE 150 SAUDI ARABIA MARKET SHARE ANALYSIS BY TYPE (2024)
FIGURE 151 SAUDI ARABIA MARKET SHARE ANALYSIS BY END USER (2024)
FIGURE 152 UAE MARKET SHARE ANALYSIS BY TYPE (2024)
FIGURE 153 UAE MARKET SHARE ANALYSIS BY END USER (2024)
FIGURE 154 EGYPT MARKET SHARE ANALYSIS BY TYPE (2024)
FIGURE 155 EGYPT MARKET SHARE ANALYSIS BY END USER (2024)
FIGURE 156 NIGERIA MARKET SHARE ANALYSIS BY TYPE (2024)
FIGURE 157 NIGERIA MARKET SHARE ANALYSIS BY END USER (2024)
FIGURE 158 SOUTH AFRICA MARKET SHARE ANALYSIS BY TYPE (2024)
FIGURE 159 SOUTH AFRICA MARKET SHARE ANALYSIS BY END USER (2024)
FIGURE 160 GERMANY MARKET SHARE ANALYSIS BY TYPE (2024)
FIGURE 161 GERMANY MARKET SHARE ANALYSIS BY END USER (2024)
FIGURE 162 FRANCE MARKET SHARE ANALYSIS BY TYPE (2024)
FIGURE 163 FRANCE MARKET SHARE ANALYSIS BY END USER (2024)
FIGURE 164 UK MARKET SHARE ANALYSIS BY TYPE (2024)
FIGURE 165 UK MARKET SHARE ANALYSIS BY END USER (2024)
FIGURE 166 SPAIN MARKET SHARE ANALYSIS BY TYPE (2024)
FIGURE 167 SPAIN MARKET SHARE ANALYSIS BY END USER (2024)
FIGURE 168 ITALY MARKET SHARE ANALYSIS BY TYPE (2024)
FIGURE 169 ITALY MARKET SHARE ANALYSIS BY END USER (2024)
FIGURE 170 BRAZIL MARKET SHARE ANALYSIS BY TYPE (2024)
FIGURE 171 BRAZIL MARKET SHARE ANALYSIS BY END USER (2024)
FIGURE 172 ARGENTINA MARKET SHARE ANALYSIS BY TYPE (2024)
FIGURE 173 ARGENTINA MARKET SHARE ANALYSIS BY END USER (2024)
FIGURE 174 COLUMBIA MARKET SHARE ANALYSIS BY TYPE (2024)
FIGURE 175 COLUMBIA MARKET SHARE ANALYSIS BY END USER (2024)
FIGURE 176 GLOBAL CARBON BLACK CURRENT AND FUTURE MARKET KEY COUNTRY LEVEL ANALYSIS, 2024–2034, (USD MILLION)
FIGURE 177 FINANCIAL OVERVIEW:
Key Player Analysis
Birla Carbon: Birla Carbon, a flagship of the Aditya Birla Group, is positioned as a global market leader, operating across more than 12 countries with a strong production capacity exceeding 2 million metric tons annually. The company has established itself as a cornerstone supplier to the tire and rubber industry, while also diversifying into plastics, inks, and coatings. In line with the 2025 sustainability agenda, Birla Carbon has prioritized circular economy initiatives, advancing its “Sustainability 2030” roadmap to reduce carbon intensity and expand the use of recovered carbon black (rCB). Recent partnerships with leading tire manufacturers underscore its role in promoting eco-efficient solutions while maintaining cost competitiveness. Its wide geographic footprint, particularly in Asia-Pacific and North America, provides resilience against supply chain volatility and positions it as a reliable supplier in high-demand regions.
Cabot Corporation: Cabot Corporation stands as an innovation-driven leader, leveraging its advanced materials expertise to expand beyond carbon black into high-performance specialty chemicals. The company has increasingly focused on specialty carbon blacks tailored for high-dispersion, conductive, and UV-resistant applications, aligning with growth in electric vehicles (EVs), electronics, and renewable energy sectors. Cabot has invested heavily in digital transformation, including AI-driven process optimization, and has rolled out advanced emission-reduction technologies across its facilities, significantly lowering its carbon footprint. With revenues surpassing USD 4 billion globally, the company has secured strong partnerships in Europe and the U.S., positioning itself as a frontrunner in ESG compliance and value-added solutions that command premium margins.
Continental Carbon Company: Continental Carbon Company (CCC), headquartered in the U.S., is recognized as a key challenger in the carbon black market, with strong regional influence in North America and strategic operations in Asia. CCC specializes in furnace black for tires and industrial rubber, supported by long-term contracts with leading automotive and manufacturing companies. The firm has been actively modernizing its facilities to meet stringent U.S. Environmental Protection Agency (EPA) standards, committing to capital upgrades that enhance both efficiency and compliance. While smaller in global scale compared to Birla or Cabot, CCC differentiates itself through customer-centric supply chain flexibility and competitive pricing strategies, which appeal to mid-tier tire producers and industrial buyers. Its emphasis on reliability and compliance gives it a solid foothold as regulatory pressures reshape the industry landscape.
Orion Engineered Carbons S.A.: Orion Engineered Carbons is a specialty-focused innovator, with a diversified portfolio spanning coatings, polymers, printing systems, and high-performance rubber applications. The company has carved a niche in specialty carbon blacks, which now account for more than 40% of its total revenues, reflecting its pivot toward higher-margin, technology-intensive segments. Orion has made significant investments in sustainability, including expanding its recovered carbon black capabilities and deploying green technologies in Europe and the U.S. Additionally, the company has embraced advanced analytics and automation across its operations to enhance quality control and reduce production costs. Its ability to balance commodity-grade supply with differentiated specialty solutions positions Orion as a strategic partner for industries undergoing rapid technological transformation, such as EVs, advanced polymers, and electronics.
Market Key Players
Mitsubishi Chemical Corporation
Omsk Carbon Group
Orion Engineered Carbons GmbH
Cabot Corporation
Longxing Chemical Stock Co. Ltd
Atlas Organics Private Limited
Philips Carbon Black Limited
PCBL Limited
Birla Carbon
Jiangxi Black Cat Carbon Black Co. Ltd.
Continental Carbon Company
Himadri Speciality Chemical Ltd
Tokai Carbon Co. Ltd.
Orion Engineered Carbons S.A.
Other Key Players
Driver:
Rising Tire Demand and Industrial Expansion Power Market Growth
As of 2025, the global carbon black market continues to expand on the back of sustained demand from the automotive and construction sectors. Tires alone account for nearly 70% of global carbon black consumption, with global vehicle production expected to exceed 100 million units annually by 2030. Rising car ownership in emerging economies such as India, Indonesia, and Brazil, coupled with surging demand for replacement tires in mature markets like the United States and Europe, is reinforcing market momentum. Beyond automotive, specialty carbon blacks—used in adhesives, sealants, and coatings—are experiencing double-digit growth, driven by infrastructure development and industrial manufacturing. This dual demand from mass-market and high-performance applications positions carbon black as a critical enabler of durability and performance across industries, securing its relevance well into the next decade.
Restraint:
Regulatory Pressure and Feedstock Volatility Challenge Producers
The industry faces mounting challenges from volatile feedstock costs and tightening regulatory frameworks aimed at emissions reduction. Carbon black production is energy-intensive and reliant on petroleum-based raw materials, making it vulnerable to crude oil price fluctuations that directly erode producer margins. Furthermore, regulatory agencies in Europe, North America, and parts of Asia are enforcing stricter environmental norms to curb nitrogen oxide, sulfur dioxide, and particulate matter emissions from carbon black plants. With compliance costs rising by an estimated 15–20% for producers operating in regulated markets, smaller players risk losing competitiveness, accelerating industry consolidation. These constraints are reshaping investment strategies, with capital increasingly diverted toward cleaner technologies and sustainable alternatives.
Opportunity:
Sustainable Carbon Black and Emerging Markets Unlock New Growth
The most compelling growth opportunities lie in sustainable carbon black solutions, particularly recovered carbon black (rCB) derived from end-of-life tires. The rCB segment is projected to expand at a CAGR exceeding 10% through 2034, supported by regulatory incentives for recycling and growing demand from tire manufacturers seeking to reduce carbon footprints. Emerging economies also represent fertile ground for expansion: rising per capita income, rapid industrialization, and government-led infrastructure investments in Asia, Africa, and Latin America are set to boost consumption of carbon black in plastics, coatings, and construction materials. Strategic R&D initiatives aimed at developing high-dispersion and conductive carbon blacks for next-generation applications—such as EV batteries and advanced polymers—further amplify the long-term potential for investors and manufacturers willing to innovate.
Trend:
Consolidation, Automation, and ESG Shift Redefine Industry Dynamics
Industry dynamics in 2025 are defined by strategic consolidation and technological differentiation. Leading players such as Cabot Corporation, Birla Carbon, and Orion Engineered Carbons are pursuing mergers, joint ventures, and long-term feedstock agreements to safeguard supply stability and strengthen pricing power. At the same time, digitalization and process automation are being deployed to improve yield efficiency and reduce environmental impact, with AI-enabled quality monitoring emerging as a differentiator. Sustainability-focused trends, including closed-loop recycling and circular economy models, are moving from niche to mainstream, with major manufacturers committing to net-zero emission roadmaps. This shift is not only reshaping the competitive landscape but also signaling to investors that the carbon black industry is aligning with broader ESG imperatives while maintaining its central role in high-growth end markets.
Recent Developments
Dec 2024 – Orion Engineered Carbons S.A.: Orion announced the commissioning of a new specialty carbon black production line in Germany, adding an annual capacity of 30,000 metric tons to support demand from the coatings and polymers sectors. This expansion strengthens Orion’s leadership in high-margin specialty applications while reinforcing its European footprint.
Feb 2025 – Birla Carbon: Birla Carbon unveiled its next-generation sustainable carbon black product portfolio, featuring up to 40% recycled content, aimed at tire and plastics manufacturers. The launch positions the company as a front-runner in sustainable materials, appealing to OEMs under increasing ESG pressure.
Apr 2025 – Cabot Corporation: Cabot completed the acquisition of a mid-sized specialty carbon black producer in Southeast Asia, a deal valued at approximately USD 450 million. The move expands Cabot’s regional production capacity by 20% and provides strategic access to fast-growing ASEAN automotive and industrial markets.
Jul 2025 – Omsk Carbon Group: Omsk Carbon Group announced a partnership with a leading European tire manufacturer to supply recovered carbon black (rCB) for premium tire production. This collaboration enhances Omsk’s competitive positioning in sustainable materials and accelerates circular economy adoption in the tire sector.
Sep 2025 – Mitsubishi Chemical Corporation: Mitsubishi launched an AI-enabled process optimization system across its carbon black plants in Japan and China, expected to reduce energy consumption by 15% annually. This innovation underscores the company’s commitment to operational efficiency and environmental compliance, setting new benchmarks for digital transformation in the sector.