Carbon Credit Market Size, Share, Trend | CAGR of 17.9%
Global Carbon Credit Market Size, Share, Analysis Report By Type of Platform (Compliance Platforms, Voluntary Platforms), By Transaction Type (Spot Trading, Futures & Derivatives, Auctions), By End User (Corporates & Enterprises, Financial Institutions & Investors, Government & Regulatory Bodies, NGOs & Environmental Organizations, Others), Region and Key Players - Industry Segment Overview, Market Dynamics, Competitive Strategies, Trends and Forecast 2025-2034
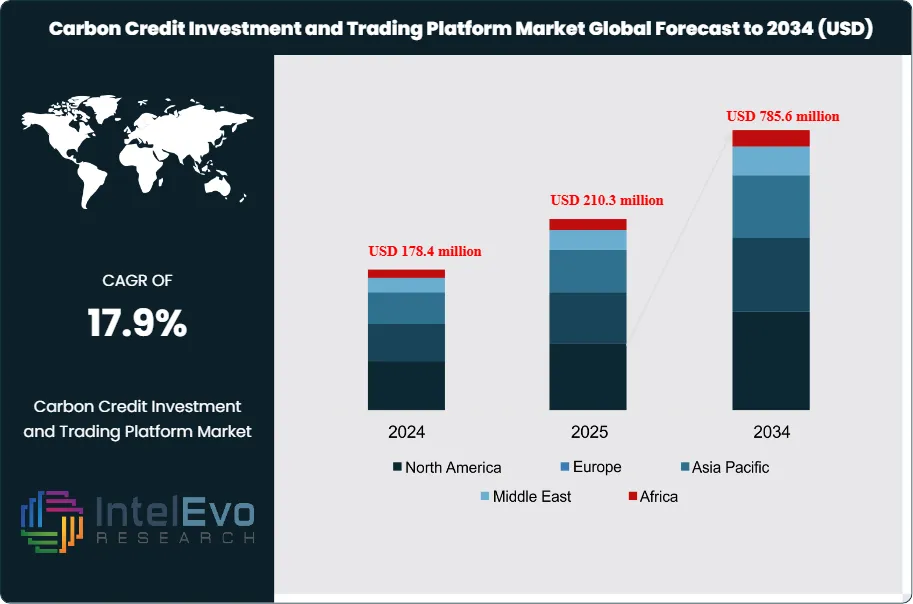
The Carbon Credit Investment and Trading Platform Market size is projected to reach approximately USD 785.6 million by 2034, up from USD 178.4 million in 2024, growing at a CAGR of 17.9% during the forecast period from 2025 to 2034. This growth is fueled by the accelerating global transition toward net-zero emissions, corporate sustainability goals, and the digitalization of carbon trading systems. The surge in voluntary and compliance carbon markets, along with government incentives and blockchain-based transparency solutions, is expected to drive robust expansion in the coming decade. As climate finance becomes a key investment frontier, carbon trading platforms are emerging as pivotal tools for achieving global decarbonization targets.
The Carbon Credit Market is gaining significant traction across various sectors as organizations and governments increasingly focus on reducing carbon emissions and achieving sustainability goals. Carbon credits, representing a reduction or removal of greenhouse gases, enable companies to offset their emissions by purchasing these credits, thereby contributing to environmental conservation and climate change mitigation efforts. This market is pivotal for organizations looking to meet regulatory requirements or voluntary commitments to reduce their carbon footprint.
In the energy and manufacturing sectors, carbon credits are essential for companies to balance emissions from energy-intensive operations. These industries are leveraging the carbon credit market to meet compliance targets set by government regulations, such as the EU Emissions Trading System (ETS). In addition, many corporations are participating in the voluntary carbon market, purchasing credits to align with corporate social responsibility (CSR) objectives and enhance their green credentials.
The agriculture and forestry sectors are also actively participating in the carbon credit market. Farmers and forest owners generate carbon credits by engaging in carbon sequestration practices, such as reforestation and sustainable land management, which absorb carbon dioxide from the atmosphere. These credits are then sold to companies seeking to offset their emissions.
Technological advancements in blockchain and artificial intelligence (AI) are playing a pivotal role in enhancing the transparency and efficiency of carbon credit transactions. Blockchain-based platforms are gaining prominence as they provide a secure and verifiable system for trading carbon credits, reducing the risk of fraud and increasing trust in the market. Moreover, innovations in renewable energy technologies and carbon capture and storage (CCS) are driving the supply of carbon credits, making the market more accessible and diverse.
Geographically, Europe and North America are the leading markets for carbon credits due to stringent emissions regulations and government-backed carbon trading schemes. However, the Asia-Pacific region is expected to experience the highest growth, driven by rapid industrialization, urbanization, and government initiatives aimed at reducing carbon emissions and transitioning to cleaner energy sources.
Key players in the carbon credit market include companies such as Verra, Gold Standard, and South Pole Group, which are focused on verifying and certifying carbon credits, facilitating global carbon trading, and offering comprehensive climate solutions. These organizations are driving the market forward by providing reliable frameworks for carbon credit generation and exchange.
Despite the market’s strong potential, challenges remain, including regulatory complexities across different regions, price volatility, and the need for more standardized frameworks for carbon credit certification. Additionally, the COVID-19 pandemic caused temporary disruptions in carbon trading activities and delayed emissions reduction projects, but the market is rebounding as economies recover and focus shifts back to climate change initiatives.
Key Takeaways
Market Growth: The Global Carbon Credit Investment and Trading Platform Market is growing rapidly, driven by stringent regulations, corporate sustainability goals, and increased adoption of blockchain for transparent carbon trading solutions.
Type Dominance: In the Global Carbon Credit Investment and Trading Platform Market, the Compliance Carbon Market (CCM) dominates, driven by government-mandated regulations and emissions trading schemes (ETS), such as the EU ETS, requiring companies to purchase carbon credits to meet legal emissions limits.
End User: The Enterprises/Corporates segment dominates the carbon credit investment and trading platform market. Corporations increasingly prioritize sustainability, aiming to meet regulatory requirements and achieve carbon neutrality, driving significant demand for carbon credits to offset their emissions and meet environmental goals.
Driver: Key drivers for the Global Carbon Credit Investment and Trading Platform Market include increasing regulatory pressure on emissions, heightened corporate sustainability initiatives, growing consumer awareness of environmental impact, and technological advancements like blockchain enhancing transparency and efficiency in carbon credit trading.
Restraint: A key restraint for the Global Carbon Credit Investment and Trading Platform Market is the lack of standardized regulations across regions, which complicates market integration, hinders trading efficiency, and creates uncertainty for both investors and market participants.
Opportunity: The Global Carbon Credit Investment and Trading Platform Market presents significant opportunities as businesses increasingly seek to offset emissions, governments implement stricter regulations, and technological advancements, such as blockchain, enhance transparency and efficiency in trading, attracting more investors and participants.
Trend: Carbon Credit Investment and Trading Platform Market include the rise of blockchain technology for enhanced transparency, the growth of voluntary carbon markets, increased corporate sustainability initiatives, and evolving regulatory frameworks aimed at reducing greenhouse gas emissions globally.
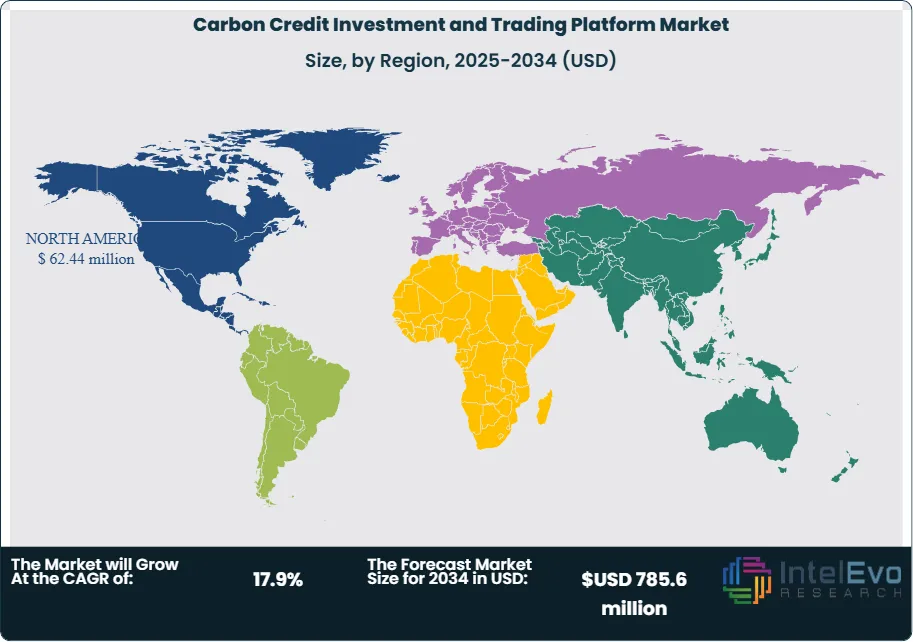
Regional Analysis: The Global Carbon Credit Investment and Trading Platform Market is dominated by North America and Europe, due to stringent regulations. Asia-Pacific shows rapid growth potential, while Latin America and the Middle East are emerging markets focusing on carbon trading initiatives.
Type Analysis:
The Compliance Carbon Market (CCM) dominates the Global Carbon Credit Investment and Trading Platform Market. Regulated by government authorities, these markets enforce legally binding limits on greenhouse gas emissions, compelling companies to acquire carbon credits to comply with environmental regulations. The stringent regulatory frameworks, such as the EU Emissions Trading System (ETS) and California Cap-and-Trade, drive significant participation from large corporations in energy-intensive sectors. This compliance creates a stable demand for carbon credits, ensuring market growth and increased investment in emissions reduction technologies. As global climate initiatives strengthen, the CCM will continue to be a pivotal element of carbon trading.
End-use Industry Analysis:
Enterprises and corporations are the dominant end users in the carbon credit trading market. These organizations actively seek carbon credits to meet sustainability targets and comply with regulatory requirements. Many companies are integrating carbon management strategies into their operations to mitigate their environmental impact. Industries such as energy, manufacturing, and transportation are particularly significant, as they are often subject to strict emissions regulations. By purchasing carbon credits, these businesses can offset their carbon footprints, enhance their corporate social responsibility (CSR) profiles, and improve investor relations. This growing focus on sustainability will further drive demand for carbon credits among enterprises.
Region Analysis:
North America Leads With 35% Market Share In Carbon Credit Investment and Trading Platform market. Europe stands out as the dominant region in the Global Carbon Credit Investment and Trading Platform Market, primarily driven by its robust regulatory frameworks and ambitious climate goals. The European Union (EU) has established one of the world's most comprehensive and effective carbon trading systems, known as the EU Emissions Trading System (ETS). This system mandates emissions reductions for large industries, such as power generation and manufacturing, compelling companies to purchase carbon credits to comply with regulatory requirements. The EU's commitment to achieving carbon neutrality by 2050 has further intensified the demand for carbon credits, positioning Europe at the forefront of carbon trading initiatives. Additionally, European nations are increasingly investing in voluntary carbon markets, allowing businesses to offset their emissions through sustainable projects, which bolsters the market further.
The region's strong focus on sustainability is complemented by significant investments in renewable energy and innovative technologies, including blockchain, to enhance transparency and efficiency in carbon trading. European companies are actively engaging in carbon offset projects, ranging from reforestation to renewable energy development, promoting biodiversity and environmental conservation. As a result, Europe not only leads in compliance carbon markets but also sets the stage for the growth of voluntary markets, making it a pivotal region in the global carbon credit landscape.
By Type of Platform (Compliance Platforms, Voluntary Platforms), By Transaction Type (Spot Trading, Futures & Derivatives, Auctions), By End User (Corporates & Enterprises, Financial Institutions & Investors, Government & Regulatory Bodies, NGOs & Environmental Organizations, Others)
Research Methodology
Primary Research- 100 Interviews of Stakeholders
Secondary Research
Desk Research
Regional scope
North America (United States, Canada, Mexico)
Latin America (Brazil, Argentina, Columbia)
East Asia And Pacific (China, Japan, South Korea, Australia, Cambodia, Fiji, Indonesia)
Sea And South Asia (India, Singapore, Thailand, Taiwan, Malaysia)
Eastern Europe (Poland, Russia, Czech Republic, Romania)
Western Europe (Germany, U.K., France, Spain, Itlay)
Middle East & Africa (GCC Countries, Egypt, Nigeria, South Africa, Israel)
Customization for segments, region/country-level will be provided. Moreover, additional customization can be done based on the requirements.
Pricing and Purchase Options
Avail customized purchase options to meet your exact research needs. We have three licenses to opt for: Single User License, Multi-User License (Up to 5 Users), Corporate Use License (Unlimited User and Printable PDF).
TABLE OF CONTENTS
1. EXECUTIVE SUMMARY
1.1. MARKET SNAPSHOT
1.2. KEY FINDINGS & INSIGHTS
1.3. ANALYST RECOMMENDATIONS
1.4. FUTURE OUTLOOK
2. RESEARCH METHODOLOGY
2.1. MARKET DEFINITION & SCOPE
2.2. RESEARCH OBJECTIVES: PRIMARY & SECONDARY DATA SOURCES
2.3. DATA COLLECTION SOURCES
2.3.1. COVERAGE OF 100+ PRIMARY RESEARCH/CONSULTATION CALLS WITH INDUSTRY STAKEHOLDERS
FIGURE 17 NORTH AMERICA CARBON CREDIT INVESTMENT AND TRADING PLATFORM CURRENT AND FUTURE TYPE ANALYSIS, 2025–2034, (USD MILLION)
FIGURE 18 NORTH AMERICA CARBON CREDIT INVESTMENT AND TRADING PLATFORM CURRENT AND FUTURE END USER ANALYSIS, 2025–2034, (USD MILLION)
FIGURE 19 MARKET SHARE BY COUNTRY
FIGURE 20 LATIN AMERICA CARBON CREDIT INVESTMENT AND TRADING PLATFORM CURRENT AND FUTURE TYPE ANALYSIS, 2025–2034, (USD MILLION)
FIGURE 21 LATIN AMERICA CARBON CREDIT INVESTMENT AND TRADING PLATFORM CURRENT AND FUTURE END USER ANALYSIS, 2025–2034, (USD MILLION)
FIGURE 22 MARKET SHARE BY COUNTRY
FIGURE 23 EASTERN EUROPE CARBON CREDIT INVESTMENT AND TRADING PLATFORM CURRENT AND FUTURE TYPE ANALYSIS, 2025–2034, (USD MILLION)
FIGURE 24 EASTERN EUROPE CARBON CREDIT INVESTMENT AND TRADING PLATFORM CURRENT AND FUTURE END USER ANALYSIS, 2025–2034, (USD MILLION)
FIGURE 25 MARKET SHARE BY COUNTRY
FIGURE 26 WESTERN EUROPE CARBON CREDIT INVESTMENT AND TRADING PLATFORM CURRENT AND FUTURE TYPE ANALYSIS, 2025–2034, (USD MILLION)
FIGURE 27 WESTERN EUROPE CARBON CREDIT INVESTMENT AND TRADING PLATFORM CURRENT AND FUTURE END USER ANALYSIS, 2025–2034, (USD MILLION)
FIGURE 28 MARKET SHARE BY COUNTRY
FIGURE 29 EAST ASIA AND PACIFIC CARBON CREDIT INVESTMENT AND TRADING PLATFORM CURRENT AND FUTURE TYPE ANALYSIS, 2025–2034, (USD MILLION)
FIGURE 30 EAST ASIA AND PACIFIC CARBON CREDIT INVESTMENT AND TRADING PLATFORM CURRENT AND FUTURE END USER ANALYSIS, 2025–2034, (USD MILLION)
FIGURE 31 MARKET SHARE BY COUNTRY
FIGURE 32 SEA AND SOUTH ASIA CARBON CREDIT INVESTMENT AND TRADING PLATFORM CURRENT AND FUTURE TYPE ANALYSIS, 2025–2034, (USD MILLION)
FIGURE 33 SEA AND SOUTH ASIA CARBON CREDIT INVESTMENT AND TRADING PLATFORM CURRENT AND FUTURE END USER ANALYSIS, 2025–2034, (USD MILLION)
FIGURE 34 MARKET SHARE BY COUNTRY
FIGURE 35 MIDDLE EAST AND AFRICA CARBON CREDIT INVESTMENT AND TRADING PLATFORM CURRENT AND FUTURE TYPE ANALYSIS, 2025–2034, (USD MILLION)
FIGURE 36 MIDDLE EAST AND AFRICA CARBON CREDIT INVESTMENT AND TRADING PLATFORM CURRENT AND FUTURE END USER ANALYSIS, 2025–2034, (USD MILLION)
FIGURE 37 NORTH AMERICA CARBON CREDIT INVESTMENT AND TRADING PLATFORM CURRENT AND FUTURE MARKET VOLUME SHARE REGIONAL ANALYSIS, 2025–2034, (USD MILLION)
FIGURE 38 U.S. CARBON CREDIT INVESTMENT AND TRADING PLATFORM CURRENT AND FUTURE TYPE ANALYSIS, 2025–2034, (USD MILLION)
FIGURE 39 U.S. CARBON CREDIT INVESTMENT AND TRADING PLATFORM CURRENT AND FUTURE END USER ANALYSIS, 2025–2034, (USD MILLION)
FIGURE 40 CANADA CARBON CREDIT INVESTMENT AND TRADING PLATFORM CURRENT AND FUTURE TYPE ANALYSIS, 2025–2034, (USD MILLION)
FIGURE 41 CANADA CARBON CREDIT INVESTMENT AND TRADING PLATFORM CURRENT AND FUTURE END USER ANALYSIS, 2025–2034, (USD MILLION)
FIGURE 42 LATIN AMERICA CARBON CREDIT INVESTMENT AND TRADING PLATFORM CURRENT AND FUTURE MARKET VOLUME SHARE REGIONAL ANALYSIS, 2025–2034, (USD MILLION)
FIGURE 43 MEXICO CARBON CREDIT INVESTMENT AND TRADING PLATFORM CURRENT AND FUTURE TYPE ANALYSIS, 2025–2034, (USD MILLION)
FIGURE 44 MEXICO CARBON CREDIT INVESTMENT AND TRADING PLATFORM CURRENT AND FUTURE END USER ANALYSIS, 2025–2034, (USD MILLION)
FIGURE 45 BRAZIL CARBON CREDIT INVESTMENT AND TRADING PLATFORM CURRENT AND FUTURE TYPE ANALYSIS, 2025–2034, (USD MILLION)
FIGURE 46 BRAZIL CARBON CREDIT INVESTMENT AND TRADING PLATFORM CURRENT AND FUTURE END USER ANALYSIS, 2025–2034, (USD MILLION)
FIGURE 47 ARGENTINA CARBON CREDIT INVESTMENT AND TRADING PLATFORM CURRENT AND FUTURE TYPE ANALYSIS, 2025–2034, (USD MILLION)
FIGURE 48 ARGENTINA CARBON CREDIT INVESTMENT AND TRADING PLATFORM CURRENT AND FUTURE END USER ANALYSIS, 2025–2034, (USD MILLION)
FIGURE 49 COLUMBIA CARBON CREDIT INVESTMENT AND TRADING PLATFORM CURRENT AND FUTURE TYPE ANALYSIS, 2025–2034, (USD MILLION)
FIGURE 50 COLUMBIA CARBON CREDIT INVESTMENT AND TRADING PLATFORM CURRENT AND FUTURE END USER ANALYSIS, 2025–2034, (USD MILLION)
FIGURE 51 REST OF LATIN AMERICA CARBON CREDIT INVESTMENT AND TRADING PLATFORM CURRENT AND FUTURE TYPE ANALYSIS, 2025–2034, (USD MILLION)
FIGURE 52 REST OF LATIN AMERICA CARBON CREDIT INVESTMENT AND TRADING PLATFORM CURRENT AND FUTURE END USER ANALYSIS, 2025–2034, (USD MILLION)
FIGURE 53 EASTERN EUROPE CARBON CREDIT INVESTMENT AND TRADING PLATFORM CURRENT AND FUTURE MARKET VOLUME SHARE REGIONAL ANALYSIS, 2025–2034, (USD MILLION)
FIGURE 54 POLAND CARBON CREDIT INVESTMENT AND TRADING PLATFORM CURRENT AND FUTURE TYPE ANALYSIS, 2025–2034, (USD MILLION)
FIGURE 55 POLAND CARBON CREDIT INVESTMENT AND TRADING PLATFORM CURRENT AND FUTURE END USER ANALYSIS, 2025–2034, (USD MILLION)
FIGURE 56 RUSSIA CARBON CREDIT INVESTMENT AND TRADING PLATFORM CURRENT AND FUTURE TYPE ANALYSIS, 2025–2034, (USD MILLION)
FIGURE 57 RUSSIA CARBON CREDIT INVESTMENT AND TRADING PLATFORM CURRENT AND FUTURE END USER ANALYSIS, 2025–2034, (USD MILLION)
FIGURE 58 CZECH REPUBLIC CARBON CREDIT INVESTMENT AND TRADING PLATFORM CURRENT AND FUTURE TYPE ANALYSIS, 2025–2034, (USD MILLION)
FIGURE 59 CZECH REPUBLIC CARBON CREDIT INVESTMENT AND TRADING PLATFORM CURRENT AND FUTURE END USER ANALYSIS, 2025–2034, (USD MILLION)
FIGURE 60 ROMANIA CARBON CREDIT INVESTMENT AND TRADING PLATFORM CURRENT AND FUTURE TYPE ANALYSIS, 2025–2034, (USD MILLION)
FIGURE 61 ROMANIA CARBON CREDIT INVESTMENT AND TRADING PLATFORM CURRENT AND FUTURE END USER ANALYSIS, 2025–2034, (USD MILLION)
FIGURE 62 REST OF EASTERN EUROPE CARBON CREDIT INVESTMENT AND TRADING PLATFORM CURRENT AND FUTURE TYPE ANALYSIS, 2025–2034, (USD MILLION)
FIGURE 63 REST OF EASTERN EUROPE CARBON CREDIT INVESTMENT AND TRADING PLATFORM CURRENT AND FUTURE END USER ANALYSIS, 2025–2034, (USD MILLION)
FIGURE 64 WESTERN EUROPE CARBON CREDIT INVESTMENT AND TRADING PLATFORM CURRENT AND FUTURE MARKET VOLUME SHARE REGIONAL ANALYSIS, 2025–2034, (USD MILLION)
FIGURE 65 GERMANY CARBON CREDIT INVESTMENT AND TRADING PLATFORM CURRENT AND FUTURE TYPE ANALYSIS, 2025–2034, (USD MILLION)
FIGURE 66 GERMANY CARBON CREDIT INVESTMENT AND TRADING PLATFORM CURRENT AND FUTURE END USER ANALYSIS, 2025–2034, (USD MILLION)
FIGURE 67 FRANCE CARBON CREDIT INVESTMENT AND TRADING PLATFORM CURRENT AND FUTURE TYPE ANALYSIS, 2025–2034, (USD MILLION)
FIGURE 68 FRANCE CARBON CREDIT INVESTMENT AND TRADING PLATFORM CURRENT AND FUTURE END USER ANALYSIS, 2025–2034, (USD MILLION)
FIGURE 69 UK CARBON CREDIT INVESTMENT AND TRADING PLATFORM CURRENT AND FUTURE TYPE ANALYSIS, 2025–2034, (USD MILLION)
FIGURE 70 UK CARBON CREDIT INVESTMENT AND TRADING PLATFORM CURRENT AND FUTURE END USER ANALYSIS, 2025–2034, (USD MILLION)
FIGURE 71 SPAIN CARBON CREDIT INVESTMENT AND TRADING PLATFORM CURRENT AND FUTURE TYPE ANALYSIS, 2025–2034, (USD MILLION)
FIGURE 72 SPAIN CARBON CREDIT INVESTMENT AND TRADING PLATFORM CURRENT AND FUTURE END USER ANALYSIS, 2025–2034, (USD MILLION)
FIGURE 73 ITALY CARBON CREDIT INVESTMENT AND TRADING PLATFORM CURRENT AND FUTURE TYPE ANALYSIS, 2025–2034, (USD MILLION)
FIGURE 74 ITALY CARBON CREDIT INVESTMENT AND TRADING PLATFORM CURRENT AND FUTURE END USER ANALYSIS, 2025–2034, (USD MILLION)
FIGURE 75 REST OF WESTERN EUROPE CARBON CREDIT INVESTMENT AND TRADING PLATFORM CURRENT AND FUTURE TYPE ANALYSIS, 2025–2034, (USD MILLION)
FIGURE 76 REST OF WESTERN EUROPE CARBON CREDIT INVESTMENT AND TRADING PLATFORM CURRENT AND FUTURE END USER ANALYSIS, 2025–2034, (USD MILLION)
FIGURE 77 EAST ASIA AND PACIFIC CARBON CREDIT INVESTMENT AND TRADING PLATFORM CURRENT AND FUTURE MARKET VOLUME SHARE REGIONAL ANALYSIS, 2025–2034, (USD MILLION)
FIGURE 78 CHINA CARBON CREDIT INVESTMENT AND TRADING PLATFORM CURRENT AND FUTURE TYPE ANALYSIS, 2025–2034, (USD MILLION)
FIGURE 79 CHINA CARBON CREDIT INVESTMENT AND TRADING PLATFORM CURRENT AND FUTURE END USER ANALYSIS, 2025–2034, (USD MILLION)
FIGURE 80 JAPAN CARBON CREDIT INVESTMENT AND TRADING PLATFORM CURRENT AND FUTURE TYPE ANALYSIS, 2025–2034, (USD MILLION)
FIGURE 81 JAPAN CARBON CREDIT INVESTMENT AND TRADING PLATFORM CURRENT AND FUTURE END USER ANALYSIS, 2025–2034, (USD MILLION)
FIGURE 82 AUSTRALIA CARBON CREDIT INVESTMENT AND TRADING PLATFORM CURRENT AND FUTURE TYPE ANALYSIS, 2025–2034, (USD MILLION)
FIGURE 83 AUSTRALIA CARBON CREDIT INVESTMENT AND TRADING PLATFORM CURRENT AND FUTURE END USER ANALYSIS, 2025–2034, (USD MILLION)
FIGURE 84 CAMBODIA CARBON CREDIT INVESTMENT AND TRADING PLATFORM CURRENT AND FUTURE TYPE ANALYSIS, 2025–2034, (USD MILLION)
FIGURE 85 CAMBODIA CARBON CREDIT INVESTMENT AND TRADING PLATFORM CURRENT AND FUTURE END USER ANALYSIS, 2025–2034, (USD MILLION)
FIGURE 86 FIJI CARBON CREDIT INVESTMENT AND TRADING PLATFORM CURRENT AND FUTURE TYPE ANALYSIS, 2025–2034, (USD MILLION)
FIGURE 87 FIJI CARBON CREDIT INVESTMENT AND TRADING PLATFORM CURRENT AND FUTURE END USER ANALYSIS, 2025–2034, (USD MILLION)
FIGURE 88 INDONESIA CARBON CREDIT INVESTMENT AND TRADING PLATFORM CURRENT AND FUTURE TYPE ANALYSIS, 2025–2034, (USD MILLION)
FIGURE 89 INDONESIA CARBON CREDIT INVESTMENT AND TRADING PLATFORM CURRENT AND FUTURE END USER ANALYSIS, 2025–2034, (USD MILLION)
FIGURE 90 SOUTH KOREA CARBON CREDIT INVESTMENT AND TRADING PLATFORM CURRENT AND FUTURE TYPE ANALYSIS, 2025–2034, (USD MILLION)
FIGURE 91 SOUTH KOREA CARBON CREDIT INVESTMENT AND TRADING PLATFORM CURRENT AND FUTURE END USER ANALYSIS, 2025–2034, (USD MILLION)
FIGURE 92 REST OF EAST ASIA AND PACIFIC CARBON CREDIT INVESTMENT AND TRADING PLATFORM CURRENT AND FUTURE TYPE ANALYSIS, 2025–2034, (USD MILLION)
FIGURE 93 REST OF EAST ASIA AND PACIFIC CARBON CREDIT INVESTMENT AND TRADING PLATFORM CURRENT AND FUTURE END USER ANALYSIS, 2025–2034, (USD MILLION)
FIGURE 94 SEA AND SOUTH ASIA CARBON CREDIT INVESTMENT AND TRADING PLATFORM CURRENT AND FUTURE MARKET VOLUME SHARE REGIONAL ANALYSIS, 2025–2034, (USD MILLION)
FIGURE 95 BANGLADESH CARBON CREDIT INVESTMENT AND TRADING PLATFORM CURRENT AND FUTURE TYPE ANALYSIS, 2025–2034, (USD MILLION)
FIGURE 96 BANGLADESH CARBON CREDIT INVESTMENT AND TRADING PLATFORM CURRENT AND FUTURE END USER ANALYSIS, 2025–2034, (USD MILLION)
FIGURE 97 NEW ZEALAND CARBON CREDIT INVESTMENT AND TRADING PLATFORM CURRENT AND FUTURE TYPE ANALYSIS, 2025–2034, (USD MILLION)
FIGURE 98 NEW ZEALAND CARBON CREDIT INVESTMENT AND TRADING PLATFORM CURRENT AND FUTURE END USER ANALYSIS, 2025–2034, (USD MILLION)
FIGURE 99 INDIA CARBON CREDIT INVESTMENT AND TRADING PLATFORM CURRENT AND FUTURE TYPE ANALYSIS, 2025–2034, (USD MILLION)
FIGURE 100 INDIA CARBON CREDIT INVESTMENT AND TRADING PLATFORM CURRENT AND FUTURE END USER ANALYSIS, 2025–2034, (USD MILLION)
FIGURE 101 SINGAPORE CARBON CREDIT INVESTMENT AND TRADING PLATFORM CURRENT AND FUTURE TYPE ANALYSIS, 2025–2034, (USD MILLION)
FIGURE 102 SINGAPORE CARBON CREDIT INVESTMENT AND TRADING PLATFORM CURRENT AND FUTURE END USER ANALYSIS, 2025–2034, (USD MILLION)
FIGURE 103 THAILAND CARBON CREDIT INVESTMENT AND TRADING PLATFORM CURRENT AND FUTURE TYPE ANALYSIS, 2025–2034, (USD MILLION)
FIGURE 104 THAILAND CARBON CREDIT INVESTMENT AND TRADING PLATFORM CURRENT AND FUTURE END USER ANALYSIS, 2025–2034, (USD MILLION)
FIGURE 105 TAIWAN CARBON CREDIT INVESTMENT AND TRADING PLATFORM CURRENT AND FUTURE TYPE ANALYSIS, 2025–2034, (USD MILLION)
FIGURE 106 TAIWAN CARBON CREDIT INVESTMENT AND TRADING PLATFORM CURRENT AND FUTURE END USER ANALYSIS, 2025–2034, (USD MILLION)
FIGURE 107 MALAYSIA CARBON CREDIT INVESTMENT AND TRADING PLATFORM CURRENT AND FUTURE TYPE ANALYSIS, 2025–2034, (USD MILLION)
FIGURE 108 MALAYSIA CARBON CREDIT INVESTMENT AND TRADING PLATFORM CURRENT AND FUTURE END USER ANALYSIS, 2025–2034, (USD MILLION)
FIGURE 109 REST OF SEA AND SOUTH ASIA CARBON CREDIT INVESTMENT AND TRADING PLATFORM CURRENT AND FUTURE TYPE ANALYSIS, 2025–2034, (USD MILLION)
FIGURE 110 REST OF SEA AND SOUTH ASIA CARBON CREDIT INVESTMENT AND TRADING PLATFORM CURRENT AND FUTURE END USER ANALYSIS, 2025–2034, (USD MILLION)
FIGURE 111 MIDDLE EAST AND AFRICA CARBON CREDIT INVESTMENT AND TRADING PLATFORM CURRENT AND FUTURE MARKET VOLUME SHARE REGIONAL ANALYSIS, 2025–2034, (USD MILLION)
FIGURE 112 GCC COUNTRIES CARBON CREDIT INVESTMENT AND TRADING PLATFORM CURRENT AND FUTURE TYPE ANALYSIS, 2025–2034, (USD MILLION)
FIGURE 113 GCC COUNTRIES CARBON CREDIT INVESTMENT AND TRADING PLATFORM CURRENT AND FUTURE END USER ANALYSIS, 2025–2034, (USD MILLION)
FIGURE 114 SAUDI ARABIA CARBON CREDIT INVESTMENT AND TRADING PLATFORM CURRENT AND FUTURE TYPE ANALYSIS, 2025–2034, (USD MILLION)
FIGURE 115 SAUDI ARABIA CARBON CREDIT INVESTMENT AND TRADING PLATFORM CURRENT AND FUTURE END USER ANALYSIS, 2025–2034, (USD MILLION)
FIGURE 116 UAE CARBON CREDIT INVESTMENT AND TRADING PLATFORM CURRENT AND FUTURE TYPE ANALYSIS, 2025–2034, (USD MILLION)
FIGURE 117 UAE CARBON CREDIT INVESTMENT AND TRADING PLATFORM CURRENT AND FUTURE END USER ANALYSIS, 2025–2034, (USD MILLION)
FIGURE 118 BAHRAIN CARBON CREDIT INVESTMENT AND TRADING PLATFORM CURRENT AND FUTURE TYPE ANALYSIS, 2025–2034, (USD MILLION)
FIGURE 119 BAHRAIN CARBON CREDIT INVESTMENT AND TRADING PLATFORM CURRENT AND FUTURE END USER ANALYSIS, 2025–2034, (USD MILLION)
FIGURE 120 KUWAIT CARBON CREDIT INVESTMENT AND TRADING PLATFORM CURRENT AND FUTURE TYPE ANALYSIS, 2025–2034, (USD MILLION)
FIGURE 121 KUWAIT CARBON CREDIT INVESTMENT AND TRADING PLATFORM CURRENT AND FUTURE END USER ANALYSIS, 2025–2034, (USD MILLION)
FIGURE 122 OMAN CARBON CREDIT INVESTMENT AND TRADING PLATFORM CURRENT AND FUTURE TYPE ANALYSIS, 2025–2034, (USD MILLION)
FIGURE 123 OMAN CARBON CREDIT INVESTMENT AND TRADING PLATFORM CURRENT AND FUTURE END USER ANALYSIS, 2025–2034, (USD MILLION)
FIGURE 124 QATAR CARBON CREDIT INVESTMENT AND TRADING PLATFORM CURRENT AND FUTURE TYPE ANALYSIS, 2025–2034, (USD MILLION)
FIGURE 125 QATAR CARBON CREDIT INVESTMENT AND TRADING PLATFORM CURRENT AND FUTURE END USER ANALYSIS, 2025–2034, (USD MILLION)
FIGURE 126 EGYPT CARBON CREDIT INVESTMENT AND TRADING PLATFORM CURRENT AND FUTURE TYPE ANALYSIS, 2025–2034, (USD MILLION)
FIGURE 127 EGYPT CARBON CREDIT INVESTMENT AND TRADING PLATFORM CURRENT AND FUTURE END USER ANALYSIS, 2025–2034, (USD MILLION)
FIGURE 128 NIGERIA CARBON CREDIT INVESTMENT AND TRADING PLATFORM CURRENT AND FUTURE TYPE ANALYSIS, 2025–2034, (USD MILLION)
FIGURE 129 NIGERIA CARBON CREDIT INVESTMENT AND TRADING PLATFORM CURRENT AND FUTURE END USER ANALYSIS, 2025–2034, (USD MILLION)
FIGURE 130 SOUTH AFRICA CARBON CREDIT INVESTMENT AND TRADING PLATFORM CURRENT AND FUTURE TYPE ANALYSIS, 2025–2034, (USD MILLION)
FIGURE 131 SOUTH AFRICA CARBON CREDIT INVESTMENT AND TRADING PLATFORM CURRENT AND FUTURE END USER ANALYSIS, 2025–2034, (USD MILLION)
FIGURE 132 ISRAEL CARBON CREDIT INVESTMENT AND TRADING PLATFORM CURRENT AND FUTURE TYPE ANALYSIS, 2025–2034, (USD MILLION)
FIGURE 133 ISRAEL CARBON CREDIT INVESTMENT AND TRADING PLATFORM CURRENT AND FUTURE END USER ANALYSIS, 2025–2034, (USD MILLION)
FIGURE 134 REST OF MEA CARBON CREDIT INVESTMENT AND TRADING PLATFORM CURRENT AND FUTURE TYPE ANALYSIS, 2025–2034, (USD MILLION)
FIGURE 135 REST OF MEA CARBON CREDIT INVESTMENT AND TRADING PLATFORM CURRENT AND FUTURE END USER ANALYSIS, 2025–2034, (USD MILLION)
FIGURE 136 U. S. MARKET SHARE ANALYSIS BY TYPE (2024)
FIGURE 137 U. S. MARKET SHARE ANALYSIS BY END USER (2024)
FIGURE 138 CANADA MARKET SHARE ANALYSIS BY TYPE (2024)
FIGURE 139 CANADA MARKET SHARE ANALYSIS BY END USER (2024)
FIGURE 140 MEXICO MARKET SHARE ANALYSIS BY TYPE (2024)
FIGURE 141 MEXICO MARKET SHARE ANALYSIS BY END USER (2024)
FIGURE 142 CHINA MARKET SHARE ANALYSIS BY TYPE (2024)
FIGURE 143 CHINA MARKET SHARE ANALYSIS BY END USER (2024)
FIGURE 144 JAPAN MARKET SHARE ANALYSIS BY TYPE (2024)
FIGURE 145 JAPAN MARKET SHARE ANALYSIS BY END USER (2024)
FIGURE 146 INDIA MARKET SHARE ANALYSIS BY TYPE (2024)
FIGURE 147 INDIA MARKET SHARE ANALYSIS BY END USER (2024)
FIGURE 148 SOUTH KOREA MARKET SHARE ANALYSIS BY TYPE (2024)
FIGURE 149 SOUTH KOREA MARKET SHARE ANALYSIS BY END USER (2024)
FIGURE 150 SAUDI ARABIA MARKET SHARE ANALYSIS BY TYPE (2024)
FIGURE 151 SAUDI ARABIA MARKET SHARE ANALYSIS BY END USER (2024)
FIGURE 152 UAE MARKET SHARE ANALYSIS BY TYPE (2024)
FIGURE 153 UAE MARKET SHARE ANALYSIS BY END USER (2024)
FIGURE 154 EGYPT MARKET SHARE ANALYSIS BY TYPE (2024)
FIGURE 155 EGYPT MARKET SHARE ANALYSIS BY END USER (2024)
FIGURE 156 NIGERIA MARKET SHARE ANALYSIS BY TYPE (2024)
FIGURE 157 NIGERIA MARKET SHARE ANALYSIS BY END USER (2024)
FIGURE 158 SOUTH AFRICA MARKET SHARE ANALYSIS BY TYPE (2024)
FIGURE 159 SOUTH AFRICA MARKET SHARE ANALYSIS BY END USER (2024)
FIGURE 160 GERMANY MARKET SHARE ANALYSIS BY TYPE (2024)
FIGURE 161 GERMANY MARKET SHARE ANALYSIS BY END USER (2024)
FIGURE 162 FRANCE MARKET SHARE ANALYSIS BY TYPE (2024)
FIGURE 163 FRANCE MARKET SHARE ANALYSIS BY END USER (2024)
FIGURE 164 UK MARKET SHARE ANALYSIS BY TYPE (2024)
FIGURE 165 UK MARKET SHARE ANALYSIS BY END USER (2024)
FIGURE 166 SPAIN MARKET SHARE ANALYSIS BY TYPE (2024)
FIGURE 167 SPAIN MARKET SHARE ANALYSIS BY END USER (2024)
FIGURE 168 ITALY MARKET SHARE ANALYSIS BY TYPE (2024)
FIGURE 169 ITALY MARKET SHARE ANALYSIS BY END USER (2024)
FIGURE 170 BRAZIL MARKET SHARE ANALYSIS BY TYPE (2024)
FIGURE 171 BRAZIL MARKET SHARE ANALYSIS BY END USER (2024)
FIGURE 172 ARGENTINA MARKET SHARE ANALYSIS BY TYPE (2024)
FIGURE 173 ARGENTINA MARKET SHARE ANALYSIS BY END USER (2024)
FIGURE 174 COLUMBIA MARKET SHARE ANALYSIS BY TYPE (2024)
FIGURE 175 COLUMBIA MARKET SHARE ANALYSIS BY END USER (2024)
FIGURE 176 GLOBAL CARBON CREDIT INVESTMENT AND TRADING PLATFORM CURRENT AND FUTURE MARKET KEY COUNTRY LEVEL ANALYSIS, 2024–2034, (USD MILLION)
FIGURE 177 FINANCIAL OVERVIEW:
Key Players Analysis:
Verra: Verra is a leading non-profit organization that develops and manages standards for climate action and sustainable development. Its Verified Carbon Standard (VCS) is widely recognized, enabling various projects to generate carbon credits. Verra supports initiatives in forestry, agriculture, and renewable energy. Its transparent certification process promotes credibility in the carbon market, making it a pivotal player in the global carbon credit ecosystem.
Gold Standard: Gold Standard is a certification body focused on ensuring that climate and development projects deliver real, measurable benefits. Established by WWF and other NGOs, it certifies projects that generate carbon credits, emphasizing sustainable development. Gold Standard’s rigorous criteria enhance the credibility of carbon offsets, attracting buyers who prioritize environmental integrity and social responsibility. Their platform facilitates transparent trading of high-quality carbon credits.
AirCarbon Exchange: AirCarbon Exchange is a Singapore-based digital carbon trading platform that utilizes blockchain technology to enhance transparency and security. It focuses on facilitating trading of carbon credits in a standardized manner, allowing participants to buy, sell, and retire credits efficiently. By leveraging smart contracts, AirCarbon ensures secure transactions and reduced operational risks. The platform's innovative approach positions it as a key player in the evolving carbon market.
ClimateTrade: ClimateTrade is a blockchain-based platform that connects companies seeking to offset their carbon emissions with verified environmental projects. It enables direct trading of carbon credits, providing transparency and traceability for each transaction. ClimateTrade focuses on sustainable development initiatives across various sectors, including renewable energy and reforestation. Its user-friendly interface and commitment to environmental integrity make it a popular choice among businesses aiming for carbon neutrality.
CARBONEX: CARBONEX is a comprehensive carbon trading platform that facilitates the buying, selling, and retirement of carbon credits. It focuses on providing a user-friendly interface and robust analytics tools to enhance the trading experience. CARBONEX connects various stakeholders, including businesses and project developers, promoting efficient market operations. Its emphasis on transparency and regulatory compliance positions it as a reliable player in the carbon credit marketplace.
Natural Capital Partners: Natural Capital Partners is a leading provider of carbon neutrality solutions, helping businesses achieve their sustainability goals through carbon offsetting. The company partners with various projects globally to source high-quality carbon credits, ensuring environmental integrity. Natural Capital’s extensive portfolio includes renewable energy, reforestation, and community-based projects. Their expertise in carbon markets and commitment to sustainability makes them a trusted partner for organizations seeking to offset emissions.
Market Key Players
Verra
Gold Standard
South Pole
Ecosystem Marketplace
AirCarbon Exchange
Cloverly
Carbon Trade Exchange
ClimateTrade
Carbon Credit Capital
EcoAct
Plan Vivo
BluSky
Offset Earth
Ecoligo
Treedom
Planetly
Forest Trends
Nori
Trove Research
Sustainable Investment Group
Driver:
Increasing Regulatory Pressure on Carbon Emissions Drives Market Growth
Governments worldwide are implementing stringent regulations aimed at reducing greenhouse gas emissions, driving demand for carbon credit trading platforms. These regulations, such as carbon pricing and cap-and-trade systems, compel companies to buy carbon credits to comply with emission limits. As a result, organizations are increasingly turning to carbon credit platforms to manage their carbon footprint effectively. This regulatory environment fosters market growth by creating a structured trading system that incentivizes emission reductions and facilitates compliance for businesses.
Corporate Sustainability Initiatives Promote Investment in Carbon Credit Trading Platforms
Corporations are increasingly committing to sustainability goals and net-zero emissions targets, leading to a surge in demand for carbon credits. Businesses recognize that purchasing carbon credits is an effective strategy to offset their emissions while enhancing their corporate social responsibility (CSR) profile. As investors and consumers prioritize environmentally friendly practices, companies are under pressure to demonstrate their commitment to sustainability. This shift drives investment in carbon credit trading platforms, creating a robust market for carbon credit transactions and related services.
Technological Advancements Enhance Transparency and Efficiency in Carbon Trading
Technological innovations, particularly blockchain, are revolutionizing the carbon credit trading landscape by enhancing transparency and security. Blockchain-based platforms offer immutable records of transactions, allowing for real-time tracking and verification of carbon credits. This increased transparency builds trust among market participants and facilitates smoother trading processes. Furthermore, advancements in data analytics and artificial intelligence improve the efficiency of trading operations by enabling better pricing strategies and market insights. These technological enhancements are essential for the sustainable growth of the carbon credit market.
Restrain:
Regulatory Uncertainties Impacting Market Stability and Growth Potential
Regulatory uncertainties pose a significant challenge to the Global Carbon Credit Investment and Trading Platform Market. Different countries have varying regulations regarding carbon credits, which can lead to inconsistencies and confusion among market participants. This lack of a unified regulatory framework may deter investments and slow down market adoption. Additionally, changes in government policies can create a volatile environment, making it difficult for businesses to plan long-term strategies. Such unpredictability hinders the overall growth potential of the market.
Limited Awareness and Understanding Among Stakeholders in Carbon Trading
Limited awareness and understanding of carbon trading mechanisms among stakeholders can restrain market growth. Many businesses, especially small and medium enterprises (SMEs), may not fully comprehend how carbon credits work or their benefits in offsetting emissions. This lack of knowledge can lead to hesitance in participation, preventing the development of a robust trading ecosystem. Education and outreach initiatives are essential to enhance understanding, but without them, many potential market participants may remain unaware of the opportunities carbon trading offers.
High Transaction Costs Deter Participation in Carbon Credit Markets
High transaction costs associated with trading carbon credits can significantly deter market participation. Fees for trading on various platforms, along with costs related to verification and certification of carbon credits, can be burdensome for many organizations, particularly SMEs. These costs can eat into the financial benefits of participating in carbon markets, making them less attractive. To foster market growth, it is essential to streamline processes and reduce associated costs, enabling broader access and participation in carbon trading.
Opportunities:
Expanding Compliance Markets Create Opportunities for Carbon Credit Trading Platforms
As governments worldwide implement stricter emissions regulations, compliance markets for carbon credits are expanding. This growth presents significant opportunities for trading platforms to offer tailored solutions that help businesses comply with legal requirements. By developing user-friendly interfaces and robust analytics tools, platforms can facilitate efficient trading, attract more users, and ultimately enhance market liquidity. The increasing emphasis on corporate accountability further drives demand for these specialized trading solutions.
Technological Advancements Drive Innovation in Carbon Credit Trading Platforms
The rise of innovative technologies such as blockchain and AI presents a unique opportunity for carbon credit trading platforms. By leveraging blockchain, platforms can enhance transparency, security, and traceability in transactions, which builds trust among users. AI can improve pricing models and market analysis, enabling better decision-making for traders. Investing in these technologies can differentiate platforms in a competitive market, attracting more participants and fostering sustainable practices.
Growing Public Awareness and Demand for Carbon Offsetting Solutions
As awareness of climate change increases, individuals and businesses are seeking ways to offset their carbon footprints. This trend presents a significant opportunity for carbon credit trading platforms to expand their offerings to include personalized carbon offsetting solutions. By providing educational resources and accessible tools for purchasing credits, platforms can engage a broader audience. Catering to socially conscious consumers can enhance brand loyalty and contribute to overall market growth.
Trends:
Regulatory Developments Encouraging Participation in Compliance Carbon Markets
Governments worldwide are implementing stricter regulations to combat climate change, driving participation in compliance carbon markets. Cap-and-trade systems and emissions trading schemes are becoming more prevalent, requiring industries to purchase carbon credits to comply with emissions reduction targets. This regulatory pressure not only creates a more structured market but also incentivizes companies to invest in cleaner technologies. As regulations evolve, the compliance market is expected to grow significantly, attracting more participants.
Recent Development
September 2023- Major corporations, including tech giants and energy firms, are increasing their investments in voluntary carbon markets, leading to the establishment of new trading platforms. These platforms aim to facilitate easier access for companies and individuals looking to offset their carbon emissions through sustainable projects.